

Key Insights
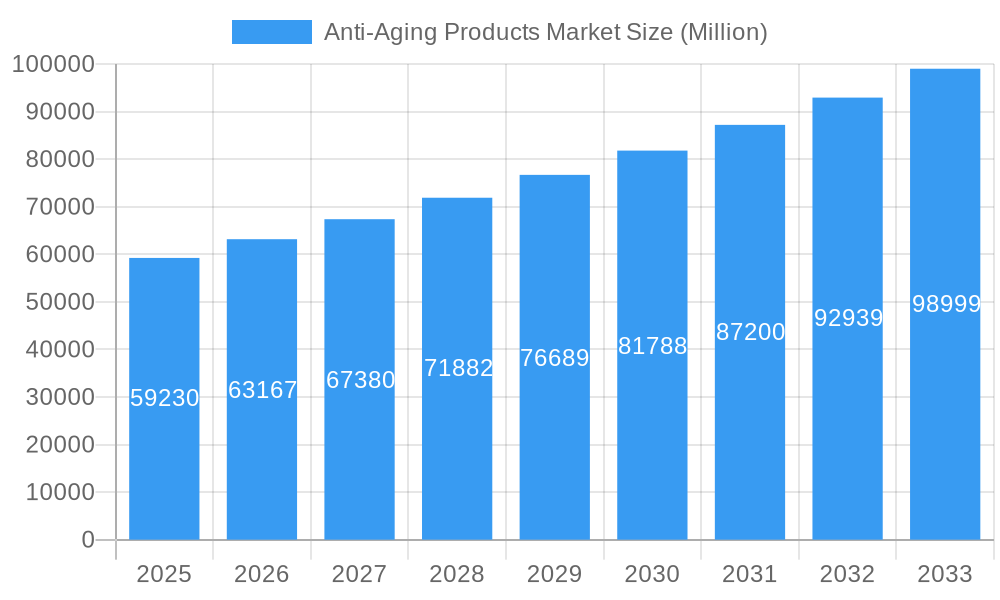
The global anti-aging products market, valued at $59.23 billion in 2025, is projected to experience robust growth, driven by a rising aging population globally and increasing consumer awareness of skincare and anti-aging solutions. The market's Compound Annual Growth Rate (CAGR) of 6.62% from 2025 to 2033 indicates significant expansion opportunities. Key drivers include the rising prevalence of age-related skin concerns like wrinkles, age spots, and loss of elasticity, coupled with increased disposable incomes, particularly in developing economies, enabling greater spending on premium skincare products. Furthermore, the market is witnessing a strong shift towards natural and organic ingredients, fueled by growing consumer preference for sustainable and ethically sourced products. Technological advancements in formulation and delivery systems, such as the development of targeted serums and advanced peptide technologies, also contribute significantly to market growth. However, factors like fluctuating raw material prices and the potential for adverse reactions to certain ingredients pose challenges to market expansion. The market segmentation reveals the strong dominance of facial creams and lotions, closely followed by serums and concentrates, highlighting the ongoing demand for comprehensive skincare routines. Online retail channels are experiencing significant growth, reflecting the increasing adoption of e-commerce for purchasing beauty and personal care products.
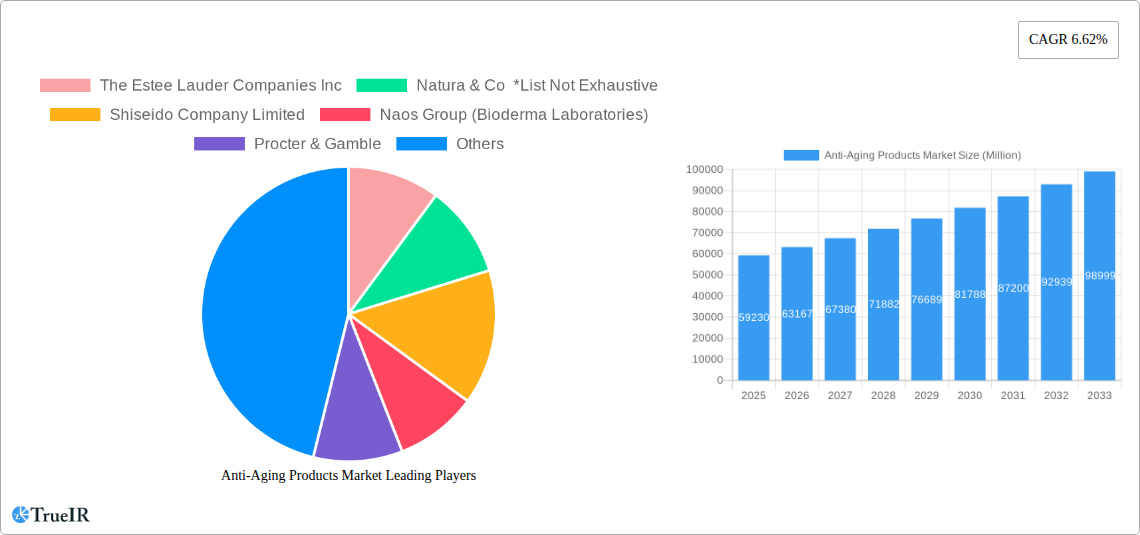
Anti-Aging Products Market Market Size (In Billion)
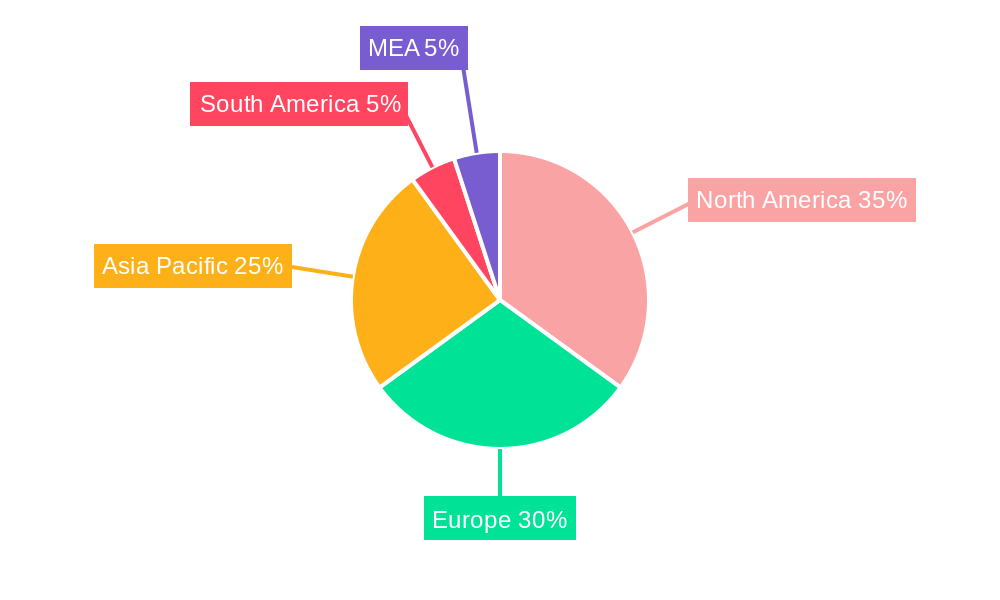
The regional distribution of the market reveals North America and Europe as leading regions, attributable to established consumer bases with higher disposable incomes and a greater awareness of anti-aging solutions. However, Asia Pacific is expected to witness substantial growth in the coming years, driven by rapid economic development and changing consumer lifestyles in major markets like China and India. The competitive landscape is highly fragmented, featuring both established multinational corporations like L'Oreal, Estee Lauder, and Shiseido, and smaller niche players catering to specific consumer needs. The success of companies will depend on their ability to innovate, adapt to evolving consumer preferences, and leverage digital marketing strategies to reach wider audiences. Further growth will be fueled by the continuous introduction of innovative anti-aging ingredients, advanced formulations, and personalized skincare solutions tailored to individual needs and skin types.
Anti-Aging Products Market Company Market Share
Anti-Aging Products Market Report: 2019-2033
This comprehensive report provides a detailed analysis of the global Anti-Aging Products Market, offering invaluable insights for businesses, investors, and researchers. The report covers the period from 2019 to 2033, with a focus on the forecast period 2025-2033 and a base year of 2025. It explores market size, segmentation, competitive landscape, key trends, and future growth potential, utilizing extensive data analysis and industry expertise. The market is projected to reach xx Million by 2033, exhibiting a robust CAGR of xx% during the forecast period.
Anti-Aging Products Market Structure & Competitive Landscape
The Anti-Aging Products market is characterized by a moderately concentrated competitive landscape, with several large multinational companies holding significant market share. Concentration ratios, however, are expected to fluctuate based on M&A activity and the emergence of innovative niche players. The market is highly dynamic, driven by continuous innovation in product formulations, packaging, and marketing strategies. Regulatory scrutiny regarding ingredient safety and claims substantiation significantly influences market players’ strategies. Product substitutes, primarily alternative beauty practices and natural remedies, pose a moderate challenge, albeit one that's being addressed through differentiation strategies. End-user segmentation, driven primarily by demographics (age and income levels) and skincare needs, is a key factor in shaping product development and marketing campaigns. M&A activity in the recent past (xx Million in total deal value during 2019-2024) has involved consolidation among large players and acquisition of smaller companies with innovative technologies.
- Key Players: The Estee Lauder Companies Inc, Natura & Co, Shiseido Company Limited, Naos Group (Bioderma Laboratories), Procter & Gamble, Caudalie, L'Oréal SA, Groupe Clarins, Beiersdorf Limited, Oriflame Cosmetics AG (List not exhaustive)
- Market Concentration: xx% held by top 5 players (2024 estimate)
- Innovation Drivers: Technological advancements in active ingredients, delivery systems, and sustainable packaging.
- Regulatory Impacts: Stringent regulations on ingredient safety and efficacy claims.
- Product Substitutes: Natural remedies, alternative beauty treatments.
- M&A Trends: Consolidation among major players, acquisition of smaller innovative companies.
Anti-Aging Products Market Trends & Opportunities
The global Anti-Aging Products market is experiencing substantial growth, fueled by a rising aging population, increasing disposable incomes, and a growing awareness of skincare’s importance. Technological advancements, such as the incorporation of advanced active ingredients (e.g., peptides, stem cells, and growth factors), and innovative delivery systems (e.g., nanotechnology and liposomes), are driving premiumization and market expansion. Consumer preferences are shifting towards natural, organic, and sustainable products with a focus on efficacy and safety. The market is also witnessing a rise in personalized skincare solutions, leveraging genetic testing and AI-powered recommendations. Competitive dynamics are intense, with companies investing heavily in research and development, brand building, and strategic partnerships to gain a competitive edge.
- Market Size Growth: Projected to reach xx Million by 2033 from xx Million in 2024.
- CAGR: xx% (2025-2033)
- Technological Shifts: Advancements in active ingredients, delivery systems, and personalized skincare solutions.
- Consumer Preferences: Growing demand for natural, organic, and sustainable products.
- Market Penetration Rate: xx% in 2024, expected to rise to xx% by 2033 (estimates vary by segment).
Dominant Markets & Segments in Anti-Aging Products Market
The North American market currently holds a dominant position in the global anti-aging products market, driven by high disposable incomes, advanced skincare awareness, and a strong presence of established players. However, Asia-Pacific is showing significant growth potential due to its rapidly expanding middle class and increasing adoption of western beauty standards.
By Product Type:
- Facial Creams and Lotions: This segment holds the largest market share, driven by its broad appeal and diverse range of formulations.
- Serums and Concentrates: This segment is experiencing rapid growth due to its high efficacy and targeted approach to specific skin concerns.
- Under Eye Creams: A significant segment due to the visible signs of aging around the eyes.
- Others (Facial Oils, Sheet Masks): This segment is growing in popularity, driven by trends towards natural ingredients and convenient application methods.
By Distribution Channel:
- Online Retail Stores: Rapid growth due to convenience and accessibility.
- Specialty Stores: Maintaining a strong presence due to expertise and personalized service.
- Pharmacies/Drug Stores: A significant distribution channel offering accessibility and trust.
- Supermarkets/Hypermarkets: Wide reach, but lower margins and less expertise.
Key Growth Drivers:
- Rising disposable incomes in developing economies, especially Asia-Pacific.
- Growing awareness of skincare and anti-aging solutions.
- Technological advancements resulting in better products and increased efficacy.
- Increased penetration of e-commerce allowing easier access to a wider variety of products.
Anti-Aging Products Market Product Analysis
Product innovations in the anti-aging market are characterized by the incorporation of advanced active ingredients, targeted formulations for specific skin concerns (e.g., wrinkles, pigmentation, and sagging), and enhanced delivery systems for improved absorption and efficacy. Companies are focusing on developing products with clean labels, natural ingredients, and sustainable packaging to meet evolving consumer preferences. Competitive advantages are often derived from unique formulations, patented technologies, strong branding, and effective marketing strategies. The integration of digital tools for personalized skincare recommendations and virtual consultations is also gaining traction.
Key Drivers, Barriers & Challenges in Anti-Aging Products Market
Key Drivers: The aging global population, increasing disposable incomes, heightened awareness of skincare, and technological advancements in active ingredients and delivery systems are driving market growth. Government regulations promoting safe and effective products are also a key driver.
Challenges and Restraints: Stringent regulatory requirements for ingredient approval and efficacy claims pose a significant challenge. Fluctuations in raw material costs and supply chain disruptions can impact product pricing and availability. Intense competition and the need for continuous innovation to stay ahead of the curve are also significant barriers. The rise of counterfeit products also negatively impacts market growth, although it's a challenge that is being tackled with increased security measures.
Growth Drivers in the Anti-Aging Products Market
Technological advancements in active ingredients (e.g., peptides, stem cells) and delivery systems (e.g., nanotechnology) are driving product innovation. The rising disposable incomes in emerging markets are fueling demand for premium anti-aging products. Government regulations promoting safe and effective products are supporting market expansion.
Challenges Impacting Anti-Aging Products Market Growth
Stricter regulatory requirements for ingredient approval and efficacy claims increase development costs and time to market. Supply chain disruptions and fluctuations in raw material prices impact profitability and product availability. Intense competition necessitates constant innovation and substantial marketing investment.
Key Players Shaping the Anti-Aging Products Market
Significant Anti-Aging Products Market Industry Milestones
- March 2024: Dermalogica launched its Circular Hydration Serum, leveraging hyaluronic acid and algae extracts.
- March 2024: L'Oréal Canada launched SkinBetter Science, expanding its medical aesthetic skincare offerings.
- April 2024: Nivea expanded its anti-aging portfolio with the Q10 Dual Action serum, targeting sugar-induced aging.
Future Outlook for Anti-Aging Products Market
The anti-aging products market is poised for continued growth, driven by an aging global population, rising disposable incomes, and ongoing technological advancements. Strategic opportunities exist in personalized skincare, sustainable and ethical sourcing, and the development of innovative active ingredients and delivery systems. The market's future potential is significant, with substantial expansion expected across various segments and geographic regions.
Anti-Aging Products Market Segmentation
-
1. Product Type
- 1.1. Facial Creams and Lotions
- 1.2. Serums and Concentrates
- 1.3. Under Eye Creams
- 1.4. Others (Facial Oils, Sheet Masks)
-
2. Distribution Channel
- 2.1. Supermarkets/Hypermarkets
- 2.2. Specialty Stores
- 2.3. Pharmacies/Drug Stores
- 2.4. Online Retail Stores
- 2.5. Other Distribution Channels
Anti-Aging Products Market Segmentation By Geography
-
1. North America
- 1.1. United States
- 1.2. Canada
- 1.3. Mexico
- 1.4. Rest of North America
-
2. Europe
- 2.1. Spain
- 2.2. United Kingdom
- 2.3. Germany
- 2.4. France
- 2.5. Italy
- 2.6. Russia
- 2.7. Rest of Europe
-
3. Asia Pacific
- 3.1. China
- 3.2. Japan
- 3.3. India
- 3.4. Australia
- 3.5. Rest of Asia Pacific
-
4. South America
- 4.1. Brazil
- 4.2. Colombia
- 4.3. Rest of South America
-
5. Middle East and Africa
- 5.1. South Africa
- 5.2. Saudi Arabia
- 5.3. Rest of Middle East and Africa
Anti-Aging Products Market Regional Market Share
Geographic Coverage of Anti-Aging Products Market
Anti-Aging Products Market REPORT HIGHLIGHTS
| Aspects | Details |
|---|---|
| Study Period | 2020-2034 |
| Base Year | 2025 |
| Estimated Year | 2026 |
| Forecast Period | 2026-2034 |
| Historical Period | 2020-2025 |
| Growth Rate | CAGR of 6.62% from 2020-2034 |
| Segmentation |
|
Table of Contents
- 1. Introduction
- 1.1. Research Scope
- 1.2. Market Segmentation
- 1.3. Research Objective
- 1.4. Definitions and Assumptions
- 2. Executive Summary
- 2.1. Market Snapshot
- 3. Market Dynamics
- 3.1. Market Drivers
- 3.2. Market Restrains
- 3.3. Market Trends
- 3.4. Market Opportunities
- 4. Market Factor Analysis
- 4.1. Porters Five Forces
- 4.1.1. Bargaining Power of Suppliers
- 4.1.2. Bargaining Power of Buyers
- 4.1.3. Threat of New Entrants
- 4.1.4. Threat of Substitutes
- 4.1.5. Competitive Rivalry
- 4.2. PESTEL analysis
- 4.3. BCG Analysis
- 4.3.1. Stars (High Growth, High Market Share)
- 4.3.2. Cash Cows (Low Growth, High Market Share)
- 4.3.3. Question Mark (High Growth, Low Market Share)
- 4.3.4. Dogs (Low Growth, Low Market Share)
- 4.4. Ansoff Matrix Analysis
- 4.5. Supply Chain Analysis
- 4.6. Regulatory Landscape
- 4.7. Current Market Potential and Opportunity Assessment (TAM–SAM–SOM Framework)
- 4.8. TIR Analyst Note
- 4.1. Porters Five Forces
- 5. Market Analysis, Insights and Forecast 2021-2033
- 5.1. Market Analysis, Insights and Forecast - by Product Type
- 5.1.1. Facial Creams and Lotions
- 5.1.2. Serums and Concentrates
- 5.1.3. Under Eye Creams
- 5.1.4. Others (Facial Oils, Sheet Masks)
- 5.2. Market Analysis, Insights and Forecast - by Distribution Channel
- 5.2.1. Supermarkets/Hypermarkets
- 5.2.2. Specialty Stores
- 5.2.3. Pharmacies/Drug Stores
- 5.2.4. Online Retail Stores
- 5.2.5. Other Distribution Channels
- 5.3. Market Analysis, Insights and Forecast - by Region
- 5.3.1. North America
- 5.3.2. Europe
- 5.3.3. Asia Pacific
- 5.3.4. South America
- 5.3.5. Middle East and Africa
- 5.1. Market Analysis, Insights and Forecast - by Product Type
- 6. Global Anti-Aging Products Market Analysis, Insights and Forecast, 2021-2033
- 6.1. Market Analysis, Insights and Forecast - by Product Type
- 6.1.1. Facial Creams and Lotions
- 6.1.2. Serums and Concentrates
- 6.1.3. Under Eye Creams
- 6.1.4. Others (Facial Oils, Sheet Masks)
- 6.2. Market Analysis, Insights and Forecast - by Distribution Channel
- 6.2.1. Supermarkets/Hypermarkets
- 6.2.2. Specialty Stores
- 6.2.3. Pharmacies/Drug Stores
- 6.2.4. Online Retail Stores
- 6.2.5. Other Distribution Channels
- 6.1. Market Analysis, Insights and Forecast - by Product Type
- 7. North America Anti-Aging Products Market Analysis, Insights and Forecast, 2020-2032
- 7.1. Market Analysis, Insights and Forecast - by Product Type
- 7.1.1. Facial Creams and Lotions
- 7.1.2. Serums and Concentrates
- 7.1.3. Under Eye Creams
- 7.1.4. Others (Facial Oils, Sheet Masks)
- 7.2. Market Analysis, Insights and Forecast - by Distribution Channel
- 7.2.1. Supermarkets/Hypermarkets
- 7.2.2. Specialty Stores
- 7.2.3. Pharmacies/Drug Stores
- 7.2.4. Online Retail Stores
- 7.2.5. Other Distribution Channels
- 7.1. Market Analysis, Insights and Forecast - by Product Type
- 8. Europe Anti-Aging Products Market Analysis, Insights and Forecast, 2020-2032
- 8.1. Market Analysis, Insights and Forecast - by Product Type
- 8.1.1. Facial Creams and Lotions
- 8.1.2. Serums and Concentrates
- 8.1.3. Under Eye Creams
- 8.1.4. Others (Facial Oils, Sheet Masks)
- 8.2. Market Analysis, Insights and Forecast - by Distribution Channel
- 8.2.1. Supermarkets/Hypermarkets
- 8.2.2. Specialty Stores
- 8.2.3. Pharmacies/Drug Stores
- 8.2.4. Online Retail Stores
- 8.2.5. Other Distribution Channels
- 8.1. Market Analysis, Insights and Forecast - by Product Type
- 9. Asia Pacific Anti-Aging Products Market Analysis, Insights and Forecast, 2020-2032
- 9.1. Market Analysis, Insights and Forecast - by Product Type
- 9.1.1. Facial Creams and Lotions
- 9.1.2. Serums and Concentrates
- 9.1.3. Under Eye Creams
- 9.1.4. Others (Facial Oils, Sheet Masks)
- 9.2. Market Analysis, Insights and Forecast - by Distribution Channel
- 9.2.1. Supermarkets/Hypermarkets
- 9.2.2. Specialty Stores
- 9.2.3. Pharmacies/Drug Stores
- 9.2.4. Online Retail Stores
- 9.2.5. Other Distribution Channels
- 9.1. Market Analysis, Insights and Forecast - by Product Type
- 10. South America Anti-Aging Products Market Analysis, Insights and Forecast, 2020-2032
- 10.1. Market Analysis, Insights and Forecast - by Product Type
- 10.1.1. Facial Creams and Lotions
- 10.1.2. Serums and Concentrates
- 10.1.3. Under Eye Creams
- 10.1.4. Others (Facial Oils, Sheet Masks)
- 10.2. Market Analysis, Insights and Forecast - by Distribution Channel
- 10.2.1. Supermarkets/Hypermarkets
- 10.2.2. Specialty Stores
- 10.2.3. Pharmacies/Drug Stores
- 10.2.4. Online Retail Stores
- 10.2.5. Other Distribution Channels
- 10.1. Market Analysis, Insights and Forecast - by Product Type
- 11. Middle East and Africa Anti-Aging Products Market Analysis, Insights and Forecast, 2020-2032
- 11.1. Market Analysis, Insights and Forecast - by Product Type
- 11.1.1. Facial Creams and Lotions
- 11.1.2. Serums and Concentrates
- 11.1.3. Under Eye Creams
- 11.1.4. Others (Facial Oils, Sheet Masks)
- 11.2. Market Analysis, Insights and Forecast - by Distribution Channel
- 11.2.1. Supermarkets/Hypermarkets
- 11.2.2. Specialty Stores
- 11.2.3. Pharmacies/Drug Stores
- 11.2.4. Online Retail Stores
- 11.2.5. Other Distribution Channels
- 11.1. Market Analysis, Insights and Forecast - by Product Type
- 12. Competitive Analysis
- 12.1. Company Profiles
- 12.1.1 The Estee Lauder Companies Inc
- 12.1.1.1. Company Overview
- 12.1.1.2. Products
- 12.1.1.3. Company Financials
- 12.1.1.4. SWOT Analysis
- 12.1.2 Natura & Co *List Not Exhaustive
- 12.1.2.1. Company Overview
- 12.1.2.2. Products
- 12.1.2.3. Company Financials
- 12.1.2.4. SWOT Analysis
- 12.1.3 Shiseido Company Limited
- 12.1.3.1. Company Overview
- 12.1.3.2. Products
- 12.1.3.3. Company Financials
- 12.1.3.4. SWOT Analysis
- 12.1.4 Naos Group (Bioderma Laboratories)
- 12.1.4.1. Company Overview
- 12.1.4.2. Products
- 12.1.4.3. Company Financials
- 12.1.4.4. SWOT Analysis
- 12.1.5 Procter & Gamble
- 12.1.5.1. Company Overview
- 12.1.5.2. Products
- 12.1.5.3. Company Financials
- 12.1.5.4. SWOT Analysis
- 12.1.6 Caudalie
- 12.1.6.1. Company Overview
- 12.1.6.2. Products
- 12.1.6.3. Company Financials
- 12.1.6.4. SWOT Analysis
- 12.1.7 LOreal SA
- 12.1.7.1. Company Overview
- 12.1.7.2. Products
- 12.1.7.3. Company Financials
- 12.1.7.4. SWOT Analysis
- 12.1.8 Groupe Clarins
- 12.1.8.1. Company Overview
- 12.1.8.2. Products
- 12.1.8.3. Company Financials
- 12.1.8.4. SWOT Analysis
- 12.1.9 Beiersdorf Limited
- 12.1.9.1. Company Overview
- 12.1.9.2. Products
- 12.1.9.3. Company Financials
- 12.1.9.4. SWOT Analysis
- 12.1.10 Oriflame Cosmetics AG
- 12.1.10.1. Company Overview
- 12.1.10.2. Products
- 12.1.10.3. Company Financials
- 12.1.10.4. SWOT Analysis
- 12.1.1 The Estee Lauder Companies Inc
- 12.2. Market Entropy
- 12.2.1 Company's Key Areas Served
- 12.2.2 Recent Developments
- 12.3. Company Market Share Analysis 2025
- 12.3.1 Top 5 Companies Market Share Analysis
- 12.3.2 Top 3 Companies Market Share Analysis
- 12.4. List of Potential Customers
- 13. Research Methodology
List of Figures
- Figure 1: Global Anti-Aging Products Market Revenue Breakdown (Million, %) by Region 2025 & 2033
- Figure 2: North America Anti-Aging Products Market Revenue (Million), by Product Type 2025 & 2033
- Figure 3: North America Anti-Aging Products Market Revenue Share (%), by Product Type 2025 & 2033
- Figure 4: North America Anti-Aging Products Market Revenue (Million), by Distribution Channel 2025 & 2033
- Figure 5: North America Anti-Aging Products Market Revenue Share (%), by Distribution Channel 2025 & 2033
- Figure 6: North America Anti-Aging Products Market Revenue (Million), by Country 2025 & 2033
- Figure 7: North America Anti-Aging Products Market Revenue Share (%), by Country 2025 & 2033
- Figure 8: Europe Anti-Aging Products Market Revenue (Million), by Product Type 2025 & 2033
- Figure 9: Europe Anti-Aging Products Market Revenue Share (%), by Product Type 2025 & 2033
- Figure 10: Europe Anti-Aging Products Market Revenue (Million), by Distribution Channel 2025 & 2033
- Figure 11: Europe Anti-Aging Products Market Revenue Share (%), by Distribution Channel 2025 & 2033
- Figure 12: Europe Anti-Aging Products Market Revenue (Million), by Country 2025 & 2033
- Figure 13: Europe Anti-Aging Products Market Revenue Share (%), by Country 2025 & 2033
- Figure 14: Asia Pacific Anti-Aging Products Market Revenue (Million), by Product Type 2025 & 2033
- Figure 15: Asia Pacific Anti-Aging Products Market Revenue Share (%), by Product Type 2025 & 2033
- Figure 16: Asia Pacific Anti-Aging Products Market Revenue (Million), by Distribution Channel 2025 & 2033
- Figure 17: Asia Pacific Anti-Aging Products Market Revenue Share (%), by Distribution Channel 2025 & 2033
- Figure 18: Asia Pacific Anti-Aging Products Market Revenue (Million), by Country 2025 & 2033
- Figure 19: Asia Pacific Anti-Aging Products Market Revenue Share (%), by Country 2025 & 2033
- Figure 20: South America Anti-Aging Products Market Revenue (Million), by Product Type 2025 & 2033
- Figure 21: South America Anti-Aging Products Market Revenue Share (%), by Product Type 2025 & 2033
- Figure 22: South America Anti-Aging Products Market Revenue (Million), by Distribution Channel 2025 & 2033
- Figure 23: South America Anti-Aging Products Market Revenue Share (%), by Distribution Channel 2025 & 2033
- Figure 24: South America Anti-Aging Products Market Revenue (Million), by Country 2025 & 2033
- Figure 25: South America Anti-Aging Products Market Revenue Share (%), by Country 2025 & 2033
- Figure 26: Middle East and Africa Anti-Aging Products Market Revenue (Million), by Product Type 2025 & 2033
- Figure 27: Middle East and Africa Anti-Aging Products Market Revenue Share (%), by Product Type 2025 & 2033
- Figure 28: Middle East and Africa Anti-Aging Products Market Revenue (Million), by Distribution Channel 2025 & 2033
- Figure 29: Middle East and Africa Anti-Aging Products Market Revenue Share (%), by Distribution Channel 2025 & 2033
- Figure 30: Middle East and Africa Anti-Aging Products Market Revenue (Million), by Country 2025 & 2033
- Figure 31: Middle East and Africa Anti-Aging Products Market Revenue Share (%), by Country 2025 & 2033
List of Tables
- Table 1: Global Anti-Aging Products Market Revenue Million Forecast, by Product Type 2020 & 2033
- Table 2: Global Anti-Aging Products Market Revenue Million Forecast, by Distribution Channel 2020 & 2033
- Table 3: Global Anti-Aging Products Market Revenue Million Forecast, by Region 2020 & 2033
- Table 4: Global Anti-Aging Products Market Revenue Million Forecast, by Product Type 2020 & 2033
- Table 5: Global Anti-Aging Products Market Revenue Million Forecast, by Distribution Channel 2020 & 2033
- Table 6: Global Anti-Aging Products Market Revenue Million Forecast, by Country 2020 & 2033
- Table 7: United States Anti-Aging Products Market Revenue (Million) Forecast, by Application 2020 & 2033
- Table 8: Canada Anti-Aging Products Market Revenue (Million) Forecast, by Application 2020 & 2033
- Table 9: Mexico Anti-Aging Products Market Revenue (Million) Forecast, by Application 2020 & 2033
- Table 10: Rest of North America Anti-Aging Products Market Revenue (Million) Forecast, by Application 2020 & 2033
- Table 11: Global Anti-Aging Products Market Revenue Million Forecast, by Product Type 2020 & 2033
- Table 12: Global Anti-Aging Products Market Revenue Million Forecast, by Distribution Channel 2020 & 2033
- Table 13: Global Anti-Aging Products Market Revenue Million Forecast, by Country 2020 & 2033
- Table 14: Spain Anti-Aging Products Market Revenue (Million) Forecast, by Application 2020 & 2033
- Table 15: United Kingdom Anti-Aging Products Market Revenue (Million) Forecast, by Application 2020 & 2033
- Table 16: Germany Anti-Aging Products Market Revenue (Million) Forecast, by Application 2020 & 2033
- Table 17: France Anti-Aging Products Market Revenue (Million) Forecast, by Application 2020 & 2033
- Table 18: Italy Anti-Aging Products Market Revenue (Million) Forecast, by Application 2020 & 2033
- Table 19: Russia Anti-Aging Products Market Revenue (Million) Forecast, by Application 2020 & 2033
- Table 20: Rest of Europe Anti-Aging Products Market Revenue (Million) Forecast, by Application 2020 & 2033
- Table 21: Global Anti-Aging Products Market Revenue Million Forecast, by Product Type 2020 & 2033
- Table 22: Global Anti-Aging Products Market Revenue Million Forecast, by Distribution Channel 2020 & 2033
- Table 23: Global Anti-Aging Products Market Revenue Million Forecast, by Country 2020 & 2033
- Table 24: China Anti-Aging Products Market Revenue (Million) Forecast, by Application 2020 & 2033
- Table 25: Japan Anti-Aging Products Market Revenue (Million) Forecast, by Application 2020 & 2033
- Table 26: India Anti-Aging Products Market Revenue (Million) Forecast, by Application 2020 & 2033
- Table 27: Australia Anti-Aging Products Market Revenue (Million) Forecast, by Application 2020 & 2033
- Table 28: Rest of Asia Pacific Anti-Aging Products Market Revenue (Million) Forecast, by Application 2020 & 2033
- Table 29: Global Anti-Aging Products Market Revenue Million Forecast, by Product Type 2020 & 2033
- Table 30: Global Anti-Aging Products Market Revenue Million Forecast, by Distribution Channel 2020 & 2033
- Table 31: Global Anti-Aging Products Market Revenue Million Forecast, by Country 2020 & 2033
- Table 32: Brazil Anti-Aging Products Market Revenue (Million) Forecast, by Application 2020 & 2033
- Table 33: Colombia Anti-Aging Products Market Revenue (Million) Forecast, by Application 2020 & 2033
- Table 34: Rest of South America Anti-Aging Products Market Revenue (Million) Forecast, by Application 2020 & 2033
- Table 35: Global Anti-Aging Products Market Revenue Million Forecast, by Product Type 2020 & 2033
- Table 36: Global Anti-Aging Products Market Revenue Million Forecast, by Distribution Channel 2020 & 2033
- Table 37: Global Anti-Aging Products Market Revenue Million Forecast, by Country 2020 & 2033
- Table 38: South Africa Anti-Aging Products Market Revenue (Million) Forecast, by Application 2020 & 2033
- Table 39: Saudi Arabia Anti-Aging Products Market Revenue (Million) Forecast, by Application 2020 & 2033
- Table 40: Rest of Middle East and Africa Anti-Aging Products Market Revenue (Million) Forecast, by Application 2020 & 2033
Frequently Asked Questions
1. What is the projected Compound Annual Growth Rate (CAGR) of the Anti-Aging Products Market?
The projected CAGR is approximately 6.62%.
2. Which companies are prominent players in the Anti-Aging Products Market?
Key companies in the market include The Estee Lauder Companies Inc, Natura & Co *List Not Exhaustive, Shiseido Company Limited, Naos Group (Bioderma Laboratories), Procter & Gamble, Caudalie, LOreal SA, Groupe Clarins, Beiersdorf Limited, Oriflame Cosmetics AG.
3. What are the main segments of the Anti-Aging Products Market?
The market segments include Product Type, Distribution Channel.
4. Can you provide details about the market size?
The market size is estimated to be USD 59.23 Million as of 2022.
5. What are some drivers contributing to market growth?
Aggressive Marketing and Advertising By Brands; Desire Among Consumers For Youthful Skin.
6. What are the notable trends driving market growth?
Aggressive Marketing and Advertising By Brands.
7. Are there any restraints impacting market growth?
Availability of Counterfeit Products.
8. Can you provide examples of recent developments in the market?
April 2024: Nivea expanded its anti-aging product portfolio by launching the Q10 Dual Action serum. The company claims that the serum targets sugar-induced skin aging and wrinkle formation. The formula was designed to prevent protein glycation in the dermis skin layer, protecting collagen and elastin from damage.
9. What pricing options are available for accessing the report?
Pricing options include single-user, multi-user, and enterprise licenses priced at USD 4750, USD 5250, and USD 8750 respectively.
10. Is the market size provided in terms of value or volume?
The market size is provided in terms of value, measured in Million.
11. Are there any specific market keywords associated with the report?
Yes, the market keyword associated with the report is "Anti-Aging Products Market," which aids in identifying and referencing the specific market segment covered.
12. How do I determine which pricing option suits my needs best?
The pricing options vary based on user requirements and access needs. Individual users may opt for single-user licenses, while businesses requiring broader access may choose multi-user or enterprise licenses for cost-effective access to the report.
13. Are there any additional resources or data provided in the Anti-Aging Products Market report?
While the report offers comprehensive insights, it's advisable to review the specific contents or supplementary materials provided to ascertain if additional resources or data are available.
14. How can I stay updated on further developments or reports in the Anti-Aging Products Market?
To stay informed about further developments, trends, and reports in the Anti-Aging Products Market, consider subscribing to industry newsletters, following relevant companies and organizations, or regularly checking reputable industry news sources and publications.
Methodology
Step 1 - Identification of Relevant Samples Size from Population Database


Step 2 - Approaches for Defining Global Market Size (Value, Volume* & Price*)

Note*: In applicable scenarios
Step 3 - Data Sources
Primary Research
- Web Analytics
- Survey Reports
- Research Institute
- Latest Research Reports
- Opinion Leaders
Secondary Research
- Annual Reports
- White Paper
- Latest Press Release
- Industry Association
- Paid Database
- Investor Presentations

Step 4 - Data Triangulation
Involves using different sources of information in order to increase the validity of a study
These sources are likely to be stakeholders in a program - participants, other researchers, program staff, other community members, and so on.
Then we put all data in single framework & apply various statistical tools to find out the dynamic on the market.
During the analysis stage, feedback from the stakeholder groups would be compared to determine areas of agreement as well as areas of divergence