

Key Insights
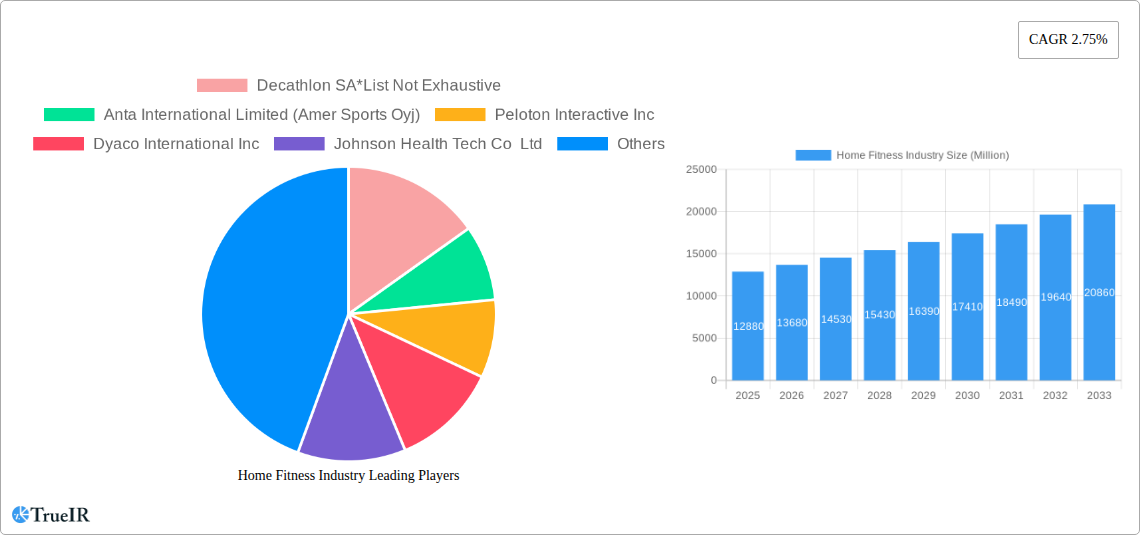
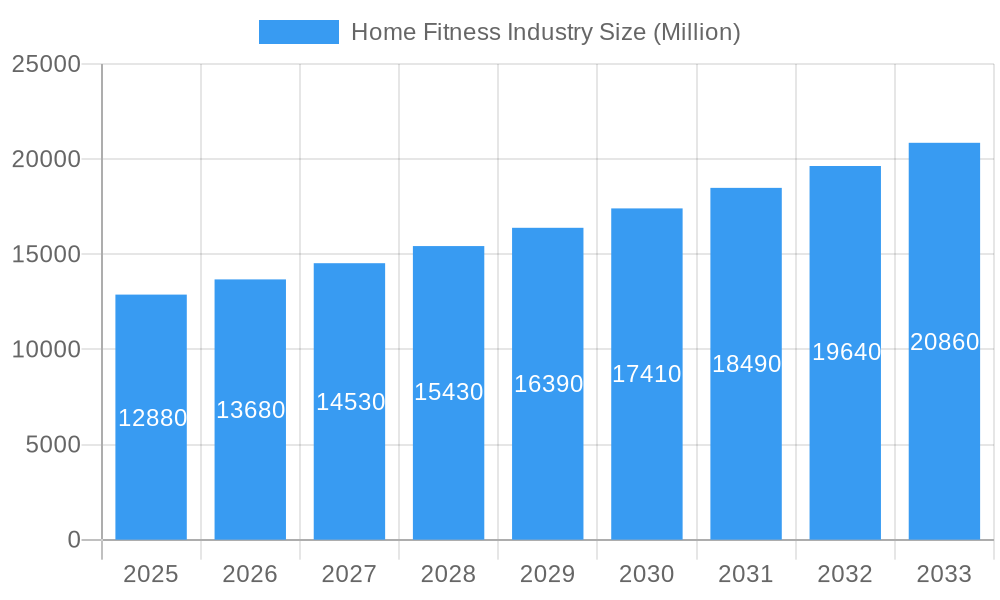
The global Home Fitness Industry is poised for robust expansion, projected to reach USD 12.88 billion in 2025 and maintain a healthy Compound Annual Growth Rate (CAGR) of 6.32% through 2033. This impressive growth is fueled by a confluence of factors, most notably the increasing consumer awareness regarding health and wellness, coupled with a growing preference for the convenience and privacy of home workouts. The lingering impact of global health events has cemented the role of home fitness as a sustainable lifestyle choice, driving demand for a diverse range of equipment. Technological advancements, including the integration of smart features, interactive training programs, and personalized fitness tracking, are further stimulating market penetration, appealing to a wider demographic seeking engaging and effective fitness solutions.
Home Fitness Industry Market Size (In Billion)
The market’s expansion is further propelled by evolving consumer lifestyles, characterized by busier schedules and a greater emphasis on preventative healthcare. This shift is leading to sustained investment in home fitness infrastructure. Key product segments such as treadmills, elliptical machines, and stationary cycles are experiencing consistent demand, while the burgeoning strength training equipment sector is witnessing rapid innovation and adoption. Distribution channels are also diversifying, with online retail stores emerging as a dominant force, offering unparalleled accessibility and a broad product selection. Direct selling models are also gaining traction, providing personalized customer experiences. Geographically, North America and Europe continue to be significant markets, while the Asia Pacific region presents substantial growth opportunities driven by rising disposable incomes and a burgeoning health-conscious population.
Home Fitness Industry Company Market Share
Home Fitness Industry Market Report: In-Depth Analysis and Future Projections (2019-2033)
This comprehensive report delivers an in-depth analysis of the global Home Fitness Industry, a sector experiencing unprecedented growth driven by technological innovation, evolving consumer lifestyles, and an increasing focus on personal well-being. Spanning the historical period of 2019-2024 and projecting forward to 2033 with a base and estimated year of 2025, this report provides invaluable insights for stakeholders seeking to navigate this dynamic market. The global home fitness market size is projected to reach billions by 2033, fueled by factors such as the rise of connected fitness equipment, smart gym technology, and the demand for personalized workout solutions.
Home Fitness Industry Market Structure & Competitive Landscape
The home fitness industry is characterized by a moderately concentrated market structure, with a blend of large multinational corporations and niche players vying for market share. Innovation serves as a primary driver, with companies continuously investing in research and development to introduce advanced smart treadmills, interactive ellipticals, and connected rowing machines. Regulatory impacts are generally minimal, with a focus on product safety and data privacy. Product substitutes are abundant, ranging from traditional fitness equipment to digital workout apps and wearable fitness trackers, intensifying the competitive landscape. End-user segmentation is driven by demographics, income levels, and fitness goals. Mergers and acquisitions (M&A) are a significant trend, as larger players acquire innovative startups to expand their product portfolios and market reach. For instance, the home gym equipment market has seen several strategic acquisitions in recent years, aiming to consolidate market leadership. The connected fitness market is particularly attractive for M&A, given its high growth potential. Online fitness equipment sales are becoming increasingly dominant.
Home Fitness Industry Market Trends & Opportunities
The global home fitness industry is poised for substantial growth, with an estimated market size projected to reach trillions by 2033. This expansion is primarily driven by the increasing adoption of connected fitness solutions and the proliferation of smart home gym equipment. The CAGR for the home fitness market is expected to be robust throughout the forecast period, reflecting sustained consumer interest in at-home exercise. Technological shifts are paramount, with advancements in AI-powered coaching, virtual reality (VR) fitness experiences, and personalized workout algorithms becoming increasingly sophisticated. Consumer preferences are leaning towards convenience, personalization, and integrated digital platforms. The demand for interactive fitness equipment that offers engaging and motivating workout sessions is at an all-time high. Competitive dynamics are intensifying, with companies differentiating themselves through exclusive content, community building, and innovative hardware design. The wearable fitness technology market is closely intertwined with the home fitness sector, providing data integration and enhanced user experiences. The opportunity lies in leveraging digital fitness platforms to deliver holistic wellness solutions beyond just equipment. The online retail of fitness equipment is a key channel for reaching a wider audience, and companies are investing in e-commerce capabilities. The strength training equipment market also continues to see innovation. Home treadmill sales remain a significant contributor to the overall market. The stationary bike market is also evolving with new technologies. The rowing machine market is gaining traction due to its full-body workout benefits.
Dominant Markets & Segments in Home Fitness Industry
The North America home fitness market currently holds a dominant position, driven by high disposable incomes, widespread awareness of health and fitness, and a strong adoption rate of advanced technologies. Within this region, the United States home fitness market leads, characterized by significant investment in research and development and a large consumer base actively seeking home gym solutions.
Key growth drivers in the dominant market segments include:
Product Type Dominance:
- Treadmills: Consistently high demand due to their versatility and widespread recognition as a fundamental piece of cardio equipment. The best home treadmills are sought after by consumers of all fitness levels.
- Stationary Cycles: Popular for their low-impact nature and effective cardiovascular benefits, with advancements in smart stationary bikes enhancing user engagement.
- Strength Training Equipment: A growing segment, fueled by the desire for muscle building and functional fitness, with innovative home weight machines and adjustable dumbbells gaining traction.
- Elliptical Machines: Valued for their full-body, low-impact cardio workouts, with connected elliptical trainers offering immersive experiences.
- Rowing Machines: Experiencing a surge in popularity due to their comprehensive, full-body workout capabilities, with smart rowing machines providing interactive training programs.
Distribution Channel Dominance:
- Online Retail Stores: Represent the fastest-growing distribution channel, offering convenience, wider selection, and competitive pricing for fitness equipment online. E-commerce platforms have revolutionized how consumers purchase home exercise equipment.
- Offline Retail Stores: Continue to play a crucial role, allowing consumers to physically inspect and try equipment, particularly for high-value items like commercial-grade home gym equipment.
Home Fitness Industry Product Analysis
The home fitness industry is marked by rapid product innovation, focusing on enhancing user experience and effectiveness. Key advancements include the integration of AI for personalized coaching, high-definition screens for immersive virtual workouts, and sophisticated sensor technology for real-time performance tracking. Products like smart treadmills with adaptive incline, connected stationary bikes with virtual coaching, and strength training equipment offering guided programs provide significant competitive advantages by catering to diverse fitness needs and goals. The application of these technologies extends to improving user engagement and adherence to fitness routines.
Key Drivers, Barriers & Challenges in Home Fitness Industry
The home fitness industry growth is propelled by several key drivers. Technological advancements in smart fitness equipment, including AI-powered personalization and immersive VR experiences, are transforming workouts. The increasing global focus on health and wellness, coupled with the convenience of at-home exercise, significantly boosts demand. Economic factors, such as rising disposable incomes and a desire for cost-effective fitness solutions compared to traditional gym memberships, also play a crucial role. Furthermore, government initiatives promoting healthy lifestyles indirectly support market expansion.
However, the industry faces considerable challenges and restraints. Supply chain disruptions, particularly for electronic components, can impact production and lead times, affecting the availability of connected home gyms. Intense competition from both established brands and new entrants can lead to price wars and squeezed profit margins. Regulatory hurdles related to data privacy and product safety, while necessary, can add complexity to product development and market entry. High initial investment costs for premium smart fitness equipment can be a barrier for some consumers.
Growth Drivers in the Home Fitness Industry Market
The home fitness equipment market is experiencing robust growth fueled by several pivotal factors. Technological innovation is paramount, with the integration of AI, virtual reality, and advanced connectivity transforming the user experience and delivering personalized, engaging workouts. The increasing global emphasis on health and wellness, amplified by lifestyle changes and a desire for convenience, makes at-home fitness solutions highly attractive. Economic growth and rising disposable incomes in key regions enable more consumers to invest in quality home exercise machines. Furthermore, supportive government policies promoting healthy living and digital adoption contribute to market expansion, creating a fertile ground for connected fitness devices.
Challenges Impacting Home Fitness Industry Growth
The global home fitness market faces several significant barriers and restraints that can impede its growth trajectory. Supply chain volatility, particularly concerning electronic components and manufacturing, can lead to production delays and increased costs, impacting the availability of sought-after smart treadmills and interactive ellipticals. Intense competitive pressures from a growing number of players, including both established brands and emerging startups, can result in price erosion and necessitate significant marketing investments. While generally favorable, evolving regulatory landscapes related to data privacy and consumer protection can introduce complexities and compliance costs for companies operating in the connected fitness space. The high upfront cost of premium smart gym equipment can also act as a barrier for some segments of the consumer market.
Key Players Shaping the Home Fitness Industry Market
- Decathlon SA
- Anta International Limited (Amer Sports Oyj)
- Peloton Interactive Inc
- Dyaco International Inc
- Johnson Health Tech Co Ltd
- Nautilus Inc
- Technogym SpA
- TRUE Fitness
- Icon Health & Fitness Inc
- Origin Fitness Ltd (Anytime Leisure Limited)
Significant Home Fitness Industry Industry Milestones
- August 2021: Johnson Health Tech Co. Ltd acquired Matrix Fitness South Africa, a distributor for JHT prior to the acquisition, becoming the first fitness equipment company to have a wholly-owned subsidiary in Africa. The major strategy behind this move was to expand the business in the African region, which will result in positive revenue growth in the long term.
- June 2021: ICON Health & Fitness announced that it changed its corporate name to iFIT Health & Fitness Inc. (iFIT). According to the firm, the change reflects iFIT's commitment to delivering personalized, connected health and fitness experiences to its growing community. Currently, iFIT has more than five million members in 120 countries.
- January 2021: Nautilus Inc. expanded connected home fitness products featuring the enhanced JRNY Digital Fitness Platform by introducing the next generation of the popular BowflexMax Trainer, which expanded the Bowflextreadmill line, helping members achieve their fitness goals by offering curated workouts and entertainment options that stream while being coached.
Future Outlook for Home Fitness Industry Market
The future outlook for the home fitness industry is exceptionally promising, driven by a confluence of compelling growth catalysts. The continued evolution of connected fitness technology, including AI-driven personalized training and immersive virtual reality experiences, will further enhance user engagement and retention. The persistent global emphasis on health and well-being, coupled with the inherent convenience of at-home workouts, ensures sustained consumer demand. Strategic opportunities lie in expanding into emerging markets, developing more affordable entry-level smart fitness equipment, and fostering vibrant online fitness communities. The market potential for innovative solutions that cater to diverse fitness needs and preferences remains substantial, promising continued expansion and profitability for key stakeholders.
Home Fitness Industry Segmentation
-
1. Product Type
- 1.1. Treadmills
- 1.2. Elliptical Machines
- 1.3. Stationary Cycles
- 1.4. Rowing Machines
- 1.5. Strength Training Equipment
- 1.6. Other Product Types
-
2. Distribution Channel
- 2.1. Offline Retail Stores
- 2.2. Online Retail Stores
- 2.3. Direct Selling
Home Fitness Industry Segmentation By Geography
-
1. North America
- 1.1. United States
- 1.2. Canada
- 1.3. Mexico
- 1.4. Rest of North America
-
2. Europe
- 2.1. United Kingdom
- 2.2. Germany
- 2.3. Spain
- 2.4. France
- 2.5. Italy
- 2.6. Russia
- 2.7. Rest of Europe
-
3. Asia Pacific
- 3.1. China
- 3.2. Japan
- 3.3. India
- 3.4. Australia
- 3.5. Rest of Asia Pacific
-
4. South America
- 4.1. Brazil
- 4.2. Argentina
- 4.3. Rest of South America
-
5. Middle East and Africa
- 5.1. South Africa
- 5.2. United Arab Emirates
- 5.3. Rest of Middle East and Africa
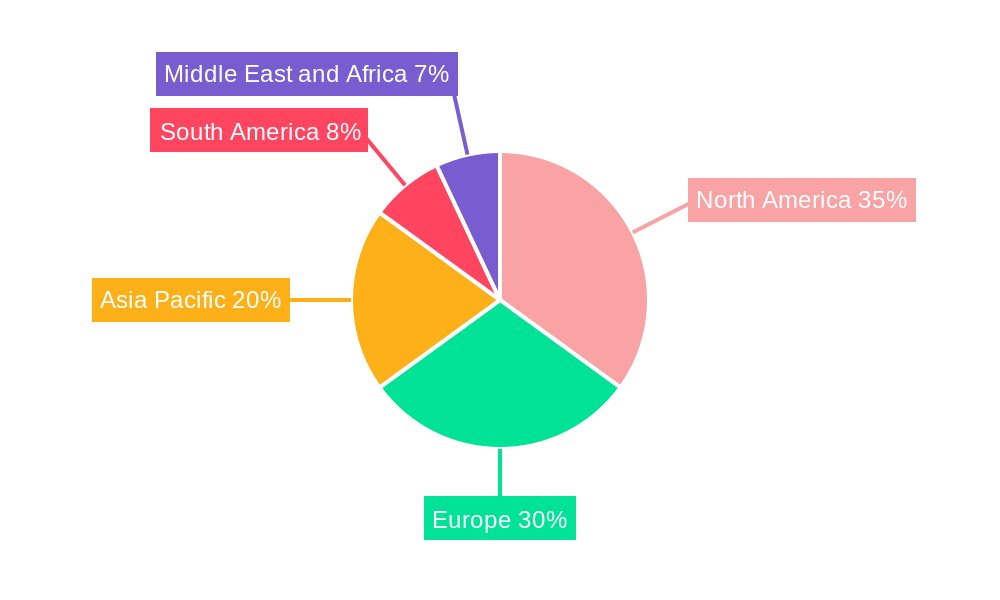
Home Fitness Industry Regional Market Share
Geographic Coverage of Home Fitness Industry
Home Fitness Industry REPORT HIGHLIGHTS
| Aspects | Details |
|---|---|
| Study Period | 2020-2034 |
| Base Year | 2025 |
| Estimated Year | 2026 |
| Forecast Period | 2026-2034 |
| Historical Period | 2020-2025 |
| Growth Rate | CAGR of 6.81% from 2020-2034 |
| Segmentation |
|
Table of Contents
- 1. Introduction
- 1.1. Research Scope
- 1.2. Market Segmentation
- 1.3. Research Objective
- 1.4. Definitions and Assumptions
- 2. Executive Summary
- 2.1. Market Snapshot
- 3. Market Dynamics
- 3.1. Market Drivers
- 3.2. Market Restrains
- 3.3. Market Trends
- 3.4. Market Opportunities
- 4. Market Factor Analysis
- 4.1. Porters Five Forces
- 4.1.1. Bargaining Power of Suppliers
- 4.1.2. Bargaining Power of Buyers
- 4.1.3. Threat of New Entrants
- 4.1.4. Threat of Substitutes
- 4.1.5. Competitive Rivalry
- 4.2. PESTEL analysis
- 4.3. BCG Analysis
- 4.3.1. Stars (High Growth, High Market Share)
- 4.3.2. Cash Cows (Low Growth, High Market Share)
- 4.3.3. Question Mark (High Growth, Low Market Share)
- 4.3.4. Dogs (Low Growth, Low Market Share)
- 4.4. Ansoff Matrix Analysis
- 4.5. Supply Chain Analysis
- 4.6. Regulatory Landscape
- 4.7. Current Market Potential and Opportunity Assessment (TAM–SAM–SOM Framework)
- 4.8. TIR Analyst Note
- 4.1. Porters Five Forces
- 5. Market Analysis, Insights and Forecast 2021-2033
- 5.1. Market Analysis, Insights and Forecast - by Product Type
- 5.1.1. Treadmills
- 5.1.2. Elliptical Machines
- 5.1.3. Stationary Cycles
- 5.1.4. Rowing Machines
- 5.1.5. Strength Training Equipment
- 5.1.6. Other Product Types
- 5.2. Market Analysis, Insights and Forecast - by Distribution Channel
- 5.2.1. Offline Retail Stores
- 5.2.2. Online Retail Stores
- 5.2.3. Direct Selling
- 5.3. Market Analysis, Insights and Forecast - by Region
- 5.3.1. North America
- 5.3.2. Europe
- 5.3.3. Asia Pacific
- 5.3.4. South America
- 5.3.5. Middle East and Africa
- 5.1. Market Analysis, Insights and Forecast - by Product Type
- 6. Global Home Fitness Industry Analysis, Insights and Forecast, 2021-2033
- 6.1. Market Analysis, Insights and Forecast - by Product Type
- 6.1.1. Treadmills
- 6.1.2. Elliptical Machines
- 6.1.3. Stationary Cycles
- 6.1.4. Rowing Machines
- 6.1.5. Strength Training Equipment
- 6.1.6. Other Product Types
- 6.2. Market Analysis, Insights and Forecast - by Distribution Channel
- 6.2.1. Offline Retail Stores
- 6.2.2. Online Retail Stores
- 6.2.3. Direct Selling
- 6.1. Market Analysis, Insights and Forecast - by Product Type
- 7. North America Home Fitness Industry Analysis, Insights and Forecast, 2020-2032
- 7.1. Market Analysis, Insights and Forecast - by Product Type
- 7.1.1. Treadmills
- 7.1.2. Elliptical Machines
- 7.1.3. Stationary Cycles
- 7.1.4. Rowing Machines
- 7.1.5. Strength Training Equipment
- 7.1.6. Other Product Types
- 7.2. Market Analysis, Insights and Forecast - by Distribution Channel
- 7.2.1. Offline Retail Stores
- 7.2.2. Online Retail Stores
- 7.2.3. Direct Selling
- 7.1. Market Analysis, Insights and Forecast - by Product Type
- 8. Europe Home Fitness Industry Analysis, Insights and Forecast, 2020-2032
- 8.1. Market Analysis, Insights and Forecast - by Product Type
- 8.1.1. Treadmills
- 8.1.2. Elliptical Machines
- 8.1.3. Stationary Cycles
- 8.1.4. Rowing Machines
- 8.1.5. Strength Training Equipment
- 8.1.6. Other Product Types
- 8.2. Market Analysis, Insights and Forecast - by Distribution Channel
- 8.2.1. Offline Retail Stores
- 8.2.2. Online Retail Stores
- 8.2.3. Direct Selling
- 8.1. Market Analysis, Insights and Forecast - by Product Type
- 9. Asia Pacific Home Fitness Industry Analysis, Insights and Forecast, 2020-2032
- 9.1. Market Analysis, Insights and Forecast - by Product Type
- 9.1.1. Treadmills
- 9.1.2. Elliptical Machines
- 9.1.3. Stationary Cycles
- 9.1.4. Rowing Machines
- 9.1.5. Strength Training Equipment
- 9.1.6. Other Product Types
- 9.2. Market Analysis, Insights and Forecast - by Distribution Channel
- 9.2.1. Offline Retail Stores
- 9.2.2. Online Retail Stores
- 9.2.3. Direct Selling
- 9.1. Market Analysis, Insights and Forecast - by Product Type
- 10. South America Home Fitness Industry Analysis, Insights and Forecast, 2020-2032
- 10.1. Market Analysis, Insights and Forecast - by Product Type
- 10.1.1. Treadmills
- 10.1.2. Elliptical Machines
- 10.1.3. Stationary Cycles
- 10.1.4. Rowing Machines
- 10.1.5. Strength Training Equipment
- 10.1.6. Other Product Types
- 10.2. Market Analysis, Insights and Forecast - by Distribution Channel
- 10.2.1. Offline Retail Stores
- 10.2.2. Online Retail Stores
- 10.2.3. Direct Selling
- 10.1. Market Analysis, Insights and Forecast - by Product Type
- 11. Middle East and Africa Home Fitness Industry Analysis, Insights and Forecast, 2020-2032
- 11.1. Market Analysis, Insights and Forecast - by Product Type
- 11.1.1. Treadmills
- 11.1.2. Elliptical Machines
- 11.1.3. Stationary Cycles
- 11.1.4. Rowing Machines
- 11.1.5. Strength Training Equipment
- 11.1.6. Other Product Types
- 11.2. Market Analysis, Insights and Forecast - by Distribution Channel
- 11.2.1. Offline Retail Stores
- 11.2.2. Online Retail Stores
- 11.2.3. Direct Selling
- 11.1. Market Analysis, Insights and Forecast - by Product Type
- 12. Competitive Analysis
- 12.1. Company Profiles
- 12.1.1 Decathlon SA*List Not Exhaustive
- 12.1.1.1. Company Overview
- 12.1.1.2. Products
- 12.1.1.3. Company Financials
- 12.1.1.4. SWOT Analysis
- 12.1.2 Anta International Limited (Amer Sports Oyj)
- 12.1.2.1. Company Overview
- 12.1.2.2. Products
- 12.1.2.3. Company Financials
- 12.1.2.4. SWOT Analysis
- 12.1.3 Peloton Interactive Inc
- 12.1.3.1. Company Overview
- 12.1.3.2. Products
- 12.1.3.3. Company Financials
- 12.1.3.4. SWOT Analysis
- 12.1.4 Dyaco International Inc
- 12.1.4.1. Company Overview
- 12.1.4.2. Products
- 12.1.4.3. Company Financials
- 12.1.4.4. SWOT Analysis
- 12.1.5 Johnson Health Tech Co Ltd
- 12.1.5.1. Company Overview
- 12.1.5.2. Products
- 12.1.5.3. Company Financials
- 12.1.5.4. SWOT Analysis
- 12.1.6 Nautilus Inc
- 12.1.6.1. Company Overview
- 12.1.6.2. Products
- 12.1.6.3. Company Financials
- 12.1.6.4. SWOT Analysis
- 12.1.7 Technogym SpA
- 12.1.7.1. Company Overview
- 12.1.7.2. Products
- 12.1.7.3. Company Financials
- 12.1.7.4. SWOT Analysis
- 12.1.8 TRUE Fitness
- 12.1.8.1. Company Overview
- 12.1.8.2. Products
- 12.1.8.3. Company Financials
- 12.1.8.4. SWOT Analysis
- 12.1.9 Icon Health & Fitness Inc
- 12.1.9.1. Company Overview
- 12.1.9.2. Products
- 12.1.9.3. Company Financials
- 12.1.9.4. SWOT Analysis
- 12.1.10 Origin Fitness Ltd (Anytime Leisure Limited)
- 12.1.10.1. Company Overview
- 12.1.10.2. Products
- 12.1.10.3. Company Financials
- 12.1.10.4. SWOT Analysis
- 12.1.1 Decathlon SA*List Not Exhaustive
- 12.2. Market Entropy
- 12.2.1 Company's Key Areas Served
- 12.2.2 Recent Developments
- 12.3. Company Market Share Analysis 2025
- 12.3.1 Top 5 Companies Market Share Analysis
- 12.3.2 Top 3 Companies Market Share Analysis
- 12.4. List of Potential Customers
- 13. Research Methodology
List of Figures
- Figure 1: Global Home Fitness Industry Revenue Breakdown (billion, %) by Region 2025 & 2033
- Figure 2: North America Home Fitness Industry Revenue (billion), by Product Type 2025 & 2033
- Figure 3: North America Home Fitness Industry Revenue Share (%), by Product Type 2025 & 2033
- Figure 4: North America Home Fitness Industry Revenue (billion), by Distribution Channel 2025 & 2033
- Figure 5: North America Home Fitness Industry Revenue Share (%), by Distribution Channel 2025 & 2033
- Figure 6: North America Home Fitness Industry Revenue (billion), by Country 2025 & 2033
- Figure 7: North America Home Fitness Industry Revenue Share (%), by Country 2025 & 2033
- Figure 8: Europe Home Fitness Industry Revenue (billion), by Product Type 2025 & 2033
- Figure 9: Europe Home Fitness Industry Revenue Share (%), by Product Type 2025 & 2033
- Figure 10: Europe Home Fitness Industry Revenue (billion), by Distribution Channel 2025 & 2033
- Figure 11: Europe Home Fitness Industry Revenue Share (%), by Distribution Channel 2025 & 2033
- Figure 12: Europe Home Fitness Industry Revenue (billion), by Country 2025 & 2033
- Figure 13: Europe Home Fitness Industry Revenue Share (%), by Country 2025 & 2033
- Figure 14: Asia Pacific Home Fitness Industry Revenue (billion), by Product Type 2025 & 2033
- Figure 15: Asia Pacific Home Fitness Industry Revenue Share (%), by Product Type 2025 & 2033
- Figure 16: Asia Pacific Home Fitness Industry Revenue (billion), by Distribution Channel 2025 & 2033
- Figure 17: Asia Pacific Home Fitness Industry Revenue Share (%), by Distribution Channel 2025 & 2033
- Figure 18: Asia Pacific Home Fitness Industry Revenue (billion), by Country 2025 & 2033
- Figure 19: Asia Pacific Home Fitness Industry Revenue Share (%), by Country 2025 & 2033
- Figure 20: South America Home Fitness Industry Revenue (billion), by Product Type 2025 & 2033
- Figure 21: South America Home Fitness Industry Revenue Share (%), by Product Type 2025 & 2033
- Figure 22: South America Home Fitness Industry Revenue (billion), by Distribution Channel 2025 & 2033
- Figure 23: South America Home Fitness Industry Revenue Share (%), by Distribution Channel 2025 & 2033
- Figure 24: South America Home Fitness Industry Revenue (billion), by Country 2025 & 2033
- Figure 25: South America Home Fitness Industry Revenue Share (%), by Country 2025 & 2033
- Figure 26: Middle East and Africa Home Fitness Industry Revenue (billion), by Product Type 2025 & 2033
- Figure 27: Middle East and Africa Home Fitness Industry Revenue Share (%), by Product Type 2025 & 2033
- Figure 28: Middle East and Africa Home Fitness Industry Revenue (billion), by Distribution Channel 2025 & 2033
- Figure 29: Middle East and Africa Home Fitness Industry Revenue Share (%), by Distribution Channel 2025 & 2033
- Figure 30: Middle East and Africa Home Fitness Industry Revenue (billion), by Country 2025 & 2033
- Figure 31: Middle East and Africa Home Fitness Industry Revenue Share (%), by Country 2025 & 2033
List of Tables
- Table 1: Global Home Fitness Industry Revenue billion Forecast, by Product Type 2020 & 2033
- Table 2: Global Home Fitness Industry Revenue billion Forecast, by Distribution Channel 2020 & 2033
- Table 3: Global Home Fitness Industry Revenue billion Forecast, by Region 2020 & 2033
- Table 4: Global Home Fitness Industry Revenue billion Forecast, by Product Type 2020 & 2033
- Table 5: Global Home Fitness Industry Revenue billion Forecast, by Distribution Channel 2020 & 2033
- Table 6: Global Home Fitness Industry Revenue billion Forecast, by Country 2020 & 2033
- Table 7: United States Home Fitness Industry Revenue (billion) Forecast, by Application 2020 & 2033
- Table 8: Canada Home Fitness Industry Revenue (billion) Forecast, by Application 2020 & 2033
- Table 9: Mexico Home Fitness Industry Revenue (billion) Forecast, by Application 2020 & 2033
- Table 10: Rest of North America Home Fitness Industry Revenue (billion) Forecast, by Application 2020 & 2033
- Table 11: Global Home Fitness Industry Revenue billion Forecast, by Product Type 2020 & 2033
- Table 12: Global Home Fitness Industry Revenue billion Forecast, by Distribution Channel 2020 & 2033
- Table 13: Global Home Fitness Industry Revenue billion Forecast, by Country 2020 & 2033
- Table 14: United Kingdom Home Fitness Industry Revenue (billion) Forecast, by Application 2020 & 2033
- Table 15: Germany Home Fitness Industry Revenue (billion) Forecast, by Application 2020 & 2033
- Table 16: Spain Home Fitness Industry Revenue (billion) Forecast, by Application 2020 & 2033
- Table 17: France Home Fitness Industry Revenue (billion) Forecast, by Application 2020 & 2033
- Table 18: Italy Home Fitness Industry Revenue (billion) Forecast, by Application 2020 & 2033
- Table 19: Russia Home Fitness Industry Revenue (billion) Forecast, by Application 2020 & 2033
- Table 20: Rest of Europe Home Fitness Industry Revenue (billion) Forecast, by Application 2020 & 2033
- Table 21: Global Home Fitness Industry Revenue billion Forecast, by Product Type 2020 & 2033
- Table 22: Global Home Fitness Industry Revenue billion Forecast, by Distribution Channel 2020 & 2033
- Table 23: Global Home Fitness Industry Revenue billion Forecast, by Country 2020 & 2033
- Table 24: China Home Fitness Industry Revenue (billion) Forecast, by Application 2020 & 2033
- Table 25: Japan Home Fitness Industry Revenue (billion) Forecast, by Application 2020 & 2033
- Table 26: India Home Fitness Industry Revenue (billion) Forecast, by Application 2020 & 2033
- Table 27: Australia Home Fitness Industry Revenue (billion) Forecast, by Application 2020 & 2033
- Table 28: Rest of Asia Pacific Home Fitness Industry Revenue (billion) Forecast, by Application 2020 & 2033
- Table 29: Global Home Fitness Industry Revenue billion Forecast, by Product Type 2020 & 2033
- Table 30: Global Home Fitness Industry Revenue billion Forecast, by Distribution Channel 2020 & 2033
- Table 31: Global Home Fitness Industry Revenue billion Forecast, by Country 2020 & 2033
- Table 32: Brazil Home Fitness Industry Revenue (billion) Forecast, by Application 2020 & 2033
- Table 33: Argentina Home Fitness Industry Revenue (billion) Forecast, by Application 2020 & 2033
- Table 34: Rest of South America Home Fitness Industry Revenue (billion) Forecast, by Application 2020 & 2033
- Table 35: Global Home Fitness Industry Revenue billion Forecast, by Product Type 2020 & 2033
- Table 36: Global Home Fitness Industry Revenue billion Forecast, by Distribution Channel 2020 & 2033
- Table 37: Global Home Fitness Industry Revenue billion Forecast, by Country 2020 & 2033
- Table 38: South Africa Home Fitness Industry Revenue (billion) Forecast, by Application 2020 & 2033
- Table 39: United Arab Emirates Home Fitness Industry Revenue (billion) Forecast, by Application 2020 & 2033
- Table 40: Rest of Middle East and Africa Home Fitness Industry Revenue (billion) Forecast, by Application 2020 & 2033
Frequently Asked Questions
1. What is the projected Compound Annual Growth Rate (CAGR) of the Home Fitness Industry?
The projected CAGR is approximately 6.81%.
2. Which companies are prominent players in the Home Fitness Industry?
Key companies in the market include Decathlon SA*List Not Exhaustive, Anta International Limited (Amer Sports Oyj), Peloton Interactive Inc, Dyaco International Inc, Johnson Health Tech Co Ltd, Nautilus Inc, Technogym SpA, TRUE Fitness, Icon Health & Fitness Inc, Origin Fitness Ltd (Anytime Leisure Limited).
3. What are the main segments of the Home Fitness Industry?
The market segments include Product Type, Distribution Channel.
4. Can you provide details about the market size?
The market size is estimated to be USD 12.88 billion as of 2022.
5. What are some drivers contributing to market growth?
Aggressive Marketing and Strategic Investments by Key Players; Growing Prevalence of Smokeless Tobacco Supported By Growth in Production of Tobacco.
6. What are the notable trends driving market growth?
Rising Health Awareness Among the Consumers.
7. Are there any restraints impacting market growth?
Stringent Government Regulations Leading to Ban on Smokeless Tobacco.
8. Can you provide examples of recent developments in the market?
August 2021: Johnson Health Tech Co. Ltd acquired Matrix Fitness South Africa, a distributor for JHT prior to the acquisition, becoming the first fitness equipment company to have a wholly-owned subsidiary in Africa. The major strategy behind this move was to expand the business in the African region, which will result in positive revenue growth in the long term.
9. What pricing options are available for accessing the report?
Pricing options include single-user, multi-user, and enterprise licenses priced at USD 4750, USD 5250, and USD 8750 respectively.
10. Is the market size provided in terms of value or volume?
The market size is provided in terms of value, measured in billion.
11. Are there any specific market keywords associated with the report?
Yes, the market keyword associated with the report is "Home Fitness Industry," which aids in identifying and referencing the specific market segment covered.
12. How do I determine which pricing option suits my needs best?
The pricing options vary based on user requirements and access needs. Individual users may opt for single-user licenses, while businesses requiring broader access may choose multi-user or enterprise licenses for cost-effective access to the report.
13. Are there any additional resources or data provided in the Home Fitness Industry report?
While the report offers comprehensive insights, it's advisable to review the specific contents or supplementary materials provided to ascertain if additional resources or data are available.
14. How can I stay updated on further developments or reports in the Home Fitness Industry?
To stay informed about further developments, trends, and reports in the Home Fitness Industry, consider subscribing to industry newsletters, following relevant companies and organizations, or regularly checking reputable industry news sources and publications.
Methodology
Step 1 - Identification of Relevant Samples Size from Population Database


Step 2 - Approaches for Defining Global Market Size (Value, Volume* & Price*)

Note*: In applicable scenarios
Step 3 - Data Sources
Primary Research
- Web Analytics
- Survey Reports
- Research Institute
- Latest Research Reports
- Opinion Leaders
Secondary Research
- Annual Reports
- White Paper
- Latest Press Release
- Industry Association
- Paid Database
- Investor Presentations

Step 4 - Data Triangulation
Involves using different sources of information in order to increase the validity of a study
These sources are likely to be stakeholders in a program - participants, other researchers, program staff, other community members, and so on.
Then we put all data in single framework & apply various statistical tools to find out the dynamic on the market.
During the analysis stage, feedback from the stakeholder groups would be compared to determine areas of agreement as well as areas of divergence