

Key Insights
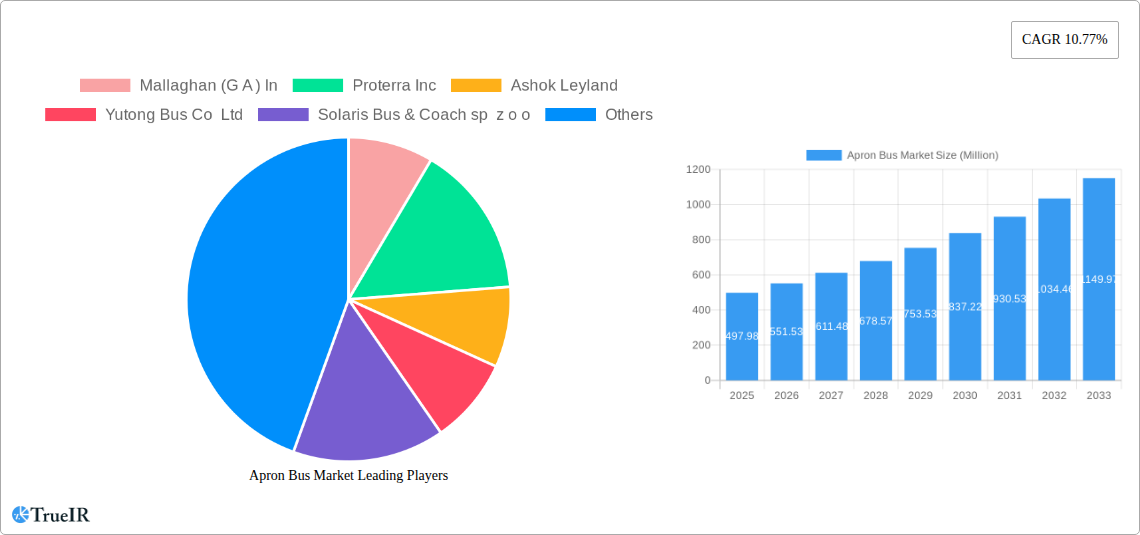
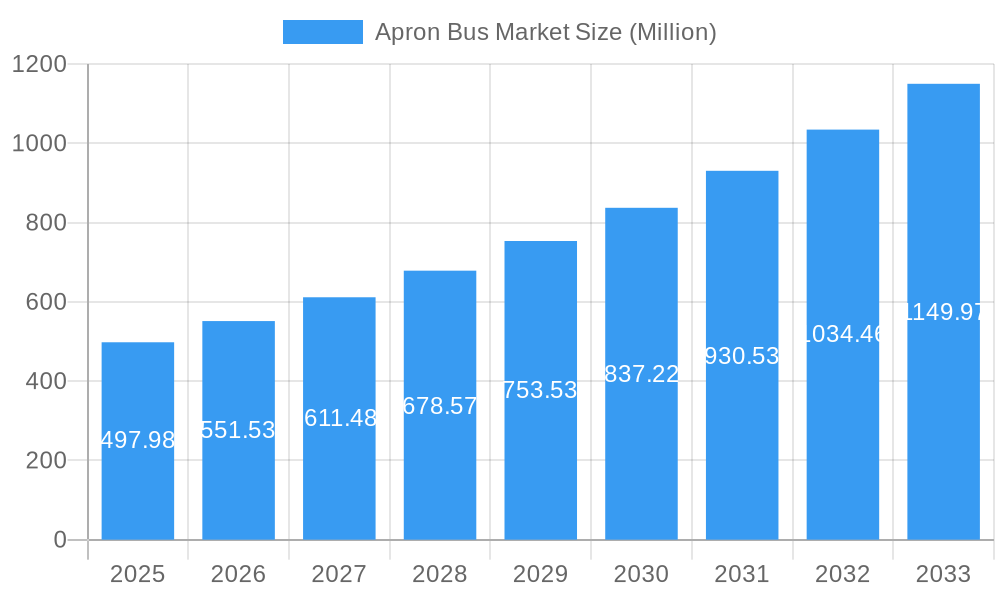
The global apron bus market, valued at $497.98 million in 2025, is projected to experience robust growth, driven by increasing air passenger traffic and the expansion of airport infrastructure globally. A Compound Annual Growth Rate (CAGR) of 10.77% is anticipated from 2025 to 2033, indicating significant market expansion. This growth is fueled by several key factors. The rising demand for efficient passenger transportation within airports, coupled with stringent regulations concerning passenger safety and comfort, are major drivers. Furthermore, the increasing adoption of electric and hybrid apron buses, driven by environmental concerns and government incentives, is significantly shaping market dynamics. Competition among established players like Mallaghan, Proterra, Ashok Leyland, and BYD, alongside emerging companies, is fostering innovation and technological advancements in vehicle design, leading to improved fuel efficiency, reduced emissions, and enhanced passenger experience. While the initial investment costs for electric apron buses might be a restraint, the long-term operational cost savings and environmental benefits are compelling factors driving adoption. The market segmentation by fuel type (electric and diesel) highlights a clear trend towards electric vehicles, which are expected to capture a larger market share in the coming years due to sustainability initiatives and technological improvements. Regional analysis indicates strong growth across North America, Europe, and Asia Pacific, reflecting the concentration of major airports and the high volume of air travel in these regions.
Apron Bus Market Market Size (In Million)
The market's future trajectory is heavily influenced by technological advancements, including the integration of autonomous driving features and improved battery technologies for electric buses. Furthermore, evolving airport infrastructure and expansion plans will significantly impact demand. Government policies promoting sustainable transportation solutions and reducing carbon emissions are also instrumental in accelerating market growth. However, fluctuations in fuel prices and the economic impact on the aviation industry could present challenges. The continued development of more efficient and cost-effective electric apron buses, coupled with supportive regulatory frameworks, will be crucial in sustaining the market's high growth trajectory throughout the forecast period. Continuous innovation in areas such as battery life, charging infrastructure, and passenger comfort will determine the success of various market players.
Apron Bus Market Company Market Share
This comprehensive report provides a detailed analysis of the global Apron Bus Market, offering invaluable insights for industry stakeholders, investors, and strategic decision-makers. Covering the period from 2019 to 2033, with a base year of 2025 and a forecast period of 2025-2033, this report meticulously examines market dynamics, competitive landscapes, and future growth potential. The market is expected to reach xx Million by 2033, exhibiting a CAGR of xx% during the forecast period.
Apron Bus Market Market Structure & Competitive Landscape
The global apron bus market exhibits a moderately concentrated structure, with a few major players holding significant market share. The Herfindahl-Hirschman Index (HHI) for the market in 2024 was estimated at xx, indicating a moderately concentrated market. Innovation is a key driver, with manufacturers continuously developing electric and hybrid models to meet stringent environmental regulations and increasing demand for sustainable transportation solutions. Regulatory changes, particularly those focused on emissions and safety, significantly impact market dynamics. The increasing adoption of stricter emission norms globally is driving the growth of electric apron buses. Product substitutes, such as smaller shuttle vehicles or conventional buses, pose some competition, although the specialized nature of apron buses limits this significantly. End-user segmentation primarily comprises airports of varying sizes, with larger international airports driving higher demand. Mergers and acquisitions (M&A) activity has been moderate in recent years, with xx major deals recorded between 2019 and 2024, resulting in a total deal value of approximately xx Million. This activity is expected to increase driven by the need for companies to expand their product portfolios and global presence.
- Market Concentration: Moderately concentrated, with a few dominant players.
- Innovation Drivers: Development of electric and hybrid models, advanced safety features.
- Regulatory Impacts: Stringent emission norms, safety regulations, and government incentives strongly influence market growth.
- Product Substitutes: Limited substitution due to specialized nature of apron buses.
- End-User Segmentation: Primarily airports (large international airports driving most of the demand).
- M&A Trends: Moderate activity in recent years, driven by expansion and portfolio diversification.
Apron Bus Market Market Trends & Opportunities
The global apron bus market is experiencing robust growth, fueled by the rising passenger traffic at airports worldwide and the increasing adoption of electric and hybrid vehicles. The market size is projected to reach xx Million by 2025 and xx Million by 2033. Technological advancements, such as the incorporation of advanced driver-assistance systems (ADAS) and improved battery technology for electric buses, are transforming the sector. Consumer preferences are shifting towards sustainable and eco-friendly transportation solutions, further boosting the demand for electric apron buses. The competitive landscape is dynamic, with both established players and new entrants vying for market share. Key players are focusing on product innovation, strategic partnerships, and expansion into new markets to enhance their competitive advantage. The market penetration rate of electric apron buses is gradually increasing, driven by government incentives and rising environmental concerns. The compound annual growth rate (CAGR) for the market during the forecast period is expected to be around xx%.
Dominant Markets & Segments in Apron Bus Market
The North American region currently holds a dominant position in the apron bus market, driven by high passenger traffic at major airports and significant investments in airport infrastructure. Within this region, the United States accounts for the largest market share. Europe is another major market, with strong adoption of electric buses in several countries. The electric segment is experiencing faster growth compared to the diesel segment, primarily due to growing environmental concerns and government regulations favoring electric vehicles.
- Key Growth Drivers in North America:
- Extensive airport infrastructure development.
- Strong government support for electric vehicle adoption.
- High passenger traffic at major airports.
- Key Growth Drivers in Europe:
- Stringent emission regulations driving the shift towards electric buses.
- Government incentives and subsidies for electric vehicle purchases.
- Increasing focus on sustainability in the transportation sector.
Apron Bus Market Product Analysis
Apron bus manufacturers are focusing on developing technologically advanced vehicles with enhanced passenger comfort, safety features, and reduced emissions. The integration of electric powertrains, advanced driver-assistance systems (ADAS), and improved battery technology are key innovations driving market growth. These advancements cater to the specific demands of airport operations, ensuring efficient passenger transport while minimizing environmental impact. The market fit for these innovations is strong, given the increasing focus on sustainability and the demand for reliable and comfortable airport transportation.
Key Drivers, Barriers & Challenges in Apron Bus Market
Key Drivers:
- Rising Air Passenger Traffic: Increased air travel fuels demand for efficient airport ground transportation.
- Government Regulations: Stringent emission standards and incentives for electric vehicles.
- Technological Advancements: Improved battery technology, ADAS, and enhanced safety features.
Key Challenges:
- High Initial Investment Costs: Electric buses have higher upfront costs compared to diesel counterparts.
- Limited Charging Infrastructure: Lack of sufficient charging infrastructure at airports can hinder adoption.
- Supply Chain Disruptions: Global supply chain issues impact the production and availability of components.
Growth Drivers in the Apron Bus Market Market
The key growth drivers for the Apron Bus market include the rising demand for efficient and sustainable airport ground transportation, stringent environmental regulations promoting electric vehicle adoption, and technological advancements leading to improved vehicle performance and reduced operational costs. Government incentives and subsidies also play a significant role in boosting market growth.
Challenges Impacting Apron Bus Market Growth
Significant challenges impacting market growth include the high initial investment costs associated with electric apron buses, the limited availability of charging infrastructure at airports, and potential supply chain disruptions affecting the timely delivery of components. Regulatory hurdles and intense competition also pose significant challenges for market players.
Key Players Shaping the Apron Bus Market Market
Significant Apron Bus Market Industry Milestones
- July 2023: Busnex launched a fully electric airport apron bus, 'DinoBus,' highlighting the industry's focus on decarbonization.
- August 2023: LSP Plus Corporation secured a five-year contract for parking and shuttle operations at Eppley Airport (OMA), US, indicating growing demand for efficient airport ground transport services.
Future Outlook for Apron Bus Market Market
The future of the apron bus market looks promising, driven by continued growth in air passenger traffic, increasing adoption of sustainable transportation solutions, and ongoing technological advancements. Strategic investments in electric vehicle infrastructure and supportive government policies will further accelerate market expansion. The market is poised for significant growth, presenting attractive opportunities for industry players to capitalize on the increasing demand for efficient and environmentally friendly airport ground transportation.
Apron Bus Market Segmentation
- 1. Production Analysis
- 2. Consumption Analysis
- 3. Import Market Analysis (Value & Volume)
- 4. Export Market Analysis (Value & Volume)
- 5. Price Trend Analysis
Apron Bus Market Segmentation By Geography
-
1. North America
- 1.1. United States
- 1.2. Canada
- 1.3. Mexico
-
2. South America
- 2.1. Brazil
- 2.2. Argentina
- 2.3. Rest of South America
-
3. Europe
- 3.1. United Kingdom
- 3.2. Germany
- 3.3. France
- 3.4. Italy
- 3.5. Spain
- 3.6. Russia
- 3.7. Benelux
- 3.8. Nordics
- 3.9. Rest of Europe
-
4. Middle East & Africa
- 4.1. Turkey
- 4.2. Israel
- 4.3. GCC
- 4.4. North Africa
- 4.5. South Africa
- 4.6. Rest of Middle East & Africa
-
5. Asia Pacific
- 5.1. China
- 5.2. India
- 5.3. Japan
- 5.4. South Korea
- 5.5. ASEAN
- 5.6. Oceania
- 5.7. Rest of Asia Pacific
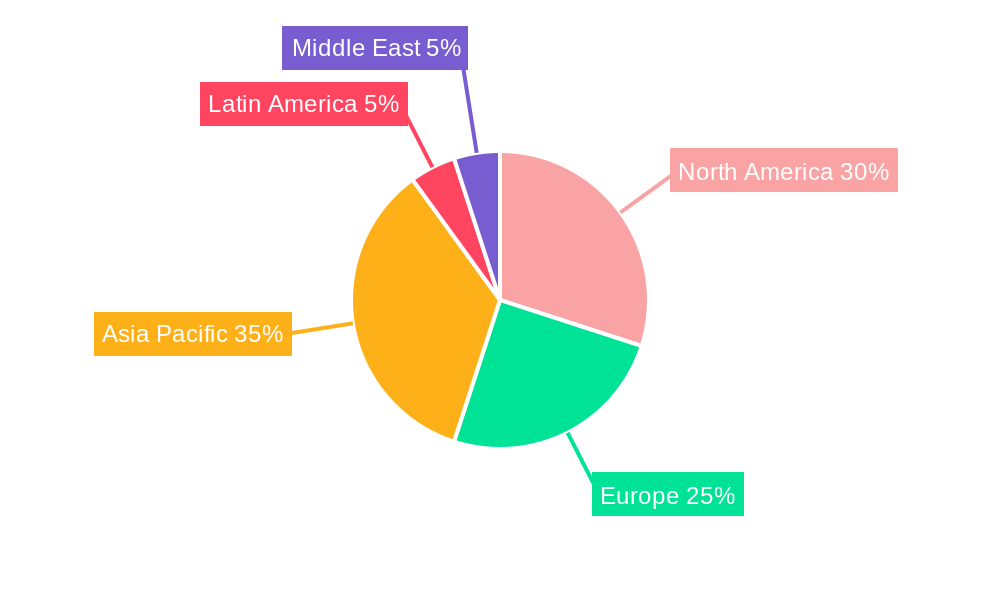
Apron Bus Market Regional Market Share
Geographic Coverage of Apron Bus Market
Apron Bus Market REPORT HIGHLIGHTS
| Aspects | Details |
|---|---|
| Study Period | 2020-2034 |
| Base Year | 2025 |
| Estimated Year | 2026 |
| Forecast Period | 2026-2034 |
| Historical Period | 2020-2025 |
| Growth Rate | CAGR of 10.77% from 2020-2034 |
| Segmentation |
|
Table of Contents
- 1. Introduction
- 1.1. Research Scope
- 1.2. Market Segmentation
- 1.3. Research Objective
- 1.4. Definitions and Assumptions
- 2. Executive Summary
- 2.1. Market Snapshot
- 3. Market Dynamics
- 3.1. Market Drivers
- 3.2. Market Restrains
- 3.3. Market Trends
- 3.4. Market Opportunities
- 4. Market Factor Analysis
- 4.1. Porters Five Forces
- 4.1.1. Bargaining Power of Suppliers
- 4.1.2. Bargaining Power of Buyers
- 4.1.3. Threat of New Entrants
- 4.1.4. Threat of Substitutes
- 4.1.5. Competitive Rivalry
- 4.2. PESTEL analysis
- 4.3. BCG Analysis
- 4.3.1. Stars (High Growth, High Market Share)
- 4.3.2. Cash Cows (Low Growth, High Market Share)
- 4.3.3. Question Mark (High Growth, Low Market Share)
- 4.3.4. Dogs (Low Growth, Low Market Share)
- 4.4. Ansoff Matrix Analysis
- 4.5. Supply Chain Analysis
- 4.6. Regulatory Landscape
- 4.7. Current Market Potential and Opportunity Assessment (TAM–SAM–SOM Framework)
- 4.8. TIR Analyst Note
- 4.1. Porters Five Forces
- 5. Market Analysis, Insights and Forecast 2021-2033
- 5.1. Market Analysis, Insights and Forecast - by Production Analysis
- 5.2. Market Analysis, Insights and Forecast - by Consumption Analysis
- 5.3. Market Analysis, Insights and Forecast - by Import Market Analysis (Value & Volume)
- 5.4. Market Analysis, Insights and Forecast - by Export Market Analysis (Value & Volume)
- 5.5. Market Analysis, Insights and Forecast - by Price Trend Analysis
- 5.6. Market Analysis, Insights and Forecast - by Region
- 5.6.1. North America
- 5.6.2. South America
- 5.6.3. Europe
- 5.6.4. Middle East & Africa
- 5.6.5. Asia Pacific
- 6. Global Apron Bus Market Analysis, Insights and Forecast, 2021-2033
- 6.1. Market Analysis, Insights and Forecast - by Production Analysis
- 6.2. Market Analysis, Insights and Forecast - by Consumption Analysis
- 6.3. Market Analysis, Insights and Forecast - by Import Market Analysis (Value & Volume)
- 6.4. Market Analysis, Insights and Forecast - by Export Market Analysis (Value & Volume)
- 6.5. Market Analysis, Insights and Forecast - by Price Trend Analysis
- 7. North America Apron Bus Market Analysis, Insights and Forecast, 2020-2032
- 7.1. Market Analysis, Insights and Forecast - by Production Analysis
- 7.2. Market Analysis, Insights and Forecast - by Consumption Analysis
- 7.3. Market Analysis, Insights and Forecast - by Import Market Analysis (Value & Volume)
- 7.4. Market Analysis, Insights and Forecast - by Export Market Analysis (Value & Volume)
- 7.5. Market Analysis, Insights and Forecast - by Price Trend Analysis
- 8. South America Apron Bus Market Analysis, Insights and Forecast, 2020-2032
- 8.1. Market Analysis, Insights and Forecast - by Production Analysis
- 8.2. Market Analysis, Insights and Forecast - by Consumption Analysis
- 8.3. Market Analysis, Insights and Forecast - by Import Market Analysis (Value & Volume)
- 8.4. Market Analysis, Insights and Forecast - by Export Market Analysis (Value & Volume)
- 8.5. Market Analysis, Insights and Forecast - by Price Trend Analysis
- 9. Europe Apron Bus Market Analysis, Insights and Forecast, 2020-2032
- 9.1. Market Analysis, Insights and Forecast - by Production Analysis
- 9.2. Market Analysis, Insights and Forecast - by Consumption Analysis
- 9.3. Market Analysis, Insights and Forecast - by Import Market Analysis (Value & Volume)
- 9.4. Market Analysis, Insights and Forecast - by Export Market Analysis (Value & Volume)
- 9.5. Market Analysis, Insights and Forecast - by Price Trend Analysis
- 10. Middle East & Africa Apron Bus Market Analysis, Insights and Forecast, 2020-2032
- 10.1. Market Analysis, Insights and Forecast - by Production Analysis
- 10.2. Market Analysis, Insights and Forecast - by Consumption Analysis
- 10.3. Market Analysis, Insights and Forecast - by Import Market Analysis (Value & Volume)
- 10.4. Market Analysis, Insights and Forecast - by Export Market Analysis (Value & Volume)
- 10.5. Market Analysis, Insights and Forecast - by Price Trend Analysis
- 11. Asia Pacific Apron Bus Market Analysis, Insights and Forecast, 2020-2032
- 11.1. Market Analysis, Insights and Forecast - by Production Analysis
- 11.2. Market Analysis, Insights and Forecast - by Consumption Analysis
- 11.3. Market Analysis, Insights and Forecast - by Import Market Analysis (Value & Volume)
- 11.4. Market Analysis, Insights and Forecast - by Export Market Analysis (Value & Volume)
- 11.5. Market Analysis, Insights and Forecast - by Price Trend Analysis
- 12. Competitive Analysis
- 12.1. Company Profiles
- 12.1.1 Mallaghan (G A ) In
- 12.1.1.1. Company Overview
- 12.1.1.2. Products
- 12.1.1.3. Company Financials
- 12.1.1.4. SWOT Analysis
- 12.1.2 Proterra Inc
- 12.1.2.1. Company Overview
- 12.1.2.2. Products
- 12.1.2.3. Company Financials
- 12.1.2.4. SWOT Analysis
- 12.1.3 Ashok Leyland
- 12.1.3.1. Company Overview
- 12.1.3.2. Products
- 12.1.3.3. Company Financials
- 12.1.3.4. SWOT Analysis
- 12.1.4 Yutong Bus Co Ltd
- 12.1.4.1. Company Overview
- 12.1.4.2. Products
- 12.1.4.3. Company Financials
- 12.1.4.4. SWOT Analysis
- 12.1.5 Solaris Bus & Coach sp z o o
- 12.1.5.1. Company Overview
- 12.1.5.2. Products
- 12.1.5.3. Company Financials
- 12.1.5.4. SWOT Analysis
- 12.1.6 Xiamen King Long International Trading Co Ltd
- 12.1.6.1. Company Overview
- 12.1.6.2. Products
- 12.1.6.3. Company Financials
- 12.1.6.4. SWOT Analysis
- 12.1.7 TAM - EUROPE
- 12.1.7.1. Company Overview
- 12.1.7.2. Products
- 12.1.7.3. Company Financials
- 12.1.7.4. SWOT Analysis
- 12.1.8 AB Volvo (Volvo Group)
- 12.1.8.1. Company Overview
- 12.1.8.2. Products
- 12.1.8.3. Company Financials
- 12.1.8.4. SWOT Analysis
- 12.1.9 COBUS Industries GmbH
- 12.1.9.1. Company Overview
- 12.1.9.2. Products
- 12.1.9.3. Company Financials
- 12.1.9.4. SWOT Analysis
- 12.1.10 BYD Company Ltd
- 12.1.10.1. Company Overview
- 12.1.10.2. Products
- 12.1.10.3. Company Financials
- 12.1.10.4. SWOT Analysis
- 12.1.11 Xinfa Airport Equipment Ltd
- 12.1.11.1. Company Overview
- 12.1.11.2. Products
- 12.1.11.3. Company Financials
- 12.1.11.4. SWOT Analysis
- 12.1.1 Mallaghan (G A ) In
- 12.2. Market Entropy
- 12.2.1 Company's Key Areas Served
- 12.2.2 Recent Developments
- 12.3. Company Market Share Analysis 2025
- 12.3.1 Top 5 Companies Market Share Analysis
- 12.3.2 Top 3 Companies Market Share Analysis
- 12.4. List of Potential Customers
- 13. Research Methodology
List of Figures
- Figure 1: Global Apron Bus Market Revenue Breakdown (million, %) by Region 2025 & 2033
- Figure 2: North America Apron Bus Market Revenue (million), by Production Analysis 2025 & 2033
- Figure 3: North America Apron Bus Market Revenue Share (%), by Production Analysis 2025 & 2033
- Figure 4: North America Apron Bus Market Revenue (million), by Consumption Analysis 2025 & 2033
- Figure 5: North America Apron Bus Market Revenue Share (%), by Consumption Analysis 2025 & 2033
- Figure 6: North America Apron Bus Market Revenue (million), by Import Market Analysis (Value & Volume) 2025 & 2033
- Figure 7: North America Apron Bus Market Revenue Share (%), by Import Market Analysis (Value & Volume) 2025 & 2033
- Figure 8: North America Apron Bus Market Revenue (million), by Export Market Analysis (Value & Volume) 2025 & 2033
- Figure 9: North America Apron Bus Market Revenue Share (%), by Export Market Analysis (Value & Volume) 2025 & 2033
- Figure 10: North America Apron Bus Market Revenue (million), by Price Trend Analysis 2025 & 2033
- Figure 11: North America Apron Bus Market Revenue Share (%), by Price Trend Analysis 2025 & 2033
- Figure 12: North America Apron Bus Market Revenue (million), by Country 2025 & 2033
- Figure 13: North America Apron Bus Market Revenue Share (%), by Country 2025 & 2033
- Figure 14: South America Apron Bus Market Revenue (million), by Production Analysis 2025 & 2033
- Figure 15: South America Apron Bus Market Revenue Share (%), by Production Analysis 2025 & 2033
- Figure 16: South America Apron Bus Market Revenue (million), by Consumption Analysis 2025 & 2033
- Figure 17: South America Apron Bus Market Revenue Share (%), by Consumption Analysis 2025 & 2033
- Figure 18: South America Apron Bus Market Revenue (million), by Import Market Analysis (Value & Volume) 2025 & 2033
- Figure 19: South America Apron Bus Market Revenue Share (%), by Import Market Analysis (Value & Volume) 2025 & 2033
- Figure 20: South America Apron Bus Market Revenue (million), by Export Market Analysis (Value & Volume) 2025 & 2033
- Figure 21: South America Apron Bus Market Revenue Share (%), by Export Market Analysis (Value & Volume) 2025 & 2033
- Figure 22: South America Apron Bus Market Revenue (million), by Price Trend Analysis 2025 & 2033
- Figure 23: South America Apron Bus Market Revenue Share (%), by Price Trend Analysis 2025 & 2033
- Figure 24: South America Apron Bus Market Revenue (million), by Country 2025 & 2033
- Figure 25: South America Apron Bus Market Revenue Share (%), by Country 2025 & 2033
- Figure 26: Europe Apron Bus Market Revenue (million), by Production Analysis 2025 & 2033
- Figure 27: Europe Apron Bus Market Revenue Share (%), by Production Analysis 2025 & 2033
- Figure 28: Europe Apron Bus Market Revenue (million), by Consumption Analysis 2025 & 2033
- Figure 29: Europe Apron Bus Market Revenue Share (%), by Consumption Analysis 2025 & 2033
- Figure 30: Europe Apron Bus Market Revenue (million), by Import Market Analysis (Value & Volume) 2025 & 2033
- Figure 31: Europe Apron Bus Market Revenue Share (%), by Import Market Analysis (Value & Volume) 2025 & 2033
- Figure 32: Europe Apron Bus Market Revenue (million), by Export Market Analysis (Value & Volume) 2025 & 2033
- Figure 33: Europe Apron Bus Market Revenue Share (%), by Export Market Analysis (Value & Volume) 2025 & 2033
- Figure 34: Europe Apron Bus Market Revenue (million), by Price Trend Analysis 2025 & 2033
- Figure 35: Europe Apron Bus Market Revenue Share (%), by Price Trend Analysis 2025 & 2033
- Figure 36: Europe Apron Bus Market Revenue (million), by Country 2025 & 2033
- Figure 37: Europe Apron Bus Market Revenue Share (%), by Country 2025 & 2033
- Figure 38: Middle East & Africa Apron Bus Market Revenue (million), by Production Analysis 2025 & 2033
- Figure 39: Middle East & Africa Apron Bus Market Revenue Share (%), by Production Analysis 2025 & 2033
- Figure 40: Middle East & Africa Apron Bus Market Revenue (million), by Consumption Analysis 2025 & 2033
- Figure 41: Middle East & Africa Apron Bus Market Revenue Share (%), by Consumption Analysis 2025 & 2033
- Figure 42: Middle East & Africa Apron Bus Market Revenue (million), by Import Market Analysis (Value & Volume) 2025 & 2033
- Figure 43: Middle East & Africa Apron Bus Market Revenue Share (%), by Import Market Analysis (Value & Volume) 2025 & 2033
- Figure 44: Middle East & Africa Apron Bus Market Revenue (million), by Export Market Analysis (Value & Volume) 2025 & 2033
- Figure 45: Middle East & Africa Apron Bus Market Revenue Share (%), by Export Market Analysis (Value & Volume) 2025 & 2033
- Figure 46: Middle East & Africa Apron Bus Market Revenue (million), by Price Trend Analysis 2025 & 2033
- Figure 47: Middle East & Africa Apron Bus Market Revenue Share (%), by Price Trend Analysis 2025 & 2033
- Figure 48: Middle East & Africa Apron Bus Market Revenue (million), by Country 2025 & 2033
- Figure 49: Middle East & Africa Apron Bus Market Revenue Share (%), by Country 2025 & 2033
- Figure 50: Asia Pacific Apron Bus Market Revenue (million), by Production Analysis 2025 & 2033
- Figure 51: Asia Pacific Apron Bus Market Revenue Share (%), by Production Analysis 2025 & 2033
- Figure 52: Asia Pacific Apron Bus Market Revenue (million), by Consumption Analysis 2025 & 2033
- Figure 53: Asia Pacific Apron Bus Market Revenue Share (%), by Consumption Analysis 2025 & 2033
- Figure 54: Asia Pacific Apron Bus Market Revenue (million), by Import Market Analysis (Value & Volume) 2025 & 2033
- Figure 55: Asia Pacific Apron Bus Market Revenue Share (%), by Import Market Analysis (Value & Volume) 2025 & 2033
- Figure 56: Asia Pacific Apron Bus Market Revenue (million), by Export Market Analysis (Value & Volume) 2025 & 2033
- Figure 57: Asia Pacific Apron Bus Market Revenue Share (%), by Export Market Analysis (Value & Volume) 2025 & 2033
- Figure 58: Asia Pacific Apron Bus Market Revenue (million), by Price Trend Analysis 2025 & 2033
- Figure 59: Asia Pacific Apron Bus Market Revenue Share (%), by Price Trend Analysis 2025 & 2033
- Figure 60: Asia Pacific Apron Bus Market Revenue (million), by Country 2025 & 2033
- Figure 61: Asia Pacific Apron Bus Market Revenue Share (%), by Country 2025 & 2033
List of Tables
- Table 1: Global Apron Bus Market Revenue million Forecast, by Production Analysis 2020 & 2033
- Table 2: Global Apron Bus Market Revenue million Forecast, by Consumption Analysis 2020 & 2033
- Table 3: Global Apron Bus Market Revenue million Forecast, by Import Market Analysis (Value & Volume) 2020 & 2033
- Table 4: Global Apron Bus Market Revenue million Forecast, by Export Market Analysis (Value & Volume) 2020 & 2033
- Table 5: Global Apron Bus Market Revenue million Forecast, by Price Trend Analysis 2020 & 2033
- Table 6: Global Apron Bus Market Revenue million Forecast, by Region 2020 & 2033
- Table 7: Global Apron Bus Market Revenue million Forecast, by Production Analysis 2020 & 2033
- Table 8: Global Apron Bus Market Revenue million Forecast, by Consumption Analysis 2020 & 2033
- Table 9: Global Apron Bus Market Revenue million Forecast, by Import Market Analysis (Value & Volume) 2020 & 2033
- Table 10: Global Apron Bus Market Revenue million Forecast, by Export Market Analysis (Value & Volume) 2020 & 2033
- Table 11: Global Apron Bus Market Revenue million Forecast, by Price Trend Analysis 2020 & 2033
- Table 12: Global Apron Bus Market Revenue million Forecast, by Country 2020 & 2033
- Table 13: United States Apron Bus Market Revenue (million) Forecast, by Application 2020 & 2033
- Table 14: Canada Apron Bus Market Revenue (million) Forecast, by Application 2020 & 2033
- Table 15: Mexico Apron Bus Market Revenue (million) Forecast, by Application 2020 & 2033
- Table 16: Global Apron Bus Market Revenue million Forecast, by Production Analysis 2020 & 2033
- Table 17: Global Apron Bus Market Revenue million Forecast, by Consumption Analysis 2020 & 2033
- Table 18: Global Apron Bus Market Revenue million Forecast, by Import Market Analysis (Value & Volume) 2020 & 2033
- Table 19: Global Apron Bus Market Revenue million Forecast, by Export Market Analysis (Value & Volume) 2020 & 2033
- Table 20: Global Apron Bus Market Revenue million Forecast, by Price Trend Analysis 2020 & 2033
- Table 21: Global Apron Bus Market Revenue million Forecast, by Country 2020 & 2033
- Table 22: Brazil Apron Bus Market Revenue (million) Forecast, by Application 2020 & 2033
- Table 23: Argentina Apron Bus Market Revenue (million) Forecast, by Application 2020 & 2033
- Table 24: Rest of South America Apron Bus Market Revenue (million) Forecast, by Application 2020 & 2033
- Table 25: Global Apron Bus Market Revenue million Forecast, by Production Analysis 2020 & 2033
- Table 26: Global Apron Bus Market Revenue million Forecast, by Consumption Analysis 2020 & 2033
- Table 27: Global Apron Bus Market Revenue million Forecast, by Import Market Analysis (Value & Volume) 2020 & 2033
- Table 28: Global Apron Bus Market Revenue million Forecast, by Export Market Analysis (Value & Volume) 2020 & 2033
- Table 29: Global Apron Bus Market Revenue million Forecast, by Price Trend Analysis 2020 & 2033
- Table 30: Global Apron Bus Market Revenue million Forecast, by Country 2020 & 2033
- Table 31: United Kingdom Apron Bus Market Revenue (million) Forecast, by Application 2020 & 2033
- Table 32: Germany Apron Bus Market Revenue (million) Forecast, by Application 2020 & 2033
- Table 33: France Apron Bus Market Revenue (million) Forecast, by Application 2020 & 2033
- Table 34: Italy Apron Bus Market Revenue (million) Forecast, by Application 2020 & 2033
- Table 35: Spain Apron Bus Market Revenue (million) Forecast, by Application 2020 & 2033
- Table 36: Russia Apron Bus Market Revenue (million) Forecast, by Application 2020 & 2033
- Table 37: Benelux Apron Bus Market Revenue (million) Forecast, by Application 2020 & 2033
- Table 38: Nordics Apron Bus Market Revenue (million) Forecast, by Application 2020 & 2033
- Table 39: Rest of Europe Apron Bus Market Revenue (million) Forecast, by Application 2020 & 2033
- Table 40: Global Apron Bus Market Revenue million Forecast, by Production Analysis 2020 & 2033
- Table 41: Global Apron Bus Market Revenue million Forecast, by Consumption Analysis 2020 & 2033
- Table 42: Global Apron Bus Market Revenue million Forecast, by Import Market Analysis (Value & Volume) 2020 & 2033
- Table 43: Global Apron Bus Market Revenue million Forecast, by Export Market Analysis (Value & Volume) 2020 & 2033
- Table 44: Global Apron Bus Market Revenue million Forecast, by Price Trend Analysis 2020 & 2033
- Table 45: Global Apron Bus Market Revenue million Forecast, by Country 2020 & 2033
- Table 46: Turkey Apron Bus Market Revenue (million) Forecast, by Application 2020 & 2033
- Table 47: Israel Apron Bus Market Revenue (million) Forecast, by Application 2020 & 2033
- Table 48: GCC Apron Bus Market Revenue (million) Forecast, by Application 2020 & 2033
- Table 49: North Africa Apron Bus Market Revenue (million) Forecast, by Application 2020 & 2033
- Table 50: South Africa Apron Bus Market Revenue (million) Forecast, by Application 2020 & 2033
- Table 51: Rest of Middle East & Africa Apron Bus Market Revenue (million) Forecast, by Application 2020 & 2033
- Table 52: Global Apron Bus Market Revenue million Forecast, by Production Analysis 2020 & 2033
- Table 53: Global Apron Bus Market Revenue million Forecast, by Consumption Analysis 2020 & 2033
- Table 54: Global Apron Bus Market Revenue million Forecast, by Import Market Analysis (Value & Volume) 2020 & 2033
- Table 55: Global Apron Bus Market Revenue million Forecast, by Export Market Analysis (Value & Volume) 2020 & 2033
- Table 56: Global Apron Bus Market Revenue million Forecast, by Price Trend Analysis 2020 & 2033
- Table 57: Global Apron Bus Market Revenue million Forecast, by Country 2020 & 2033
- Table 58: China Apron Bus Market Revenue (million) Forecast, by Application 2020 & 2033
- Table 59: India Apron Bus Market Revenue (million) Forecast, by Application 2020 & 2033
- Table 60: Japan Apron Bus Market Revenue (million) Forecast, by Application 2020 & 2033
- Table 61: South Korea Apron Bus Market Revenue (million) Forecast, by Application 2020 & 2033
- Table 62: ASEAN Apron Bus Market Revenue (million) Forecast, by Application 2020 & 2033
- Table 63: Oceania Apron Bus Market Revenue (million) Forecast, by Application 2020 & 2033
- Table 64: Rest of Asia Pacific Apron Bus Market Revenue (million) Forecast, by Application 2020 & 2033
Frequently Asked Questions
1. What is the projected Compound Annual Growth Rate (CAGR) of the Apron Bus Market?
The projected CAGR is approximately 10.77%.
2. Which companies are prominent players in the Apron Bus Market?
Key companies in the market include Mallaghan (G A ) In, Proterra Inc, Ashok Leyland, Yutong Bus Co Ltd, Solaris Bus & Coach sp z o o, Xiamen King Long International Trading Co Ltd, TAM - EUROPE, AB Volvo (Volvo Group), COBUS Industries GmbH, BYD Company Ltd, Xinfa Airport Equipment Ltd.
3. What are the main segments of the Apron Bus Market?
The market segments include Production Analysis, Consumption Analysis, Import Market Analysis (Value & Volume), Export Market Analysis (Value & Volume), Price Trend Analysis.
4. Can you provide details about the market size?
The market size is estimated to be USD 551.61 million as of 2022.
5. What are some drivers contributing to market growth?
Increase in Internet of Things (IoT) and Autonomous Systems; Rise in Demand for Military and Defense Satellite Communication Solutions.
6. What are the notable trends driving market growth?
Electric Segment is Expected to Show Significant Growth During the Forecast Period.
7. Are there any restraints impacting market growth?
Cybersecurity Threats to Satellite Communication; Interference in Transmission of Data.
8. Can you provide examples of recent developments in the market?
August 2023: LSP Plus Corporation Announced a Five-Year Parking and Shuttle Operations Contract for the management of all public and employee parking facilities and public and employee shuttle service at Eppley Airport (OMA), US.
9. What pricing options are available for accessing the report?
Pricing options include single-user, multi-user, and enterprise licenses priced at USD 4750, USD 5250, and USD 8750 respectively.
10. Is the market size provided in terms of value or volume?
The market size is provided in terms of value, measured in million.
11. Are there any specific market keywords associated with the report?
Yes, the market keyword associated with the report is "Apron Bus Market," which aids in identifying and referencing the specific market segment covered.
12. How do I determine which pricing option suits my needs best?
The pricing options vary based on user requirements and access needs. Individual users may opt for single-user licenses, while businesses requiring broader access may choose multi-user or enterprise licenses for cost-effective access to the report.
13. Are there any additional resources or data provided in the Apron Bus Market report?
While the report offers comprehensive insights, it's advisable to review the specific contents or supplementary materials provided to ascertain if additional resources or data are available.
14. How can I stay updated on further developments or reports in the Apron Bus Market?
To stay informed about further developments, trends, and reports in the Apron Bus Market, consider subscribing to industry newsletters, following relevant companies and organizations, or regularly checking reputable industry news sources and publications.
Methodology
Step 1 - Identification of Relevant Samples Size from Population Database


Step 2 - Approaches for Defining Global Market Size (Value, Volume* & Price*)

Note*: In applicable scenarios
Step 3 - Data Sources
Primary Research
- Web Analytics
- Survey Reports
- Research Institute
- Latest Research Reports
- Opinion Leaders
Secondary Research
- Annual Reports
- White Paper
- Latest Press Release
- Industry Association
- Paid Database
- Investor Presentations

Step 4 - Data Triangulation
Involves using different sources of information in order to increase the validity of a study
These sources are likely to be stakeholders in a program - participants, other researchers, program staff, other community members, and so on.
Then we put all data in single framework & apply various statistical tools to find out the dynamic on the market.
During the analysis stage, feedback from the stakeholder groups would be compared to determine areas of agreement as well as areas of divergence