

Key Insights
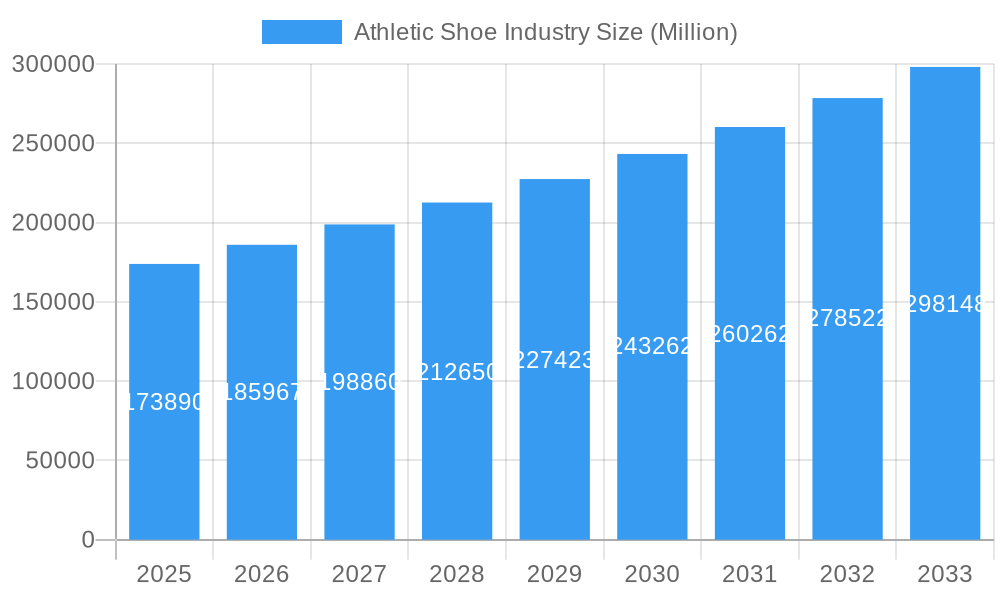
The global athletic shoe market, valued at $173.89 billion in 2025, is projected to experience robust growth, driven by several key factors. The rising popularity of fitness activities, including running, sports, and hiking, fuels demand for specialized footwear. Technological advancements in shoe design, focusing on enhanced comfort, performance, and durability, further stimulate market expansion. The increasing disposable incomes in developing economies, particularly in Asia-Pacific, contribute significantly to market growth, as consumers invest more in athletic apparel and footwear. The market is segmented by product type (running, sports, trekking/hiking, others), end-user (men, women, children), and distribution channel (specialty stores, supermarkets, online retail). The dominance of established brands like Nike, Adidas, and Under Armour is noteworthy, although emerging brands are continuously challenging the market leaders through innovation and competitive pricing. Online retail channels are experiencing rapid growth, reflecting the broader shift toward e-commerce in the consumer goods sector.
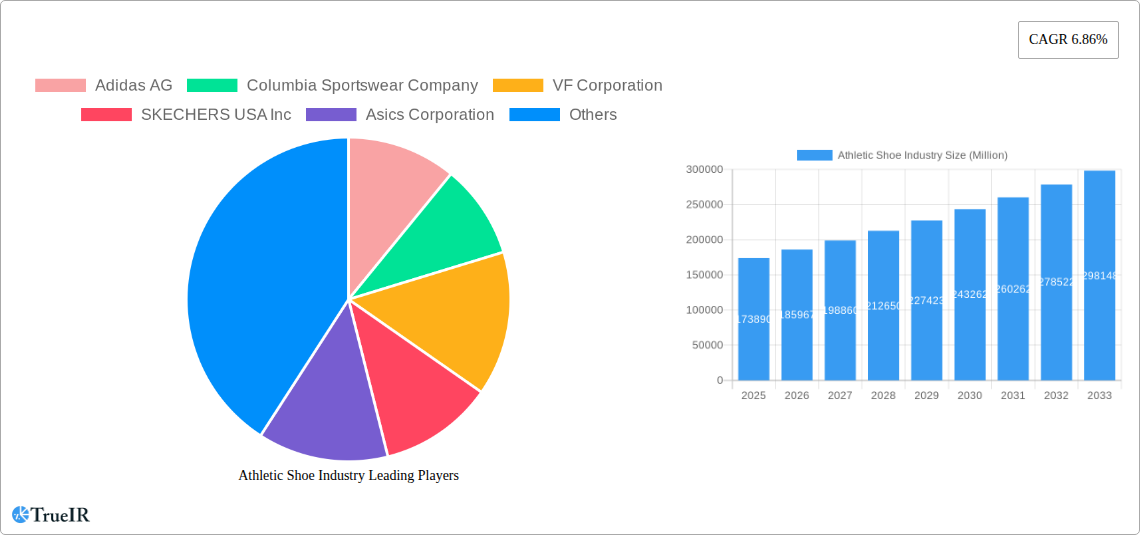
Athletic Shoe Industry Market Size (In Billion)
Growth is expected to continue at a Compound Annual Growth Rate (CAGR) of 6.86% from 2025 to 2033. This growth will be influenced by several factors, including the increasing awareness of health and wellness, particularly among younger demographics. Marketing and sponsorship initiatives by major athletic shoe brands continue to shape consumer preferences. However, potential restraints include fluctuating raw material prices and economic downturns, which could impact consumer spending on discretionary items like athletic footwear. Geographic variations in market growth are also anticipated, with Asia-Pacific expected to remain a key growth driver due to its expanding middle class and rising participation in sports and fitness activities. Competition among existing players and the entry of new players will continue to intensify, forcing companies to focus on product differentiation, brand building, and effective marketing strategies to gain and maintain market share.
Athletic Shoe Industry Company Market Share
Athletic Shoe Industry Market Report: 2019-2033
This comprehensive report provides a detailed analysis of the global athletic shoe industry, offering invaluable insights for investors, industry professionals, and strategic decision-makers. With a study period spanning 2019-2033, a base year of 2025, and a forecast period of 2025-2033, this report leverages rigorous data analysis and expert insights to present a clear picture of current market dynamics and future trends. The market is expected to reach $xx Million by 2033, exhibiting a CAGR of xx% during the forecast period. This report covers key players like Nike Inc, Adidas AG, Puma SE, and more, offering a deep dive into market segmentation, competitive landscapes, and growth drivers.
Athletic Shoe Industry Market Structure & Competitive Landscape
The global athletic shoe market is characterized by a moderately concentrated structure, with a few dominant players holding significant market share. The Herfindahl-Hirschman Index (HHI) for 2024 is estimated at xx, indicating a moderately concentrated market. Innovation plays a crucial role, with continuous advancements in materials, design, and technology driving market growth. Regulatory impacts, such as those related to material sourcing and labor practices, are increasingly significant. Product substitutes, like casual footwear and minimalist shoes, pose a competitive threat. The market is segmented by end-user (men, women, children) and product type (running, sports, trekking/hiking, other). M&A activity has been relatively moderate in recent years, with a total deal value of approximately $xx Million in 2024. Key trends include:
- Increasing focus on sustainability: Brands are increasingly adopting sustainable materials and manufacturing processes.
- Technological advancements: Integration of smart technologies and data analytics for personalized experiences.
- Evolving consumer preferences: Growing demand for specialized footwear for various activities.
- Brand diversification: Expansion into new product categories and geographic markets.
Athletic Shoe Industry Market Trends & Opportunities
The global athletic shoe market is experiencing robust growth, driven by several key factors. The market size reached $xx Million in 2024 and is projected to reach $xx Million by 2033. This growth is fueled by rising disposable incomes, increasing health consciousness, and the growing popularity of various sports and fitness activities. Technological advancements, such as the incorporation of advanced materials and innovative designs, are significantly impacting the market. Consumer preferences are shifting towards specialized footwear designed for specific activities, driving demand for niche products. The competitive landscape is intense, with major players engaging in aggressive marketing and product innovation strategies. Key opportunities lie in tapping into emerging markets, expanding into new product segments (e.g., smart shoes), and leveraging e-commerce channels to reach a wider customer base. The CAGR for the forecast period is estimated at xx%, with market penetration rates varying significantly across different regions and segments.
Dominant Markets & Segments in Athletic Shoe Industry
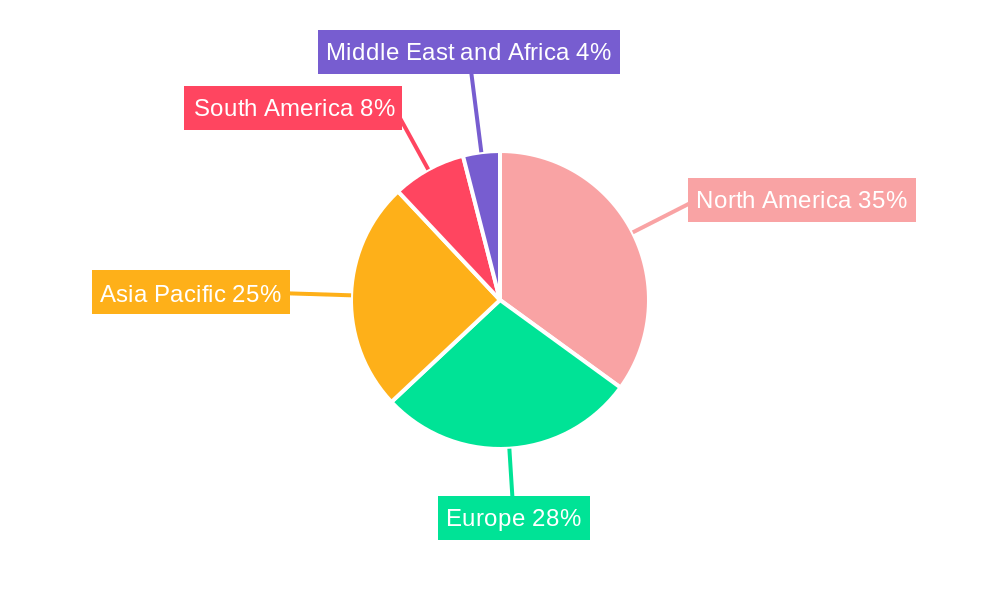
The North American region dominates the athletic shoe market, driven by high consumer spending and a strong preference for athletic footwear. Within this region, the United States holds the largest market share. By product type, running shoes constitute the largest segment, followed by sports shoes and trekking/hiking shoes. Men's athletic shoes account for the largest share of the end-user segment. Online retail stores are increasingly becoming a dominant distribution channel, fueled by the growth of e-commerce.
- Key Growth Drivers:
- Rising disposable incomes in developing economies: Increased purchasing power driving demand for athletic footwear.
- Growing popularity of fitness and sports activities: Increased participation in various sports and fitness regimes.
- Expansion of e-commerce platforms: Convenient online shopping experiences leading to increased sales.
- Government initiatives promoting sports and fitness: Policy measures fostering sports participation.
Athletic Shoe Industry Product Analysis
Recent innovations in athletic shoe technology include the use of advanced materials like graphene and carbon fiber for enhanced performance and durability, as well as the integration of sensors and smart technology for data tracking and personalized feedback. These innovations cater to the increasing demand for specialized footwear designed for specific activities and cater to individual needs and preferences. The competitive advantage lies in offering superior comfort, performance, and technological features.
Key Drivers, Barriers & Challenges in Athletic Shoe Industry
Key Drivers: Rising health consciousness, increasing participation in sports and fitness activities, technological advancements, and growing disposable incomes are key drivers. Government initiatives promoting sports and fitness further stimulate market growth.
Challenges: Supply chain disruptions, increasing raw material costs, intense competition, and stringent environmental regulations pose significant challenges. Geopolitical instability and economic fluctuations can also impact market growth. For example, a 10% increase in raw material costs could lead to a 5% reduction in profit margins for some companies.
Growth Drivers in the Athletic Shoe Industry Market
Technological advancements, rising health awareness, increasing disposable incomes, and expanding e-commerce channels are major drivers. Government support for sports and fitness initiatives further fuels growth.
Challenges Impacting Athletic Shoe Industry Growth
Supply chain vulnerabilities, escalating raw material costs, intense competition, and stringent environmental regulations hinder growth. Economic downturns and geopolitical instability also pose significant challenges.
Key Players Shaping the Athletic Shoe Industry Market
Significant Athletic Shoe Industry Industry Milestones
- June 2024: Nike launched the Converse Run Star Trainer, a hybrid shoe blending retro and modern styles, expanding its product portfolio and targeting a broader consumer base.
- June 2024: PUMA's partnership with HYROX positions the brand as a leader in fitness and expands its reach within the fitness community.
- June 2024: PUMA launched the Deviate NITRO 3 training shoes, showcasing technological advancements in cushioning and responsiveness, enhancing its competitive edge.
Future Outlook for Athletic Shoe Industry Market
The athletic shoe industry is poised for continued growth, driven by technological innovations, evolving consumer preferences, and expanding market penetration in emerging economies. Strategic opportunities exist in developing sustainable and personalized footwear, leveraging data analytics, and expanding into new product categories and geographic markets. The market's potential is significant, with substantial growth expected across various segments and regions.
Athletic Shoe Industry Segmentation
-
1. Product Type
- 1.1. Running Shoes
- 1.2. Sports Shoes
- 1.3. Trekking/Hiking Shoes
- 1.4. Other Product Types
-
2. End User
- 2.1. Men
- 2.2. Women
- 2.3. Kids/Children
-
3. Distribution Channel
- 3.1. Sports and Atheletic Goods Stores
- 3.2. Supermarkets/Hypermarkets
- 3.3. Online Retail Stores
- 3.4. Other Distribution Channels
Athletic Shoe Industry Segmentation By Geography
-
1. North America
- 1.1. United States
- 1.2. Canada
- 1.3. Mexico
- 1.4. Rest of North America
-
2. Europe
- 2.1. United Kingdom
- 2.2. Germany
- 2.3. Spain
- 2.4. France
- 2.5. Italy
- 2.6. Netherlands
- 2.7. Rest of Europe
-
3. Asia Pacific
- 3.1. China
- 3.2. Japan
- 3.3. India
- 3.4. Australia
- 3.5. Rest of Asia Pacific
-
4. South America
- 4.1. Brazil
- 4.2. Argentina
- 4.3. Rest of South America
-
5. Middle East and Africa
- 5.1. Saudi Arabia
- 5.2. South Africa
- 5.3. Rest of Middle East and Africa
Athletic Shoe Industry Regional Market Share
Geographic Coverage of Athletic Shoe Industry
Athletic Shoe Industry REPORT HIGHLIGHTS
| Aspects | Details |
|---|---|
| Study Period | 2020-2034 |
| Base Year | 2025 |
| Estimated Year | 2026 |
| Forecast Period | 2026-2034 |
| Historical Period | 2020-2025 |
| Growth Rate | CAGR of 6.86% from 2020-2034 |
| Segmentation |
|
Table of Contents
- 1. Introduction
- 1.1. Research Scope
- 1.2. Market Segmentation
- 1.3. Research Objective
- 1.4. Definitions and Assumptions
- 2. Executive Summary
- 2.1. Market Snapshot
- 3. Market Dynamics
- 3.1. Market Drivers
- 3.2. Market Restrains
- 3.3. Market Trends
- 3.4. Market Opportunities
- 4. Market Factor Analysis
- 4.1. Porters Five Forces
- 4.1.1. Bargaining Power of Suppliers
- 4.1.2. Bargaining Power of Buyers
- 4.1.3. Threat of New Entrants
- 4.1.4. Threat of Substitutes
- 4.1.5. Competitive Rivalry
- 4.2. PESTEL analysis
- 4.3. BCG Analysis
- 4.3.1. Stars (High Growth, High Market Share)
- 4.3.2. Cash Cows (Low Growth, High Market Share)
- 4.3.3. Question Mark (High Growth, Low Market Share)
- 4.3.4. Dogs (Low Growth, Low Market Share)
- 4.4. Ansoff Matrix Analysis
- 4.5. Supply Chain Analysis
- 4.6. Regulatory Landscape
- 4.7. Current Market Potential and Opportunity Assessment (TAM–SAM–SOM Framework)
- 4.8. TIR Analyst Note
- 4.1. Porters Five Forces
- 5. Market Analysis, Insights and Forecast 2021-2033
- 5.1. Market Analysis, Insights and Forecast - by Product Type
- 5.1.1. Running Shoes
- 5.1.2. Sports Shoes
- 5.1.3. Trekking/Hiking Shoes
- 5.1.4. Other Product Types
- 5.2. Market Analysis, Insights and Forecast - by End User
- 5.2.1. Men
- 5.2.2. Women
- 5.2.3. Kids/Children
- 5.3. Market Analysis, Insights and Forecast - by Distribution Channel
- 5.3.1. Sports and Atheletic Goods Stores
- 5.3.2. Supermarkets/Hypermarkets
- 5.3.3. Online Retail Stores
- 5.3.4. Other Distribution Channels
- 5.4. Market Analysis, Insights and Forecast - by Region
- 5.4.1. North America
- 5.4.2. Europe
- 5.4.3. Asia Pacific
- 5.4.4. South America
- 5.4.5. Middle East and Africa
- 5.1. Market Analysis, Insights and Forecast - by Product Type
- 6. Global Athletic Shoe Industry Analysis, Insights and Forecast, 2021-2033
- 6.1. Market Analysis, Insights and Forecast - by Product Type
- 6.1.1. Running Shoes
- 6.1.2. Sports Shoes
- 6.1.3. Trekking/Hiking Shoes
- 6.1.4. Other Product Types
- 6.2. Market Analysis, Insights and Forecast - by End User
- 6.2.1. Men
- 6.2.2. Women
- 6.2.3. Kids/Children
- 6.3. Market Analysis, Insights and Forecast - by Distribution Channel
- 6.3.1. Sports and Atheletic Goods Stores
- 6.3.2. Supermarkets/Hypermarkets
- 6.3.3. Online Retail Stores
- 6.3.4. Other Distribution Channels
- 6.1. Market Analysis, Insights and Forecast - by Product Type
- 7. North America Athletic Shoe Industry Analysis, Insights and Forecast, 2020-2032
- 7.1. Market Analysis, Insights and Forecast - by Product Type
- 7.1.1. Running Shoes
- 7.1.2. Sports Shoes
- 7.1.3. Trekking/Hiking Shoes
- 7.1.4. Other Product Types
- 7.2. Market Analysis, Insights and Forecast - by End User
- 7.2.1. Men
- 7.2.2. Women
- 7.2.3. Kids/Children
- 7.3. Market Analysis, Insights and Forecast - by Distribution Channel
- 7.3.1. Sports and Atheletic Goods Stores
- 7.3.2. Supermarkets/Hypermarkets
- 7.3.3. Online Retail Stores
- 7.3.4. Other Distribution Channels
- 7.1. Market Analysis, Insights and Forecast - by Product Type
- 8. Europe Athletic Shoe Industry Analysis, Insights and Forecast, 2020-2032
- 8.1. Market Analysis, Insights and Forecast - by Product Type
- 8.1.1. Running Shoes
- 8.1.2. Sports Shoes
- 8.1.3. Trekking/Hiking Shoes
- 8.1.4. Other Product Types
- 8.2. Market Analysis, Insights and Forecast - by End User
- 8.2.1. Men
- 8.2.2. Women
- 8.2.3. Kids/Children
- 8.3. Market Analysis, Insights and Forecast - by Distribution Channel
- 8.3.1. Sports and Atheletic Goods Stores
- 8.3.2. Supermarkets/Hypermarkets
- 8.3.3. Online Retail Stores
- 8.3.4. Other Distribution Channels
- 8.1. Market Analysis, Insights and Forecast - by Product Type
- 9. Asia Pacific Athletic Shoe Industry Analysis, Insights and Forecast, 2020-2032
- 9.1. Market Analysis, Insights and Forecast - by Product Type
- 9.1.1. Running Shoes
- 9.1.2. Sports Shoes
- 9.1.3. Trekking/Hiking Shoes
- 9.1.4. Other Product Types
- 9.2. Market Analysis, Insights and Forecast - by End User
- 9.2.1. Men
- 9.2.2. Women
- 9.2.3. Kids/Children
- 9.3. Market Analysis, Insights and Forecast - by Distribution Channel
- 9.3.1. Sports and Atheletic Goods Stores
- 9.3.2. Supermarkets/Hypermarkets
- 9.3.3. Online Retail Stores
- 9.3.4. Other Distribution Channels
- 9.1. Market Analysis, Insights and Forecast - by Product Type
- 10. South America Athletic Shoe Industry Analysis, Insights and Forecast, 2020-2032
- 10.1. Market Analysis, Insights and Forecast - by Product Type
- 10.1.1. Running Shoes
- 10.1.2. Sports Shoes
- 10.1.3. Trekking/Hiking Shoes
- 10.1.4. Other Product Types
- 10.2. Market Analysis, Insights and Forecast - by End User
- 10.2.1. Men
- 10.2.2. Women
- 10.2.3. Kids/Children
- 10.3. Market Analysis, Insights and Forecast - by Distribution Channel
- 10.3.1. Sports and Atheletic Goods Stores
- 10.3.2. Supermarkets/Hypermarkets
- 10.3.3. Online Retail Stores
- 10.3.4. Other Distribution Channels
- 10.1. Market Analysis, Insights and Forecast - by Product Type
- 11. Middle East and Africa Athletic Shoe Industry Analysis, Insights and Forecast, 2020-2032
- 11.1. Market Analysis, Insights and Forecast - by Product Type
- 11.1.1. Running Shoes
- 11.1.2. Sports Shoes
- 11.1.3. Trekking/Hiking Shoes
- 11.1.4. Other Product Types
- 11.2. Market Analysis, Insights and Forecast - by End User
- 11.2.1. Men
- 11.2.2. Women
- 11.2.3. Kids/Children
- 11.3. Market Analysis, Insights and Forecast - by Distribution Channel
- 11.3.1. Sports and Atheletic Goods Stores
- 11.3.2. Supermarkets/Hypermarkets
- 11.3.3. Online Retail Stores
- 11.3.4. Other Distribution Channels
- 11.1. Market Analysis, Insights and Forecast - by Product Type
- 12. Competitive Analysis
- 12.1. Company Profiles
- 12.1.1 Adidas AG
- 12.1.1.1. Company Overview
- 12.1.1.2. Products
- 12.1.1.3. Company Financials
- 12.1.1.4. SWOT Analysis
- 12.1.2 Columbia Sportswear Company
- 12.1.2.1. Company Overview
- 12.1.2.2. Products
- 12.1.2.3. Company Financials
- 12.1.2.4. SWOT Analysis
- 12.1.3 VF Corporation
- 12.1.3.1. Company Overview
- 12.1.3.2. Products
- 12.1.3.3. Company Financials
- 12.1.3.4. SWOT Analysis
- 12.1.4 SKECHERS USA Inc
- 12.1.4.1. Company Overview
- 12.1.4.2. Products
- 12.1.4.3. Company Financials
- 12.1.4.4. SWOT Analysis
- 12.1.5 Asics Corporation
- 12.1.5.1. Company Overview
- 12.1.5.2. Products
- 12.1.5.3. Company Financials
- 12.1.5.4. SWOT Analysis
- 12.1.6 Puma SE
- 12.1.6.1. Company Overview
- 12.1.6.2. Products
- 12.1.6.3. Company Financials
- 12.1.6.4. SWOT Analysis
- 12.1.7 Under Armour Inc
- 12.1.7.1. Company Overview
- 12.1.7.2. Products
- 12.1.7.3. Company Financials
- 12.1.7.4. SWOT Analysis
- 12.1.8 Nike Inc
- 12.1.8.1. Company Overview
- 12.1.8.2. Products
- 12.1.8.3. Company Financials
- 12.1.8.4. SWOT Analysis
- 12.1.9 New Balance Athletics Inc
- 12.1.9.1. Company Overview
- 12.1.9.2. Products
- 12.1.9.3. Company Financials
- 12.1.9.4. SWOT Analysis
- 12.1.10 Fila
- 12.1.10.1. Company Overview
- 12.1.10.2. Products
- 12.1.10.3. Company Financials
- 12.1.10.4. SWOT Analysis
- 12.1.1 Adidas AG
- 12.2. Market Entropy
- 12.2.1 Company's Key Areas Served
- 12.2.2 Recent Developments
- 12.3. Company Market Share Analysis 2025
- 12.3.1 Top 5 Companies Market Share Analysis
- 12.3.2 Top 3 Companies Market Share Analysis
- 12.4. List of Potential Customers
- 13. Research Methodology
List of Figures
- Figure 1: Global Athletic Shoe Industry Revenue Breakdown (Million, %) by Region 2025 & 2033
- Figure 2: Global Athletic Shoe Industry Volume Breakdown (K Units, %) by Region 2025 & 2033
- Figure 3: North America Athletic Shoe Industry Revenue (Million), by Product Type 2025 & 2033
- Figure 4: North America Athletic Shoe Industry Volume (K Units), by Product Type 2025 & 2033
- Figure 5: North America Athletic Shoe Industry Revenue Share (%), by Product Type 2025 & 2033
- Figure 6: North America Athletic Shoe Industry Volume Share (%), by Product Type 2025 & 2033
- Figure 7: North America Athletic Shoe Industry Revenue (Million), by End User 2025 & 2033
- Figure 8: North America Athletic Shoe Industry Volume (K Units), by End User 2025 & 2033
- Figure 9: North America Athletic Shoe Industry Revenue Share (%), by End User 2025 & 2033
- Figure 10: North America Athletic Shoe Industry Volume Share (%), by End User 2025 & 2033
- Figure 11: North America Athletic Shoe Industry Revenue (Million), by Distribution Channel 2025 & 2033
- Figure 12: North America Athletic Shoe Industry Volume (K Units), by Distribution Channel 2025 & 2033
- Figure 13: North America Athletic Shoe Industry Revenue Share (%), by Distribution Channel 2025 & 2033
- Figure 14: North America Athletic Shoe Industry Volume Share (%), by Distribution Channel 2025 & 2033
- Figure 15: North America Athletic Shoe Industry Revenue (Million), by Country 2025 & 2033
- Figure 16: North America Athletic Shoe Industry Volume (K Units), by Country 2025 & 2033
- Figure 17: North America Athletic Shoe Industry Revenue Share (%), by Country 2025 & 2033
- Figure 18: North America Athletic Shoe Industry Volume Share (%), by Country 2025 & 2033
- Figure 19: Europe Athletic Shoe Industry Revenue (Million), by Product Type 2025 & 2033
- Figure 20: Europe Athletic Shoe Industry Volume (K Units), by Product Type 2025 & 2033
- Figure 21: Europe Athletic Shoe Industry Revenue Share (%), by Product Type 2025 & 2033
- Figure 22: Europe Athletic Shoe Industry Volume Share (%), by Product Type 2025 & 2033
- Figure 23: Europe Athletic Shoe Industry Revenue (Million), by End User 2025 & 2033
- Figure 24: Europe Athletic Shoe Industry Volume (K Units), by End User 2025 & 2033
- Figure 25: Europe Athletic Shoe Industry Revenue Share (%), by End User 2025 & 2033
- Figure 26: Europe Athletic Shoe Industry Volume Share (%), by End User 2025 & 2033
- Figure 27: Europe Athletic Shoe Industry Revenue (Million), by Distribution Channel 2025 & 2033
- Figure 28: Europe Athletic Shoe Industry Volume (K Units), by Distribution Channel 2025 & 2033
- Figure 29: Europe Athletic Shoe Industry Revenue Share (%), by Distribution Channel 2025 & 2033
- Figure 30: Europe Athletic Shoe Industry Volume Share (%), by Distribution Channel 2025 & 2033
- Figure 31: Europe Athletic Shoe Industry Revenue (Million), by Country 2025 & 2033
- Figure 32: Europe Athletic Shoe Industry Volume (K Units), by Country 2025 & 2033
- Figure 33: Europe Athletic Shoe Industry Revenue Share (%), by Country 2025 & 2033
- Figure 34: Europe Athletic Shoe Industry Volume Share (%), by Country 2025 & 2033
- Figure 35: Asia Pacific Athletic Shoe Industry Revenue (Million), by Product Type 2025 & 2033
- Figure 36: Asia Pacific Athletic Shoe Industry Volume (K Units), by Product Type 2025 & 2033
- Figure 37: Asia Pacific Athletic Shoe Industry Revenue Share (%), by Product Type 2025 & 2033
- Figure 38: Asia Pacific Athletic Shoe Industry Volume Share (%), by Product Type 2025 & 2033
- Figure 39: Asia Pacific Athletic Shoe Industry Revenue (Million), by End User 2025 & 2033
- Figure 40: Asia Pacific Athletic Shoe Industry Volume (K Units), by End User 2025 & 2033
- Figure 41: Asia Pacific Athletic Shoe Industry Revenue Share (%), by End User 2025 & 2033
- Figure 42: Asia Pacific Athletic Shoe Industry Volume Share (%), by End User 2025 & 2033
- Figure 43: Asia Pacific Athletic Shoe Industry Revenue (Million), by Distribution Channel 2025 & 2033
- Figure 44: Asia Pacific Athletic Shoe Industry Volume (K Units), by Distribution Channel 2025 & 2033
- Figure 45: Asia Pacific Athletic Shoe Industry Revenue Share (%), by Distribution Channel 2025 & 2033
- Figure 46: Asia Pacific Athletic Shoe Industry Volume Share (%), by Distribution Channel 2025 & 2033
- Figure 47: Asia Pacific Athletic Shoe Industry Revenue (Million), by Country 2025 & 2033
- Figure 48: Asia Pacific Athletic Shoe Industry Volume (K Units), by Country 2025 & 2033
- Figure 49: Asia Pacific Athletic Shoe Industry Revenue Share (%), by Country 2025 & 2033
- Figure 50: Asia Pacific Athletic Shoe Industry Volume Share (%), by Country 2025 & 2033
- Figure 51: South America Athletic Shoe Industry Revenue (Million), by Product Type 2025 & 2033
- Figure 52: South America Athletic Shoe Industry Volume (K Units), by Product Type 2025 & 2033
- Figure 53: South America Athletic Shoe Industry Revenue Share (%), by Product Type 2025 & 2033
- Figure 54: South America Athletic Shoe Industry Volume Share (%), by Product Type 2025 & 2033
- Figure 55: South America Athletic Shoe Industry Revenue (Million), by End User 2025 & 2033
- Figure 56: South America Athletic Shoe Industry Volume (K Units), by End User 2025 & 2033
- Figure 57: South America Athletic Shoe Industry Revenue Share (%), by End User 2025 & 2033
- Figure 58: South America Athletic Shoe Industry Volume Share (%), by End User 2025 & 2033
- Figure 59: South America Athletic Shoe Industry Revenue (Million), by Distribution Channel 2025 & 2033
- Figure 60: South America Athletic Shoe Industry Volume (K Units), by Distribution Channel 2025 & 2033
- Figure 61: South America Athletic Shoe Industry Revenue Share (%), by Distribution Channel 2025 & 2033
- Figure 62: South America Athletic Shoe Industry Volume Share (%), by Distribution Channel 2025 & 2033
- Figure 63: South America Athletic Shoe Industry Revenue (Million), by Country 2025 & 2033
- Figure 64: South America Athletic Shoe Industry Volume (K Units), by Country 2025 & 2033
- Figure 65: South America Athletic Shoe Industry Revenue Share (%), by Country 2025 & 2033
- Figure 66: South America Athletic Shoe Industry Volume Share (%), by Country 2025 & 2033
- Figure 67: Middle East and Africa Athletic Shoe Industry Revenue (Million), by Product Type 2025 & 2033
- Figure 68: Middle East and Africa Athletic Shoe Industry Volume (K Units), by Product Type 2025 & 2033
- Figure 69: Middle East and Africa Athletic Shoe Industry Revenue Share (%), by Product Type 2025 & 2033
- Figure 70: Middle East and Africa Athletic Shoe Industry Volume Share (%), by Product Type 2025 & 2033
- Figure 71: Middle East and Africa Athletic Shoe Industry Revenue (Million), by End User 2025 & 2033
- Figure 72: Middle East and Africa Athletic Shoe Industry Volume (K Units), by End User 2025 & 2033
- Figure 73: Middle East and Africa Athletic Shoe Industry Revenue Share (%), by End User 2025 & 2033
- Figure 74: Middle East and Africa Athletic Shoe Industry Volume Share (%), by End User 2025 & 2033
- Figure 75: Middle East and Africa Athletic Shoe Industry Revenue (Million), by Distribution Channel 2025 & 2033
- Figure 76: Middle East and Africa Athletic Shoe Industry Volume (K Units), by Distribution Channel 2025 & 2033
- Figure 77: Middle East and Africa Athletic Shoe Industry Revenue Share (%), by Distribution Channel 2025 & 2033
- Figure 78: Middle East and Africa Athletic Shoe Industry Volume Share (%), by Distribution Channel 2025 & 2033
- Figure 79: Middle East and Africa Athletic Shoe Industry Revenue (Million), by Country 2025 & 2033
- Figure 80: Middle East and Africa Athletic Shoe Industry Volume (K Units), by Country 2025 & 2033
- Figure 81: Middle East and Africa Athletic Shoe Industry Revenue Share (%), by Country 2025 & 2033
- Figure 82: Middle East and Africa Athletic Shoe Industry Volume Share (%), by Country 2025 & 2033
List of Tables
- Table 1: Global Athletic Shoe Industry Revenue Million Forecast, by Product Type 2020 & 2033
- Table 2: Global Athletic Shoe Industry Volume K Units Forecast, by Product Type 2020 & 2033
- Table 3: Global Athletic Shoe Industry Revenue Million Forecast, by End User 2020 & 2033
- Table 4: Global Athletic Shoe Industry Volume K Units Forecast, by End User 2020 & 2033
- Table 5: Global Athletic Shoe Industry Revenue Million Forecast, by Distribution Channel 2020 & 2033
- Table 6: Global Athletic Shoe Industry Volume K Units Forecast, by Distribution Channel 2020 & 2033
- Table 7: Global Athletic Shoe Industry Revenue Million Forecast, by Region 2020 & 2033
- Table 8: Global Athletic Shoe Industry Volume K Units Forecast, by Region 2020 & 2033
- Table 9: Global Athletic Shoe Industry Revenue Million Forecast, by Product Type 2020 & 2033
- Table 10: Global Athletic Shoe Industry Volume K Units Forecast, by Product Type 2020 & 2033
- Table 11: Global Athletic Shoe Industry Revenue Million Forecast, by End User 2020 & 2033
- Table 12: Global Athletic Shoe Industry Volume K Units Forecast, by End User 2020 & 2033
- Table 13: Global Athletic Shoe Industry Revenue Million Forecast, by Distribution Channel 2020 & 2033
- Table 14: Global Athletic Shoe Industry Volume K Units Forecast, by Distribution Channel 2020 & 2033
- Table 15: Global Athletic Shoe Industry Revenue Million Forecast, by Country 2020 & 2033
- Table 16: Global Athletic Shoe Industry Volume K Units Forecast, by Country 2020 & 2033
- Table 17: United States Athletic Shoe Industry Revenue (Million) Forecast, by Application 2020 & 2033
- Table 18: United States Athletic Shoe Industry Volume (K Units) Forecast, by Application 2020 & 2033
- Table 19: Canada Athletic Shoe Industry Revenue (Million) Forecast, by Application 2020 & 2033
- Table 20: Canada Athletic Shoe Industry Volume (K Units) Forecast, by Application 2020 & 2033
- Table 21: Mexico Athletic Shoe Industry Revenue (Million) Forecast, by Application 2020 & 2033
- Table 22: Mexico Athletic Shoe Industry Volume (K Units) Forecast, by Application 2020 & 2033
- Table 23: Rest of North America Athletic Shoe Industry Revenue (Million) Forecast, by Application 2020 & 2033
- Table 24: Rest of North America Athletic Shoe Industry Volume (K Units) Forecast, by Application 2020 & 2033
- Table 25: Global Athletic Shoe Industry Revenue Million Forecast, by Product Type 2020 & 2033
- Table 26: Global Athletic Shoe Industry Volume K Units Forecast, by Product Type 2020 & 2033
- Table 27: Global Athletic Shoe Industry Revenue Million Forecast, by End User 2020 & 2033
- Table 28: Global Athletic Shoe Industry Volume K Units Forecast, by End User 2020 & 2033
- Table 29: Global Athletic Shoe Industry Revenue Million Forecast, by Distribution Channel 2020 & 2033
- Table 30: Global Athletic Shoe Industry Volume K Units Forecast, by Distribution Channel 2020 & 2033
- Table 31: Global Athletic Shoe Industry Revenue Million Forecast, by Country 2020 & 2033
- Table 32: Global Athletic Shoe Industry Volume K Units Forecast, by Country 2020 & 2033
- Table 33: United Kingdom Athletic Shoe Industry Revenue (Million) Forecast, by Application 2020 & 2033
- Table 34: United Kingdom Athletic Shoe Industry Volume (K Units) Forecast, by Application 2020 & 2033
- Table 35: Germany Athletic Shoe Industry Revenue (Million) Forecast, by Application 2020 & 2033
- Table 36: Germany Athletic Shoe Industry Volume (K Units) Forecast, by Application 2020 & 2033
- Table 37: Spain Athletic Shoe Industry Revenue (Million) Forecast, by Application 2020 & 2033
- Table 38: Spain Athletic Shoe Industry Volume (K Units) Forecast, by Application 2020 & 2033
- Table 39: France Athletic Shoe Industry Revenue (Million) Forecast, by Application 2020 & 2033
- Table 40: France Athletic Shoe Industry Volume (K Units) Forecast, by Application 2020 & 2033
- Table 41: Italy Athletic Shoe Industry Revenue (Million) Forecast, by Application 2020 & 2033
- Table 42: Italy Athletic Shoe Industry Volume (K Units) Forecast, by Application 2020 & 2033
- Table 43: Netherlands Athletic Shoe Industry Revenue (Million) Forecast, by Application 2020 & 2033
- Table 44: Netherlands Athletic Shoe Industry Volume (K Units) Forecast, by Application 2020 & 2033
- Table 45: Rest of Europe Athletic Shoe Industry Revenue (Million) Forecast, by Application 2020 & 2033
- Table 46: Rest of Europe Athletic Shoe Industry Volume (K Units) Forecast, by Application 2020 & 2033
- Table 47: Global Athletic Shoe Industry Revenue Million Forecast, by Product Type 2020 & 2033
- Table 48: Global Athletic Shoe Industry Volume K Units Forecast, by Product Type 2020 & 2033
- Table 49: Global Athletic Shoe Industry Revenue Million Forecast, by End User 2020 & 2033
- Table 50: Global Athletic Shoe Industry Volume K Units Forecast, by End User 2020 & 2033
- Table 51: Global Athletic Shoe Industry Revenue Million Forecast, by Distribution Channel 2020 & 2033
- Table 52: Global Athletic Shoe Industry Volume K Units Forecast, by Distribution Channel 2020 & 2033
- Table 53: Global Athletic Shoe Industry Revenue Million Forecast, by Country 2020 & 2033
- Table 54: Global Athletic Shoe Industry Volume K Units Forecast, by Country 2020 & 2033
- Table 55: China Athletic Shoe Industry Revenue (Million) Forecast, by Application 2020 & 2033
- Table 56: China Athletic Shoe Industry Volume (K Units) Forecast, by Application 2020 & 2033
- Table 57: Japan Athletic Shoe Industry Revenue (Million) Forecast, by Application 2020 & 2033
- Table 58: Japan Athletic Shoe Industry Volume (K Units) Forecast, by Application 2020 & 2033
- Table 59: India Athletic Shoe Industry Revenue (Million) Forecast, by Application 2020 & 2033
- Table 60: India Athletic Shoe Industry Volume (K Units) Forecast, by Application 2020 & 2033
- Table 61: Australia Athletic Shoe Industry Revenue (Million) Forecast, by Application 2020 & 2033
- Table 62: Australia Athletic Shoe Industry Volume (K Units) Forecast, by Application 2020 & 2033
- Table 63: Rest of Asia Pacific Athletic Shoe Industry Revenue (Million) Forecast, by Application 2020 & 2033
- Table 64: Rest of Asia Pacific Athletic Shoe Industry Volume (K Units) Forecast, by Application 2020 & 2033
- Table 65: Global Athletic Shoe Industry Revenue Million Forecast, by Product Type 2020 & 2033
- Table 66: Global Athletic Shoe Industry Volume K Units Forecast, by Product Type 2020 & 2033
- Table 67: Global Athletic Shoe Industry Revenue Million Forecast, by End User 2020 & 2033
- Table 68: Global Athletic Shoe Industry Volume K Units Forecast, by End User 2020 & 2033
- Table 69: Global Athletic Shoe Industry Revenue Million Forecast, by Distribution Channel 2020 & 2033
- Table 70: Global Athletic Shoe Industry Volume K Units Forecast, by Distribution Channel 2020 & 2033
- Table 71: Global Athletic Shoe Industry Revenue Million Forecast, by Country 2020 & 2033
- Table 72: Global Athletic Shoe Industry Volume K Units Forecast, by Country 2020 & 2033
- Table 73: Brazil Athletic Shoe Industry Revenue (Million) Forecast, by Application 2020 & 2033
- Table 74: Brazil Athletic Shoe Industry Volume (K Units) Forecast, by Application 2020 & 2033
- Table 75: Argentina Athletic Shoe Industry Revenue (Million) Forecast, by Application 2020 & 2033
- Table 76: Argentina Athletic Shoe Industry Volume (K Units) Forecast, by Application 2020 & 2033
- Table 77: Rest of South America Athletic Shoe Industry Revenue (Million) Forecast, by Application 2020 & 2033
- Table 78: Rest of South America Athletic Shoe Industry Volume (K Units) Forecast, by Application 2020 & 2033
- Table 79: Global Athletic Shoe Industry Revenue Million Forecast, by Product Type 2020 & 2033
- Table 80: Global Athletic Shoe Industry Volume K Units Forecast, by Product Type 2020 & 2033
- Table 81: Global Athletic Shoe Industry Revenue Million Forecast, by End User 2020 & 2033
- Table 82: Global Athletic Shoe Industry Volume K Units Forecast, by End User 2020 & 2033
- Table 83: Global Athletic Shoe Industry Revenue Million Forecast, by Distribution Channel 2020 & 2033
- Table 84: Global Athletic Shoe Industry Volume K Units Forecast, by Distribution Channel 2020 & 2033
- Table 85: Global Athletic Shoe Industry Revenue Million Forecast, by Country 2020 & 2033
- Table 86: Global Athletic Shoe Industry Volume K Units Forecast, by Country 2020 & 2033
- Table 87: Saudi Arabia Athletic Shoe Industry Revenue (Million) Forecast, by Application 2020 & 2033
- Table 88: Saudi Arabia Athletic Shoe Industry Volume (K Units) Forecast, by Application 2020 & 2033
- Table 89: South Africa Athletic Shoe Industry Revenue (Million) Forecast, by Application 2020 & 2033
- Table 90: South Africa Athletic Shoe Industry Volume (K Units) Forecast, by Application 2020 & 2033
- Table 91: Rest of Middle East and Africa Athletic Shoe Industry Revenue (Million) Forecast, by Application 2020 & 2033
- Table 92: Rest of Middle East and Africa Athletic Shoe Industry Volume (K Units) Forecast, by Application 2020 & 2033
Frequently Asked Questions
1. What is the projected Compound Annual Growth Rate (CAGR) of the Athletic Shoe Industry?
The projected CAGR is approximately 6.86%.
2. Which companies are prominent players in the Athletic Shoe Industry?
Key companies in the market include Adidas AG, Columbia Sportswear Company, VF Corporation, SKECHERS USA Inc, Asics Corporation, Puma SE, Under Armour Inc, Nike Inc, New Balance Athletics Inc, Fila.
3. What are the main segments of the Athletic Shoe Industry?
The market segments include Product Type, End User, Distribution Channel.
4. Can you provide details about the market size?
The market size is estimated to be USD 173.89 Million as of 2022.
5. What are some drivers contributing to market growth?
Aggressive Marketing And Strategies By Brands; Enhanced Participation In Recreational And Outdoor/Sports Activities.
6. What are the notable trends driving market growth?
Growing Sports Participation and Influence of Athleisure.
7. Are there any restraints impacting market growth?
Unorganized Footwear Sector And Availability Of Counterfeit Goods.
8. Can you provide examples of recent developments in the market?
June 2024: Nike launched the Converse Run Star Trainer, a low-profile shoe built from the ground up, combining retro and modern aesthetics. The silhouette is inspired by Converse’s deep history in sport but designed for modern life.
9. What pricing options are available for accessing the report?
Pricing options include single-user, multi-user, and enterprise licenses priced at USD 4750, USD 5250, and USD 8750 respectively.
10. Is the market size provided in terms of value or volume?
The market size is provided in terms of value, measured in Million and volume, measured in K Units.
11. Are there any specific market keywords associated with the report?
Yes, the market keyword associated with the report is "Athletic Shoe Industry," which aids in identifying and referencing the specific market segment covered.
12. How do I determine which pricing option suits my needs best?
The pricing options vary based on user requirements and access needs. Individual users may opt for single-user licenses, while businesses requiring broader access may choose multi-user or enterprise licenses for cost-effective access to the report.
13. Are there any additional resources or data provided in the Athletic Shoe Industry report?
While the report offers comprehensive insights, it's advisable to review the specific contents or supplementary materials provided to ascertain if additional resources or data are available.
14. How can I stay updated on further developments or reports in the Athletic Shoe Industry?
To stay informed about further developments, trends, and reports in the Athletic Shoe Industry, consider subscribing to industry newsletters, following relevant companies and organizations, or regularly checking reputable industry news sources and publications.
Methodology
Step 1 - Identification of Relevant Samples Size from Population Database


Step 2 - Approaches for Defining Global Market Size (Value, Volume* & Price*)

Note*: In applicable scenarios
Step 3 - Data Sources
Primary Research
- Web Analytics
- Survey Reports
- Research Institute
- Latest Research Reports
- Opinion Leaders
Secondary Research
- Annual Reports
- White Paper
- Latest Press Release
- Industry Association
- Paid Database
- Investor Presentations

Step 4 - Data Triangulation
Involves using different sources of information in order to increase the validity of a study
These sources are likely to be stakeholders in a program - participants, other researchers, program staff, other community members, and so on.
Then we put all data in single framework & apply various statistical tools to find out the dynamic on the market.
During the analysis stage, feedback from the stakeholder groups would be compared to determine areas of agreement as well as areas of divergence