

Key Insights
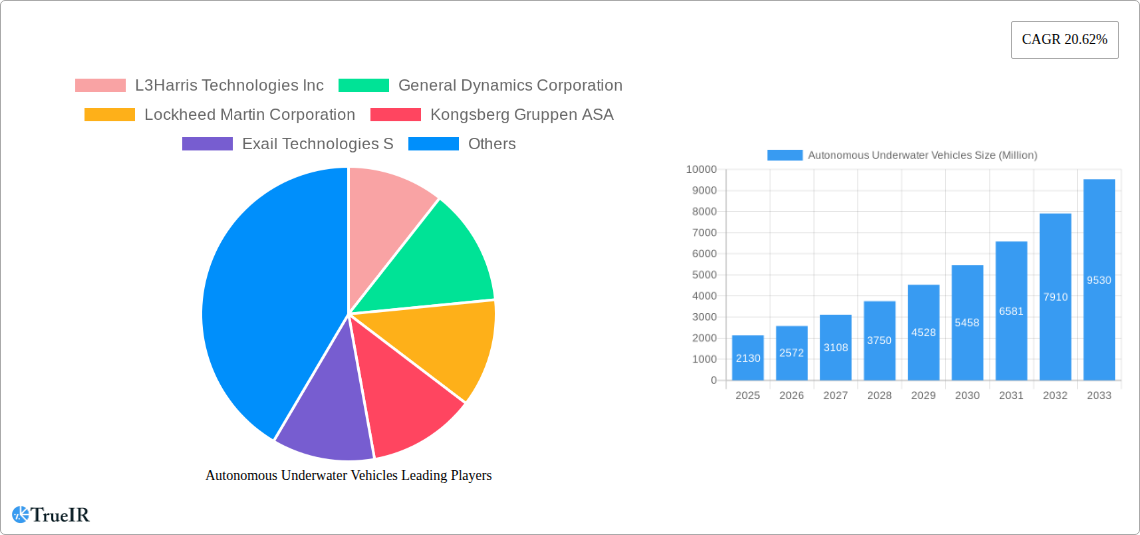
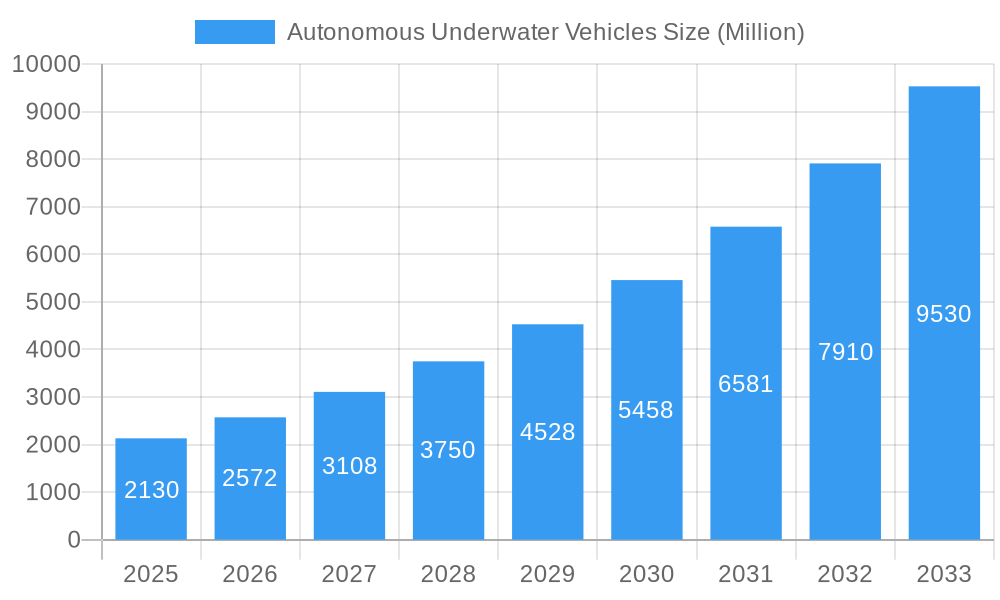
The Autonomous Underwater Vehicle (AUV) market is experiencing robust growth, projected to reach \$2.13 billion in 2025 and exhibiting a Compound Annual Growth Rate (CAGR) of 20.62% from 2025 to 2033. This expansion is driven by increasing demand across diverse sectors. Military and defense applications, leveraging AUVs for surveillance, mine countermeasures, and anti-submarine warfare, are a significant growth driver. The oil and gas industry utilizes AUVs for pipeline inspection, subsea infrastructure monitoring, and exploration, contributing substantially to market revenue. Furthermore, the burgeoning environmental protection and monitoring sector is adopting AUVs for tasks such as pollution detection, oceanographic research, and marine habitat mapping. The rising focus on sustainable practices and the need for precise underwater data collection fuels this segment's growth. Technological advancements, such as improved sensor technology, enhanced navigation systems, and longer operational endurance, are further propelling market expansion. The market is segmented by application (Military & Defense, Oil & Gas, Environment Protection & Monitoring, Oceanography, Archaeology & Exploration, Search & Salvage Operations) and by type (Small, Medium, Large), reflecting the diverse range of AUV applications and sizes catering to specific needs.
Autonomous Underwater Vehicles Market Size (In Billion)
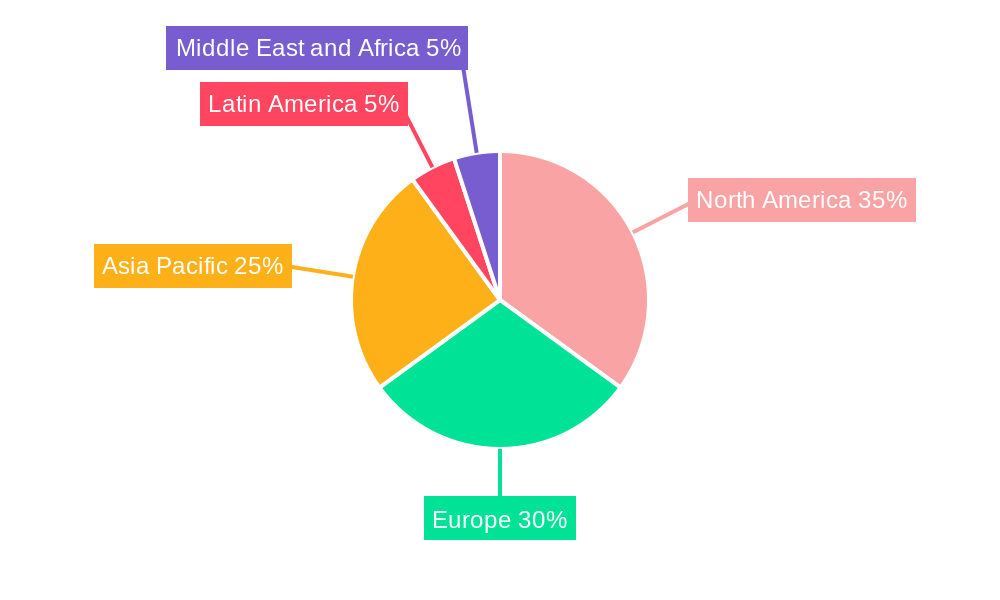
The geographical distribution of the AUV market shows strong regional variations. North America and Europe currently hold significant market share due to the presence of major technology developers and established defense industries. However, the Asia-Pacific region is expected to witness rapid growth in the coming years driven by increasing investments in infrastructure development and marine research within countries such as China, Japan, and South Korea. The Middle East and Africa region is also poised for growth, fueled by offshore oil and gas exploration activities. Competition in the AUV market is intense, with leading players such as L3Harris Technologies Inc, General Dynamics Corporation, Lockheed Martin Corporation, Kongsberg Gruppen ASA, and others constantly innovating and expanding their product portfolios to maintain their market position. This competitive landscape fosters innovation and drives the development of advanced AUV technologies, further accelerating market growth.
Autonomous Underwater Vehicles Company Market Share
Autonomous Underwater Vehicles (AUV) Market Report: 2019-2033
This comprehensive report provides an in-depth analysis of the Autonomous Underwater Vehicles (AUV) market, projecting a robust expansion driven by technological advancements and increasing demand across diverse sectors. The study covers the period 2019-2033, with a focus on the 2025-2033 forecast period and a detailed examination of the historical period (2019-2024). The market is valued at $XX Million in 2025 and is projected to reach $XX Million by 2033, exhibiting a CAGR of XX%.
Autonomous Underwater Vehicles Market Structure & Competitive Landscape
The AUV market exhibits a moderately consolidated structure, characterized by the presence of several key industry leaders alongside a growing number of specialized and emerging players. While a few major companies command significant market share, the landscape is dynamic, fueled by continuous technological innovation and strategic collaborations. The Herfindahl-Hirschman Index (HHI) is estimated at approximately XX, suggesting a relatively competitive environment where differentiation through advanced features and specialized solutions is crucial for success.
Key innovation drivers revolutionizing the AUV sector include rapid advancements in sensor technology, leading to more sophisticated data acquisition capabilities (e.g., high-resolution sonar, advanced imaging, chemical sensors). The seamless integration of Artificial Intelligence (AI) and Machine Learning (ML) algorithms is paramount for enabling enhanced autonomous navigation, real-time decision-making, and predictive maintenance. Furthermore, significant progress in battery technology is extending operational endurance and mission durations, reducing the frequency of deployments and associated costs.
Regulatory frameworks, particularly those governing data security, privacy, and comprehensive environmental impact assessments, are increasingly shaping market dynamics. Compliance with these regulations is becoming a critical factor for market entry and sustained operations. The competitive landscape is also influenced by the availability and cost-effectiveness of product substitutes, such as Remotely Operated Vehicles (ROVs) and traditional manned submersibles. While ROVs offer real-time human control and AUVs excel in autonomous, long-duration missions, and manned submersibles provide direct human presence, AUVs increasingly offer superior cost-efficiency, operational range, and safety for specific, often hazardous, underwater tasks.
The market is broadly segmented by:
- Application: Military & Defense (leading segment), Oil & Gas (significant and growing), Environment Protection & Monitoring (increasingly important), Oceanography, Archaeology & Exploration, and Search & Salvage Operations.
- Type: Small, Medium, and Large AUVs, each catering to distinct operational requirements and payload capacities.
Mergers and Acquisitions (M&A) activity has been a notable trend, with an estimated total volume of approximately XX deals between 2019 and 2024. These strategic maneuvers are primarily aimed at consolidating technological expertise, acquiring innovative intellectual property, expanding geographical reach, and enhancing vertical integration within the value chain.
- Market Concentration: HHI of approximately XX, indicating a competitive yet moderately consolidated market.
- M&A Volume (2019-2024): Approximately XX deals, reflecting strategic consolidation and capability enhancement.
- Key Innovation Drivers: AI/ML integration for advanced autonomy, cutting-edge sensor technology, breakthroughs in energy storage for extended battery life, and enhanced communication systems.
- Regulatory Impacts: Stringent data security protocols, comprehensive environmental impact assessments, and international maritime regulations.
Autonomous Underwater Vehicles Market Trends & Opportunities
The global AUV market is experiencing significant growth fueled by rising demand across diverse sectors. The military and defense sector is a major driver, with AUVs utilized for mine countermeasures, surveillance, and underwater infrastructure inspection. The oil and gas industry employs AUVs for pipeline inspection, subsea surveys, and exploration activities. Environmental monitoring and oceanographic research are also contributing factors to market expansion. Technological advancements such as improved navigation systems, enhanced sensor integration, and the development of more robust and reliable AUVs are driving market growth. Consumer preferences lean towards AUVs with longer operational endurance, increased payload capacity, and enhanced data processing capabilities. Competitive dynamics are shaped by technological innovation, strategic partnerships, and the ongoing quest for cost reduction. Market penetration rates vary across sectors, with higher adoption rates observed in the military and defense segment compared to others.
Dominant Markets & Segments in Autonomous Underwater Vehicles
The North American market currently holds the dominant position in the global AUV market, a leadership attributed to substantial government investments in defense and security, coupled with robust and ongoing exploration and production activities in the offshore oil and gas sector. This region's strong emphasis on research and development further bolsters its market leadership.
-
Leading Region: North America, driven by significant defense spending and extensive oil and gas exploration.
-
Key Growth Drivers (North America): Continued high military and defense spending, a well-established and expanding offshore oil and gas industry, significant government and private sector R&D investments, and increasing adoption in scientific research.
-
By Application:
- Military & Defense: Remains the largest market segment due to sustained demand for underwater surveillance, intelligence gathering, mine countermeasures, and anti-submarine warfare capabilities.
- Oil & Gas: Continues to be a significant growth driver, with an increasing need for efficient and safe subsea infrastructure inspection, maintenance, repair (IMR), and exploration activities.
- Environment Protection & Monitoring: Experiencing robust growth, with expanding adoption for critical tasks such as underwater habitat mapping, marine ecosystem health monitoring, pollution tracking, and climate change research.
-
By Type:
- Medium AUVs: Currently represent the largest and fastest-growing segment, offering an optimal balance between operational versatility, mission endurance, payload capacity, and cost-effectiveness for a wide array of applications.
Autonomous Underwater Vehicles Product Analysis
Recent advancements in AUV technology are fundamentally reshaping their operational capabilities and market penetration. A primary focus is on enhancing autonomy through sophisticated AI and ML algorithms, enabling AUVs to perform complex tasks with minimal human intervention, adapt to dynamic underwater environments, and make intelligent decisions in real-time. Improvements in sensor integration are providing AUVs with unparalleled data acquisition capabilities, from high-definition acoustic imaging and advanced optical sensors to environmental samplers and geophysical instruments. Furthermore, significant progress in energy storage solutions, including advanced battery chemistries and hybrid power systems, is dramatically increasing operational endurance and mission durations, allowing for longer deployments in remote and challenging underwater locations. Enhanced communication systems, incorporating acoustic modems and satellite uplinks, facilitate near real-time data transmission and remote monitoring. These synergistic advancements are not only expanding the range of applications for AUVs but also solidifying their competitive advantage over traditional underwater exploration and monitoring methods.
Key Drivers, Barriers & Challenges in Autonomous Underwater Vehicles
Key Drivers:
- Technological advancements in sensor technology, AI, and battery life.
- Increasing demand from the military & defense, oil & gas, and environmental sectors.
- Government initiatives and funding for oceanographic research and environmental monitoring.
Key Challenges:
- High initial investment costs of AUV systems and infrastructure.
- Potential supply chain disruptions impacting the availability of key components.
- Regulatory hurdles related to data security, environmental protection, and operational safety. This poses a $XX Million annual impact on market growth.
Growth Drivers in the Autonomous Underwater Vehicles Market
The Autonomous Underwater Vehicle (AUV) market is experiencing robust growth fueled by a confluence of factors. A primary driver is the escalating demand for effective underwater surveillance, security, and exploration across both defense and civilian sectors. Technological advancements, particularly in AI-driven autonomy, advanced sensor payloads, and improved operational endurance, are continuously enhancing AUV capabilities and making them more viable for complex missions. Furthermore, burgeoning government initiatives and international collaborations promoting oceanographic research, marine ecosystem monitoring, and sustainable resource management are providing significant impetus to market expansion. The increasing need for cost-effective and safe solutions for underwater infrastructure inspection and maintenance in industries like oil & gas and renewable energy also contributes substantially to market growth.
Challenges Impacting Autonomous Underwater Vehicles Growth
High development and operational costs, along with complex regulatory environments, pose significant challenges. Supply chain vulnerabilities and the need for skilled labor also hinder market expansion. Intense competition among established players further adds complexity.
Key Players Shaping the Autonomous Underwater Vehicles Market
Significant Autonomous Underwater Vehicles Industry Milestones
- July 2023: L3Harris Technologies Inc. achieved the first fully autonomous launch and recovery of an AUV from an underway submarine. This signifies a major step towards enhancing AUV operational efficiency and reducing reliance on surface support vessels.
- February 2024: Kongsberg secured a contract with the Defense Innovation Unit (DIU) to rapidly deliver HUGIN AUV capabilities for the US military. This highlights the growing demand for AUVs in defense applications and underscores the importance of rapid deployment capabilities.
Future Outlook for Autonomous Underwater Vehicles Market
The outlook for the Autonomous Underwater Vehicle (AUV) market remains exceptionally positive, with sustained growth projected for the foreseeable future. This expansion will be propelled by relentless technological innovation, including further advancements in AI for enhanced decision-making and swarm capabilities, miniaturization of sensors, and development of next-generation power sources for extended operational autonomy. The increasing adoption of AUVs across a wider spectrum of industries, beyond traditional defense and energy sectors, will be a key growth catalyst. Emerging applications in offshore renewable energy infrastructure (wind farms, tidal energy), deep-sea mining, advanced aquaculture monitoring, and scientific research will unlock new market opportunities. Supportive government policies promoting marine conservation, sustainable resource utilization, and national security, coupled with ongoing investments in oceanographic research, will continue to provide a favorable market environment. Industry players are expected to focus on developing highly specialized and interoperable AUV systems, fostering strategic partnerships, and expanding into emerging geographical markets to capitalize on these lucrative prospects.
Autonomous Underwater Vehicles Segmentation
- 1. Production Analysis
- 2. Consumption Analysis
- 3. Import Market Analysis (Value & Volume)
- 4. Export Market Analysis (Value & Volume)
- 5. Price Trend Analysis
Autonomous Underwater Vehicles Segmentation By Geography
-
1. North America
- 1.1. United States
- 1.2. Canada
- 1.3. Mexico
-
2. South America
- 2.1. Brazil
- 2.2. Argentina
- 2.3. Rest of South America
-
3. Europe
- 3.1. United Kingdom
- 3.2. Germany
- 3.3. France
- 3.4. Italy
- 3.5. Spain
- 3.6. Russia
- 3.7. Benelux
- 3.8. Nordics
- 3.9. Rest of Europe
-
4. Middle East & Africa
- 4.1. Turkey
- 4.2. Israel
- 4.3. GCC
- 4.4. North Africa
- 4.5. South Africa
- 4.6. Rest of Middle East & Africa
-
5. Asia Pacific
- 5.1. China
- 5.2. India
- 5.3. Japan
- 5.4. South Korea
- 5.5. ASEAN
- 5.6. Oceania
- 5.7. Rest of Asia Pacific
Autonomous Underwater Vehicles Regional Market Share
Geographic Coverage of Autonomous Underwater Vehicles
Autonomous Underwater Vehicles REPORT HIGHLIGHTS
| Aspects | Details |
|---|---|
| Study Period | 2020-2034 |
| Base Year | 2025 |
| Estimated Year | 2026 |
| Forecast Period | 2026-2034 |
| Historical Period | 2020-2025 |
| Growth Rate | CAGR of 20.62% from 2020-2034 |
| Segmentation |
|
Table of Contents
- 1. Introduction
- 1.1. Research Scope
- 1.2. Market Segmentation
- 1.3. Research Objective
- 1.4. Definitions and Assumptions
- 2. Executive Summary
- 2.1. Market Snapshot
- 3. Market Dynamics
- 3.1. Market Drivers
- 3.2. Market Restrains
- 3.3. Market Trends
- 3.4. Market Opportunities
- 4. Market Factor Analysis
- 4.1. Porters Five Forces
- 4.1.1. Bargaining Power of Suppliers
- 4.1.2. Bargaining Power of Buyers
- 4.1.3. Threat of New Entrants
- 4.1.4. Threat of Substitutes
- 4.1.5. Competitive Rivalry
- 4.2. PESTEL analysis
- 4.3. BCG Analysis
- 4.3.1. Stars (High Growth, High Market Share)
- 4.3.2. Cash Cows (Low Growth, High Market Share)
- 4.3.3. Question Mark (High Growth, Low Market Share)
- 4.3.4. Dogs (Low Growth, Low Market Share)
- 4.4. Ansoff Matrix Analysis
- 4.5. Supply Chain Analysis
- 4.6. Regulatory Landscape
- 4.7. Current Market Potential and Opportunity Assessment (TAM–SAM–SOM Framework)
- 4.8. TIR Analyst Note
- 4.1. Porters Five Forces
- 5. Market Analysis, Insights and Forecast 2021-2033
- 5.1. Market Analysis, Insights and Forecast - by Production Analysis
- 5.2. Market Analysis, Insights and Forecast - by Consumption Analysis
- 5.3. Market Analysis, Insights and Forecast - by Import Market Analysis (Value & Volume)
- 5.4. Market Analysis, Insights and Forecast - by Export Market Analysis (Value & Volume)
- 5.5. Market Analysis, Insights and Forecast - by Price Trend Analysis
- 5.6. Market Analysis, Insights and Forecast - by Region
- 5.6.1. North America
- 5.6.2. South America
- 5.6.3. Europe
- 5.6.4. Middle East & Africa
- 5.6.5. Asia Pacific
- 6. Global Autonomous Underwater Vehicles Analysis, Insights and Forecast, 2021-2033
- 6.1. Market Analysis, Insights and Forecast - by Production Analysis
- 6.2. Market Analysis, Insights and Forecast - by Consumption Analysis
- 6.3. Market Analysis, Insights and Forecast - by Import Market Analysis (Value & Volume)
- 6.4. Market Analysis, Insights and Forecast - by Export Market Analysis (Value & Volume)
- 6.5. Market Analysis, Insights and Forecast - by Price Trend Analysis
- 7. North America Autonomous Underwater Vehicles Analysis, Insights and Forecast, 2020-2032
- 7.1. Market Analysis, Insights and Forecast - by Production Analysis
- 7.2. Market Analysis, Insights and Forecast - by Consumption Analysis
- 7.3. Market Analysis, Insights and Forecast - by Import Market Analysis (Value & Volume)
- 7.4. Market Analysis, Insights and Forecast - by Export Market Analysis (Value & Volume)
- 7.5. Market Analysis, Insights and Forecast - by Price Trend Analysis
- 8. South America Autonomous Underwater Vehicles Analysis, Insights and Forecast, 2020-2032
- 8.1. Market Analysis, Insights and Forecast - by Production Analysis
- 8.2. Market Analysis, Insights and Forecast - by Consumption Analysis
- 8.3. Market Analysis, Insights and Forecast - by Import Market Analysis (Value & Volume)
- 8.4. Market Analysis, Insights and Forecast - by Export Market Analysis (Value & Volume)
- 8.5. Market Analysis, Insights and Forecast - by Price Trend Analysis
- 9. Europe Autonomous Underwater Vehicles Analysis, Insights and Forecast, 2020-2032
- 9.1. Market Analysis, Insights and Forecast - by Production Analysis
- 9.2. Market Analysis, Insights and Forecast - by Consumption Analysis
- 9.3. Market Analysis, Insights and Forecast - by Import Market Analysis (Value & Volume)
- 9.4. Market Analysis, Insights and Forecast - by Export Market Analysis (Value & Volume)
- 9.5. Market Analysis, Insights and Forecast - by Price Trend Analysis
- 10. Middle East & Africa Autonomous Underwater Vehicles Analysis, Insights and Forecast, 2020-2032
- 10.1. Market Analysis, Insights and Forecast - by Production Analysis
- 10.2. Market Analysis, Insights and Forecast - by Consumption Analysis
- 10.3. Market Analysis, Insights and Forecast - by Import Market Analysis (Value & Volume)
- 10.4. Market Analysis, Insights and Forecast - by Export Market Analysis (Value & Volume)
- 10.5. Market Analysis, Insights and Forecast - by Price Trend Analysis
- 11. Asia Pacific Autonomous Underwater Vehicles Analysis, Insights and Forecast, 2020-2032
- 11.1. Market Analysis, Insights and Forecast - by Production Analysis
- 11.2. Market Analysis, Insights and Forecast - by Consumption Analysis
- 11.3. Market Analysis, Insights and Forecast - by Import Market Analysis (Value & Volume)
- 11.4. Market Analysis, Insights and Forecast - by Export Market Analysis (Value & Volume)
- 11.5. Market Analysis, Insights and Forecast - by Price Trend Analysis
- 12. Competitive Analysis
- 12.1. Company Profiles
- 12.1.1 L3Harris Technologies Inc
- 12.1.1.1. Company Overview
- 12.1.1.2. Products
- 12.1.1.3. Company Financials
- 12.1.1.4. SWOT Analysis
- 12.1.2 General Dynamics Corporation
- 12.1.2.1. Company Overview
- 12.1.2.2. Products
- 12.1.2.3. Company Financials
- 12.1.2.4. SWOT Analysis
- 12.1.3 Lockheed Martin Corporation
- 12.1.3.1. Company Overview
- 12.1.3.2. Products
- 12.1.3.3. Company Financials
- 12.1.3.4. SWOT Analysis
- 12.1.4 Kongsberg Gruppen ASA
- 12.1.4.1. Company Overview
- 12.1.4.2. Products
- 12.1.4.3. Company Financials
- 12.1.4.4. SWOT Analysis
- 12.1.5 Exail Technologies S
- 12.1.5.1. Company Overview
- 12.1.5.2. Products
- 12.1.5.3. Company Financials
- 12.1.5.4. SWOT Analysis
- 12.1.6 SAAB AB
- 12.1.6.1. Company Overview
- 12.1.6.2. Products
- 12.1.6.3. Company Financials
- 12.1.6.4. SWOT Analysis
- 12.1.7 BAE Systems plc
- 12.1.7.1. Company Overview
- 12.1.7.2. Products
- 12.1.7.3. Company Financials
- 12.1.7.4. SWOT Analysis
- 12.1.8 Teledyne Technologies Inc
- 12.1.8.1. Company Overview
- 12.1.8.2. Products
- 12.1.8.3. Company Financials
- 12.1.8.4. SWOT Analysis
- 12.1.9 The Boeing Company
- 12.1.9.1. Company Overview
- 12.1.9.2. Products
- 12.1.9.3. Company Financials
- 12.1.9.4. SWOT Analysis
- 12.1.1 L3Harris Technologies Inc
- 12.2. Market Entropy
- 12.2.1 Company's Key Areas Served
- 12.2.2 Recent Developments
- 12.3. Company Market Share Analysis 2025
- 12.3.1 Top 5 Companies Market Share Analysis
- 12.3.2 Top 3 Companies Market Share Analysis
- 12.4. List of Potential Customers
- 13. Research Methodology
List of Figures
- Figure 1: Global Autonomous Underwater Vehicles Revenue Breakdown (billion, %) by Region 2025 & 2033
- Figure 2: North America Autonomous Underwater Vehicles Revenue (billion), by Production Analysis 2025 & 2033
- Figure 3: North America Autonomous Underwater Vehicles Revenue Share (%), by Production Analysis 2025 & 2033
- Figure 4: North America Autonomous Underwater Vehicles Revenue (billion), by Consumption Analysis 2025 & 2033
- Figure 5: North America Autonomous Underwater Vehicles Revenue Share (%), by Consumption Analysis 2025 & 2033
- Figure 6: North America Autonomous Underwater Vehicles Revenue (billion), by Import Market Analysis (Value & Volume) 2025 & 2033
- Figure 7: North America Autonomous Underwater Vehicles Revenue Share (%), by Import Market Analysis (Value & Volume) 2025 & 2033
- Figure 8: North America Autonomous Underwater Vehicles Revenue (billion), by Export Market Analysis (Value & Volume) 2025 & 2033
- Figure 9: North America Autonomous Underwater Vehicles Revenue Share (%), by Export Market Analysis (Value & Volume) 2025 & 2033
- Figure 10: North America Autonomous Underwater Vehicles Revenue (billion), by Price Trend Analysis 2025 & 2033
- Figure 11: North America Autonomous Underwater Vehicles Revenue Share (%), by Price Trend Analysis 2025 & 2033
- Figure 12: North America Autonomous Underwater Vehicles Revenue (billion), by Country 2025 & 2033
- Figure 13: North America Autonomous Underwater Vehicles Revenue Share (%), by Country 2025 & 2033
- Figure 14: South America Autonomous Underwater Vehicles Revenue (billion), by Production Analysis 2025 & 2033
- Figure 15: South America Autonomous Underwater Vehicles Revenue Share (%), by Production Analysis 2025 & 2033
- Figure 16: South America Autonomous Underwater Vehicles Revenue (billion), by Consumption Analysis 2025 & 2033
- Figure 17: South America Autonomous Underwater Vehicles Revenue Share (%), by Consumption Analysis 2025 & 2033
- Figure 18: South America Autonomous Underwater Vehicles Revenue (billion), by Import Market Analysis (Value & Volume) 2025 & 2033
- Figure 19: South America Autonomous Underwater Vehicles Revenue Share (%), by Import Market Analysis (Value & Volume) 2025 & 2033
- Figure 20: South America Autonomous Underwater Vehicles Revenue (billion), by Export Market Analysis (Value & Volume) 2025 & 2033
- Figure 21: South America Autonomous Underwater Vehicles Revenue Share (%), by Export Market Analysis (Value & Volume) 2025 & 2033
- Figure 22: South America Autonomous Underwater Vehicles Revenue (billion), by Price Trend Analysis 2025 & 2033
- Figure 23: South America Autonomous Underwater Vehicles Revenue Share (%), by Price Trend Analysis 2025 & 2033
- Figure 24: South America Autonomous Underwater Vehicles Revenue (billion), by Country 2025 & 2033
- Figure 25: South America Autonomous Underwater Vehicles Revenue Share (%), by Country 2025 & 2033
- Figure 26: Europe Autonomous Underwater Vehicles Revenue (billion), by Production Analysis 2025 & 2033
- Figure 27: Europe Autonomous Underwater Vehicles Revenue Share (%), by Production Analysis 2025 & 2033
- Figure 28: Europe Autonomous Underwater Vehicles Revenue (billion), by Consumption Analysis 2025 & 2033
- Figure 29: Europe Autonomous Underwater Vehicles Revenue Share (%), by Consumption Analysis 2025 & 2033
- Figure 30: Europe Autonomous Underwater Vehicles Revenue (billion), by Import Market Analysis (Value & Volume) 2025 & 2033
- Figure 31: Europe Autonomous Underwater Vehicles Revenue Share (%), by Import Market Analysis (Value & Volume) 2025 & 2033
- Figure 32: Europe Autonomous Underwater Vehicles Revenue (billion), by Export Market Analysis (Value & Volume) 2025 & 2033
- Figure 33: Europe Autonomous Underwater Vehicles Revenue Share (%), by Export Market Analysis (Value & Volume) 2025 & 2033
- Figure 34: Europe Autonomous Underwater Vehicles Revenue (billion), by Price Trend Analysis 2025 & 2033
- Figure 35: Europe Autonomous Underwater Vehicles Revenue Share (%), by Price Trend Analysis 2025 & 2033
- Figure 36: Europe Autonomous Underwater Vehicles Revenue (billion), by Country 2025 & 2033
- Figure 37: Europe Autonomous Underwater Vehicles Revenue Share (%), by Country 2025 & 2033
- Figure 38: Middle East & Africa Autonomous Underwater Vehicles Revenue (billion), by Production Analysis 2025 & 2033
- Figure 39: Middle East & Africa Autonomous Underwater Vehicles Revenue Share (%), by Production Analysis 2025 & 2033
- Figure 40: Middle East & Africa Autonomous Underwater Vehicles Revenue (billion), by Consumption Analysis 2025 & 2033
- Figure 41: Middle East & Africa Autonomous Underwater Vehicles Revenue Share (%), by Consumption Analysis 2025 & 2033
- Figure 42: Middle East & Africa Autonomous Underwater Vehicles Revenue (billion), by Import Market Analysis (Value & Volume) 2025 & 2033
- Figure 43: Middle East & Africa Autonomous Underwater Vehicles Revenue Share (%), by Import Market Analysis (Value & Volume) 2025 & 2033
- Figure 44: Middle East & Africa Autonomous Underwater Vehicles Revenue (billion), by Export Market Analysis (Value & Volume) 2025 & 2033
- Figure 45: Middle East & Africa Autonomous Underwater Vehicles Revenue Share (%), by Export Market Analysis (Value & Volume) 2025 & 2033
- Figure 46: Middle East & Africa Autonomous Underwater Vehicles Revenue (billion), by Price Trend Analysis 2025 & 2033
- Figure 47: Middle East & Africa Autonomous Underwater Vehicles Revenue Share (%), by Price Trend Analysis 2025 & 2033
- Figure 48: Middle East & Africa Autonomous Underwater Vehicles Revenue (billion), by Country 2025 & 2033
- Figure 49: Middle East & Africa Autonomous Underwater Vehicles Revenue Share (%), by Country 2025 & 2033
- Figure 50: Asia Pacific Autonomous Underwater Vehicles Revenue (billion), by Production Analysis 2025 & 2033
- Figure 51: Asia Pacific Autonomous Underwater Vehicles Revenue Share (%), by Production Analysis 2025 & 2033
- Figure 52: Asia Pacific Autonomous Underwater Vehicles Revenue (billion), by Consumption Analysis 2025 & 2033
- Figure 53: Asia Pacific Autonomous Underwater Vehicles Revenue Share (%), by Consumption Analysis 2025 & 2033
- Figure 54: Asia Pacific Autonomous Underwater Vehicles Revenue (billion), by Import Market Analysis (Value & Volume) 2025 & 2033
- Figure 55: Asia Pacific Autonomous Underwater Vehicles Revenue Share (%), by Import Market Analysis (Value & Volume) 2025 & 2033
- Figure 56: Asia Pacific Autonomous Underwater Vehicles Revenue (billion), by Export Market Analysis (Value & Volume) 2025 & 2033
- Figure 57: Asia Pacific Autonomous Underwater Vehicles Revenue Share (%), by Export Market Analysis (Value & Volume) 2025 & 2033
- Figure 58: Asia Pacific Autonomous Underwater Vehicles Revenue (billion), by Price Trend Analysis 2025 & 2033
- Figure 59: Asia Pacific Autonomous Underwater Vehicles Revenue Share (%), by Price Trend Analysis 2025 & 2033
- Figure 60: Asia Pacific Autonomous Underwater Vehicles Revenue (billion), by Country 2025 & 2033
- Figure 61: Asia Pacific Autonomous Underwater Vehicles Revenue Share (%), by Country 2025 & 2033
List of Tables
- Table 1: Global Autonomous Underwater Vehicles Revenue billion Forecast, by Production Analysis 2020 & 2033
- Table 2: Global Autonomous Underwater Vehicles Revenue billion Forecast, by Consumption Analysis 2020 & 2033
- Table 3: Global Autonomous Underwater Vehicles Revenue billion Forecast, by Import Market Analysis (Value & Volume) 2020 & 2033
- Table 4: Global Autonomous Underwater Vehicles Revenue billion Forecast, by Export Market Analysis (Value & Volume) 2020 & 2033
- Table 5: Global Autonomous Underwater Vehicles Revenue billion Forecast, by Price Trend Analysis 2020 & 2033
- Table 6: Global Autonomous Underwater Vehicles Revenue billion Forecast, by Region 2020 & 2033
- Table 7: Global Autonomous Underwater Vehicles Revenue billion Forecast, by Production Analysis 2020 & 2033
- Table 8: Global Autonomous Underwater Vehicles Revenue billion Forecast, by Consumption Analysis 2020 & 2033
- Table 9: Global Autonomous Underwater Vehicles Revenue billion Forecast, by Import Market Analysis (Value & Volume) 2020 & 2033
- Table 10: Global Autonomous Underwater Vehicles Revenue billion Forecast, by Export Market Analysis (Value & Volume) 2020 & 2033
- Table 11: Global Autonomous Underwater Vehicles Revenue billion Forecast, by Price Trend Analysis 2020 & 2033
- Table 12: Global Autonomous Underwater Vehicles Revenue billion Forecast, by Country 2020 & 2033
- Table 13: United States Autonomous Underwater Vehicles Revenue (billion) Forecast, by Application 2020 & 2033
- Table 14: Canada Autonomous Underwater Vehicles Revenue (billion) Forecast, by Application 2020 & 2033
- Table 15: Mexico Autonomous Underwater Vehicles Revenue (billion) Forecast, by Application 2020 & 2033
- Table 16: Global Autonomous Underwater Vehicles Revenue billion Forecast, by Production Analysis 2020 & 2033
- Table 17: Global Autonomous Underwater Vehicles Revenue billion Forecast, by Consumption Analysis 2020 & 2033
- Table 18: Global Autonomous Underwater Vehicles Revenue billion Forecast, by Import Market Analysis (Value & Volume) 2020 & 2033
- Table 19: Global Autonomous Underwater Vehicles Revenue billion Forecast, by Export Market Analysis (Value & Volume) 2020 & 2033
- Table 20: Global Autonomous Underwater Vehicles Revenue billion Forecast, by Price Trend Analysis 2020 & 2033
- Table 21: Global Autonomous Underwater Vehicles Revenue billion Forecast, by Country 2020 & 2033
- Table 22: Brazil Autonomous Underwater Vehicles Revenue (billion) Forecast, by Application 2020 & 2033
- Table 23: Argentina Autonomous Underwater Vehicles Revenue (billion) Forecast, by Application 2020 & 2033
- Table 24: Rest of South America Autonomous Underwater Vehicles Revenue (billion) Forecast, by Application 2020 & 2033
- Table 25: Global Autonomous Underwater Vehicles Revenue billion Forecast, by Production Analysis 2020 & 2033
- Table 26: Global Autonomous Underwater Vehicles Revenue billion Forecast, by Consumption Analysis 2020 & 2033
- Table 27: Global Autonomous Underwater Vehicles Revenue billion Forecast, by Import Market Analysis (Value & Volume) 2020 & 2033
- Table 28: Global Autonomous Underwater Vehicles Revenue billion Forecast, by Export Market Analysis (Value & Volume) 2020 & 2033
- Table 29: Global Autonomous Underwater Vehicles Revenue billion Forecast, by Price Trend Analysis 2020 & 2033
- Table 30: Global Autonomous Underwater Vehicles Revenue billion Forecast, by Country 2020 & 2033
- Table 31: United Kingdom Autonomous Underwater Vehicles Revenue (billion) Forecast, by Application 2020 & 2033
- Table 32: Germany Autonomous Underwater Vehicles Revenue (billion) Forecast, by Application 2020 & 2033
- Table 33: France Autonomous Underwater Vehicles Revenue (billion) Forecast, by Application 2020 & 2033
- Table 34: Italy Autonomous Underwater Vehicles Revenue (billion) Forecast, by Application 2020 & 2033
- Table 35: Spain Autonomous Underwater Vehicles Revenue (billion) Forecast, by Application 2020 & 2033
- Table 36: Russia Autonomous Underwater Vehicles Revenue (billion) Forecast, by Application 2020 & 2033
- Table 37: Benelux Autonomous Underwater Vehicles Revenue (billion) Forecast, by Application 2020 & 2033
- Table 38: Nordics Autonomous Underwater Vehicles Revenue (billion) Forecast, by Application 2020 & 2033
- Table 39: Rest of Europe Autonomous Underwater Vehicles Revenue (billion) Forecast, by Application 2020 & 2033
- Table 40: Global Autonomous Underwater Vehicles Revenue billion Forecast, by Production Analysis 2020 & 2033
- Table 41: Global Autonomous Underwater Vehicles Revenue billion Forecast, by Consumption Analysis 2020 & 2033
- Table 42: Global Autonomous Underwater Vehicles Revenue billion Forecast, by Import Market Analysis (Value & Volume) 2020 & 2033
- Table 43: Global Autonomous Underwater Vehicles Revenue billion Forecast, by Export Market Analysis (Value & Volume) 2020 & 2033
- Table 44: Global Autonomous Underwater Vehicles Revenue billion Forecast, by Price Trend Analysis 2020 & 2033
- Table 45: Global Autonomous Underwater Vehicles Revenue billion Forecast, by Country 2020 & 2033
- Table 46: Turkey Autonomous Underwater Vehicles Revenue (billion) Forecast, by Application 2020 & 2033
- Table 47: Israel Autonomous Underwater Vehicles Revenue (billion) Forecast, by Application 2020 & 2033
- Table 48: GCC Autonomous Underwater Vehicles Revenue (billion) Forecast, by Application 2020 & 2033
- Table 49: North Africa Autonomous Underwater Vehicles Revenue (billion) Forecast, by Application 2020 & 2033
- Table 50: South Africa Autonomous Underwater Vehicles Revenue (billion) Forecast, by Application 2020 & 2033
- Table 51: Rest of Middle East & Africa Autonomous Underwater Vehicles Revenue (billion) Forecast, by Application 2020 & 2033
- Table 52: Global Autonomous Underwater Vehicles Revenue billion Forecast, by Production Analysis 2020 & 2033
- Table 53: Global Autonomous Underwater Vehicles Revenue billion Forecast, by Consumption Analysis 2020 & 2033
- Table 54: Global Autonomous Underwater Vehicles Revenue billion Forecast, by Import Market Analysis (Value & Volume) 2020 & 2033
- Table 55: Global Autonomous Underwater Vehicles Revenue billion Forecast, by Export Market Analysis (Value & Volume) 2020 & 2033
- Table 56: Global Autonomous Underwater Vehicles Revenue billion Forecast, by Price Trend Analysis 2020 & 2033
- Table 57: Global Autonomous Underwater Vehicles Revenue billion Forecast, by Country 2020 & 2033
- Table 58: China Autonomous Underwater Vehicles Revenue (billion) Forecast, by Application 2020 & 2033
- Table 59: India Autonomous Underwater Vehicles Revenue (billion) Forecast, by Application 2020 & 2033
- Table 60: Japan Autonomous Underwater Vehicles Revenue (billion) Forecast, by Application 2020 & 2033
- Table 61: South Korea Autonomous Underwater Vehicles Revenue (billion) Forecast, by Application 2020 & 2033
- Table 62: ASEAN Autonomous Underwater Vehicles Revenue (billion) Forecast, by Application 2020 & 2033
- Table 63: Oceania Autonomous Underwater Vehicles Revenue (billion) Forecast, by Application 2020 & 2033
- Table 64: Rest of Asia Pacific Autonomous Underwater Vehicles Revenue (billion) Forecast, by Application 2020 & 2033
Frequently Asked Questions
1. What is the projected Compound Annual Growth Rate (CAGR) of the Autonomous Underwater Vehicles?
The projected CAGR is approximately 20.62%.
2. Which companies are prominent players in the Autonomous Underwater Vehicles?
Key companies in the market include L3Harris Technologies Inc, General Dynamics Corporation, Lockheed Martin Corporation, Kongsberg Gruppen ASA, Exail Technologies S, SAAB AB, BAE Systems plc, Teledyne Technologies Inc, The Boeing Company.
3. What are the main segments of the Autonomous Underwater Vehicles?
The market segments include Production Analysis, Consumption Analysis, Import Market Analysis (Value & Volume), Export Market Analysis (Value & Volume), Price Trend Analysis.
4. Can you provide details about the market size?
The market size is estimated to be USD 2.57 billion as of 2022.
5. What are some drivers contributing to market growth?
Increase in Internet of Things (IoT) and Autonomous Systems; Rise in Demand for Military and Defense Satellite Communication Solutions.
6. What are the notable trends driving market growth?
Military & Defense will a Hold Significant Market Share.
7. Are there any restraints impacting market growth?
Cybersecurity Threats to Satellite Communication; Interference in Transmission of Data.
8. Can you provide examples of recent developments in the market?
February 2024: Kongsberg was awarded a contract with the Defense Innovation Unit (DIU) to rapidly deliver HUGIN Autonomous Underwater Vehicle (AUV) capabilities for the US military.
9. What pricing options are available for accessing the report?
Pricing options include single-user, multi-user, and enterprise licenses priced at USD 4750, USD 5250, and USD 8750 respectively.
10. Is the market size provided in terms of value or volume?
The market size is provided in terms of value, measured in billion.
11. Are there any specific market keywords associated with the report?
Yes, the market keyword associated with the report is "Autonomous Underwater Vehicles," which aids in identifying and referencing the specific market segment covered.
12. How do I determine which pricing option suits my needs best?
The pricing options vary based on user requirements and access needs. Individual users may opt for single-user licenses, while businesses requiring broader access may choose multi-user or enterprise licenses for cost-effective access to the report.
13. Are there any additional resources or data provided in the Autonomous Underwater Vehicles report?
While the report offers comprehensive insights, it's advisable to review the specific contents or supplementary materials provided to ascertain if additional resources or data are available.
14. How can I stay updated on further developments or reports in the Autonomous Underwater Vehicles?
To stay informed about further developments, trends, and reports in the Autonomous Underwater Vehicles, consider subscribing to industry newsletters, following relevant companies and organizations, or regularly checking reputable industry news sources and publications.
Methodology
Step 1 - Identification of Relevant Samples Size from Population Database


Step 2 - Approaches for Defining Global Market Size (Value, Volume* & Price*)

Note*: In applicable scenarios
Step 3 - Data Sources
Primary Research
- Web Analytics
- Survey Reports
- Research Institute
- Latest Research Reports
- Opinion Leaders
Secondary Research
- Annual Reports
- White Paper
- Latest Press Release
- Industry Association
- Paid Database
- Investor Presentations

Step 4 - Data Triangulation
Involves using different sources of information in order to increase the validity of a study
These sources are likely to be stakeholders in a program - participants, other researchers, program staff, other community members, and so on.
Then we put all data in single framework & apply various statistical tools to find out the dynamic on the market.
During the analysis stage, feedback from the stakeholder groups would be compared to determine areas of agreement as well as areas of divergence