

Key Insights
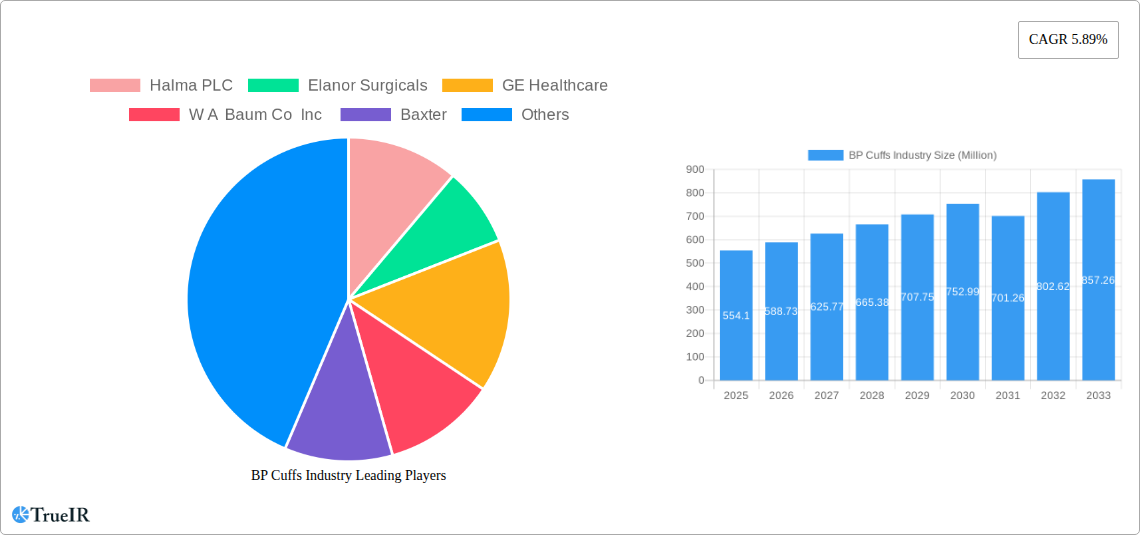
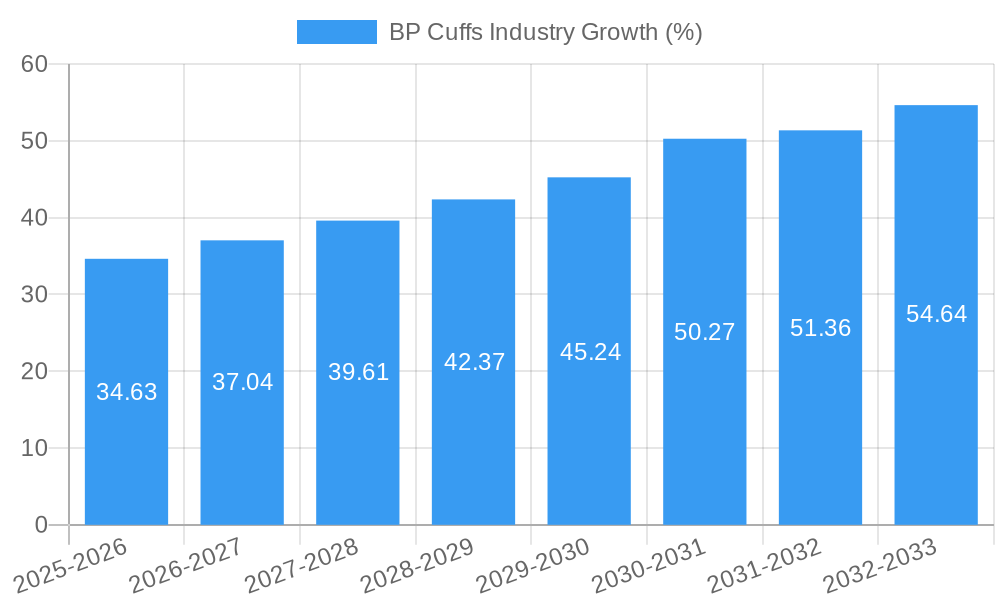
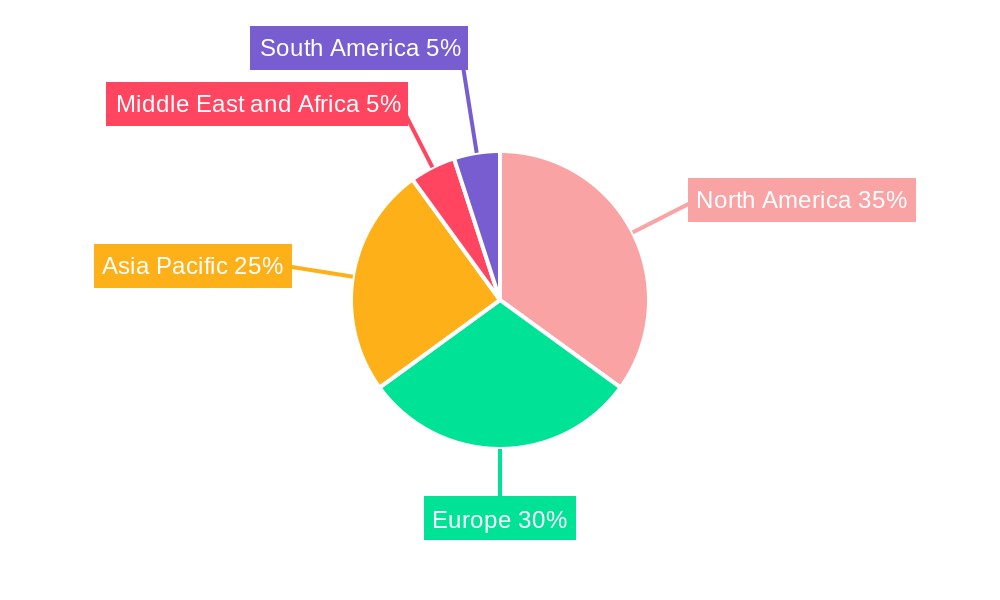
The global blood pressure (BP) cuffs market, valued at $554.10 million in 2025, is projected to experience robust growth, driven by a rising prevalence of hypertension globally and an increasing aging population requiring regular BP monitoring. This necessitates greater demand for both reusable and disposable cuffs across diverse healthcare settings, including hospitals, clinics, and home-use. Technological advancements towards automated BP cuffs, offering greater accuracy and ease of use, are further fueling market expansion. The market is segmented by end-user (hospitals, clinics, and other end-users), usage type (reusable and disposable), and product type (manual and automated). While the reusable segment currently holds a larger market share, disposable cuffs are gaining traction due to convenience and hygiene considerations. This growth is expected across all regions, with North America and Europe maintaining significant market dominance owing to advanced healthcare infrastructure and high adoption rates of technologically advanced BP monitoring devices. However, the Asia-Pacific region demonstrates substantial growth potential due to increasing healthcare expenditure and rising awareness of hypertension. Market restraints include the potential for pricing pressures from generic manufacturers and the relatively low cost of manual BP cuffs. However, ongoing technological innovation and increasing demand for accurate and reliable monitoring are likely to offset these challenges.
The competitive landscape is characterized by a mix of established players like GE Healthcare, Omron Healthcare, and Philips, alongside smaller, specialized manufacturers. These companies are focusing on product innovation, strategic partnerships, and geographic expansion to secure market share. The forecast period (2025-2033) anticipates a continued rise in market value, driven by factors mentioned above. Strategic acquisitions and the integration of advanced technologies into BP cuffs, such as wireless connectivity and data integration with electronic health records, are expected to shape the future market landscape. The market will continue to be influenced by regulatory approvals, reimbursement policies, and technological breakthroughs impacting accuracy and ease of use for both healthcare professionals and patients.
Dynamic BP Cuffs Industry Report: 2019-2033
This comprehensive report provides a detailed analysis of the global BP Cuffs industry, offering invaluable insights for stakeholders across the value chain. Leveraging extensive market research conducted over the study period (2019-2024) and incorporating forecast data (2025-2033), this report paints a clear picture of current market dynamics and future growth trajectories. The base year for this analysis is 2025. The report projects a market size of xx Million by 2033, with a Compound Annual Growth Rate (CAGR) of xx% during the forecast period.
BP Cuffs Industry Market Structure & Competitive Landscape
The global BP Cuffs market exhibits a moderately concentrated structure, with key players holding significant market share. The industry is characterized by a mix of established multinational corporations and specialized manufacturers. The top 10 companies – Halma PLC, Elanor Surgicals, GE Healthcare, W A Baum Co Inc, Baxter, Spengler SAS, Cardinal Health, Koninklijke Philips NV, Omron Healthcare Inc, and Spacelabs Healthcare – collectively account for approximately xx% of the global market share in 2025. American Diagnostic Corporation and Medline Industries Inc. also hold significant positions within the market.
Innovation Drivers: Continuous technological advancements, particularly in automated and digital blood pressure monitoring systems, are driving market growth. The integration of smart features, wireless connectivity, and data analytics capabilities enhances the user experience and creates new opportunities.
Regulatory Impacts: Stringent regulatory approvals and quality control standards influence the manufacturing and distribution of BP cuffs globally. Compliance with these regulations impacts market entry and operational costs.
Product Substitutes: While there are few direct substitutes for BP cuffs, alternative blood pressure measurement technologies, such as oscillometric devices and fingertip monitors, pose some competitive pressure.
End-User Segmentation: The market is segmented by end-user into hospitals, clinics, and other end-users (home use, etc.). Hospitals and clinics represent the largest market segment, driven by high patient volume and the need for accurate and reliable BP measurements. The "other end users" segment is experiencing rapid growth due to increasing awareness of hypertension and the rising adoption of home monitoring devices.
M&A Trends: The BP Cuffs industry has witnessed a moderate level of mergers and acquisitions activity in recent years. Consolidation efforts are aimed at expanding product portfolios, enhancing market reach, and securing technology advantages. The total value of M&A transactions during the historical period (2019-2024) was approximately xx Million.
BP Cuffs Industry Market Trends & Opportunities
The global BP Cuffs market is experiencing robust growth, driven by several key factors. The rising prevalence of hypertension globally presents a significant market opportunity, as accurate blood pressure monitoring becomes increasingly crucial for both diagnosis and management. Technological advancements, such as the development of wireless, smartphone-integrated devices, are driving market penetration. Consumer preferences are shifting towards user-friendly, accurate, and portable devices, presenting opportunities for companies to develop innovative product offerings. The growing demand for home healthcare solutions and remote patient monitoring further contributes to market expansion. The market witnessed a significant increase in demand for disposable cuffs, driven by infection control concerns and convenience.
Technological shifts toward automated and digital devices are significantly impacting the market, as these systems offer improved accuracy, ease of use, and data integration capabilities. The market penetration of automated BP cuffs is xx% in 2025, and this is expected to grow significantly by 2033. This growth is driven by the increasing preference for convenient and user-friendly devices among healthcare professionals and consumers. Competitive dynamics are shaped by innovation, pricing strategies, and brand recognition. The market demonstrates a healthy competitive landscape, with key players constantly striving for product differentiation and market share expansion.
Dominant Markets & Segments in BP Cuffs Industry
The North American region holds the dominant position in the global BP Cuffs market, driven by factors such as advanced healthcare infrastructure, high prevalence of hypertension, and strong consumer demand for healthcare technology. Within North America, the United States represents the largest national market.
Key Growth Drivers:
- Developed Healthcare Infrastructure: Well-established healthcare systems facilitate the adoption of advanced BP monitoring technology.
- High Prevalence of Hypertension: A significant portion of the population suffers from hypertension, creating a large demand for BP cuffs.
- Reimbursement Policies: Favorable insurance coverage and reimbursement policies for diagnostic tools positively impact market growth.
- Technological Advancements: Continuous product innovation drives consumer adoption and market expansion.
Dominant Segments:
- End User: Hospitals remain the largest segment due to high volume and stringent quality requirements.
- Usage: Disposable cuffs are gaining traction due to hygiene concerns and convenience.
- Product Type: Automated BP cuffs are growing rapidly due to ease of use and improved accuracy.
Europe and Asia Pacific also represent significant market opportunities, driven by factors such as rising healthcare expenditure and increasing awareness of cardiovascular health. However, the penetration rate of automated BP cuffs in these regions is still comparatively lower than in North America.
BP Cuffs Industry Product Analysis
The BP cuffs market offers a diverse range of products, including manual, automated, and digital devices. Manual cuffs remain prevalent in certain settings due to their simplicity and lower cost, while automated cuffs are gaining popularity owing to their improved accuracy and ease of use. Digital cuffs integrate advanced features, such as data storage and connectivity, enhancing convenience and facilitating remote patient monitoring. The competitive advantage lies in providing accurate, user-friendly, and technologically advanced devices that cater to the specific needs of different user segments. Recent innovations focus on smaller, more comfortable cuff designs, improved accuracy algorithms, and integration with mobile health applications.
Key Drivers, Barriers & Challenges in BP Cuffs Industry
Key Drivers:
The rising prevalence of hypertension, technological advancements driving greater accuracy and convenience, increasing demand for home healthcare solutions, favorable reimbursement policies in developed countries, and regulatory approvals for advanced technologies all contribute to market growth.
Challenges and Restraints:
Intense competition among manufacturers, stringent regulatory approvals impacting time to market, and the potential for supply chain disruptions due to component shortages represent key challenges. Furthermore, the price sensitivity of certain market segments can limit growth potential for premium-priced devices. These factors can collectively reduce market profitability and growth.
Growth Drivers in the BP Cuffs Industry Market
Technological innovation, the increasing prevalence of hypertension, expansion of home healthcare, and government initiatives supporting preventative healthcare are key growth drivers for this market. This includes not only the introduction of more accurate and user-friendly devices, but also the integration of smart functionalities and data analytics capabilities.
Challenges Impacting BP Cuffs Industry Growth
Stringent regulatory requirements, the dependence on a complex supply chain, price sensitivity in certain markets, and the potential for substitution by alternative blood pressure monitoring technologies pose challenges to industry growth. The costs associated with regulatory compliance and supply chain management can impact overall profitability.
Key Players Shaping the BP Cuffs Industry Market
- Halma PLC
- Elanor Surgicals
- GE Healthcare
- W A Baum Co Inc
- Baxter
- Spengler SAS
- Cardinal Health
- Koninklijke Philips NV
- Omron Healthcare Inc
- Spacelabs Healthcare
- American Diagnostic Corporation
- Medline Industries Inc
Significant BP Cuffs Industry Milestones
- September 2022: Garmin launched a smart blood pressure monitor with adjustable cuffs, enabling home and on-the-go blood pressure measurement. This launch highlights the trend towards consumer-focused, portable devices.
- February 2022: Inbody introduced the BP 170 one-touch automatic blood pressure cuff monitor, emphasizing the convenience and self-monitoring capabilities of advanced devices. This signifies the growing preference for user-friendly, automated solutions in the market.
Future Outlook for BP Cuffs Industry Market
The BP Cuffs market is poised for continued growth, fueled by technological advancements, increasing prevalence of hypertension, and the expanding home healthcare sector. Strategic opportunities lie in developing innovative products with advanced features, expanding into emerging markets, and establishing strong distribution networks. The focus on data integration and remote patient monitoring will shape the future of the BP Cuffs market. The market is expected to reach xx Million by 2033, indicating substantial growth potential.
BP Cuffs Industry Segmentation
-
1. Usage
- 1.1. Reusable
- 1.2. Disposable
-
2. Product Type
- 2.1. Manual
- 2.2. Automated
-
3. End User
- 3.1. Hospitals
- 3.2. Clinics
- 3.3. Other End Users
BP Cuffs Industry Segmentation By Geography
-
1. North America
- 1.1. United States
- 1.2. Canada
- 1.3. Mexico
-
2. Europe
- 2.1. Germany
- 2.2. United Kingdom
- 2.3. France
- 2.4. Italy
- 2.5. Spain
- 2.6. Rest of Europe
-
3. Asia Pacific
- 3.1. China
- 3.2. Japan
- 3.3. India
- 3.4. Australia
- 3.5. South Korea
- 3.6. Rest of Asia Pacific
-
4. Middle East and Africa
- 4.1. GCC
- 4.2. South Africa
- 4.3. Rest of Middle East and Africa
-
5. South America
- 5.1. Brazil
- 5.2. Argentina
- 5.3. Rest of South America
BP Cuffs Industry REPORT HIGHLIGHTS
| Aspects | Details |
|---|---|
| Study Period | 2019-2033 |
| Base Year | 2024 |
| Estimated Year | 2025 |
| Forecast Period | 2025-2033 |
| Historical Period | 2019-2024 |
| Growth Rate | CAGR of 5.89% from 2019-2033 |
| Segmentation |
|
Table of Contents
- 1. Introduction
- 1.1. Research Scope
- 1.2. Market Segmentation
- 1.3. Research Methodology
- 1.4. Definitions and Assumptions
- 2. Executive Summary
- 2.1. Introduction
- 3. Market Dynamics
- 3.1. Introduction
- 3.2. Market Drivers
- 3.2.1. Increasing Prevalence of Hypertension; Growing Demand for Blood Monitoring Devices
- 3.3. Market Restrains
- 3.3.1. Threat of Infection from Reusable BP Cuffs
- 3.4. Market Trends
- 3.4.1. Automated Blood Pressure Cuffs Segment is Expected to Hold a Significant Market Share Over the Forecast Period
- 4. Market Factor Analysis
- 4.1. Porters Five Forces
- 4.2. Supply/Value Chain
- 4.3. PESTEL analysis
- 4.4. Market Entropy
- 4.5. Patent/Trademark Analysis
- 5. Global BP Cuffs Industry Analysis, Insights and Forecast, 2019-2031
- 5.1. Market Analysis, Insights and Forecast - by Usage
- 5.1.1. Reusable
- 5.1.2. Disposable
- 5.2. Market Analysis, Insights and Forecast - by Product Type
- 5.2.1. Manual
- 5.2.2. Automated
- 5.3. Market Analysis, Insights and Forecast - by End User
- 5.3.1. Hospitals
- 5.3.2. Clinics
- 5.3.3. Other End Users
- 5.4. Market Analysis, Insights and Forecast - by Region
- 5.4.1. North America
- 5.4.2. Europe
- 5.4.3. Asia Pacific
- 5.4.4. Middle East and Africa
- 5.4.5. South America
- 5.1. Market Analysis, Insights and Forecast - by Usage
- 6. North America BP Cuffs Industry Analysis, Insights and Forecast, 2019-2031
- 6.1. Market Analysis, Insights and Forecast - by Usage
- 6.1.1. Reusable
- 6.1.2. Disposable
- 6.2. Market Analysis, Insights and Forecast - by Product Type
- 6.2.1. Manual
- 6.2.2. Automated
- 6.3. Market Analysis, Insights and Forecast - by End User
- 6.3.1. Hospitals
- 6.3.2. Clinics
- 6.3.3. Other End Users
- 6.1. Market Analysis, Insights and Forecast - by Usage
- 7. Europe BP Cuffs Industry Analysis, Insights and Forecast, 2019-2031
- 7.1. Market Analysis, Insights and Forecast - by Usage
- 7.1.1. Reusable
- 7.1.2. Disposable
- 7.2. Market Analysis, Insights and Forecast - by Product Type
- 7.2.1. Manual
- 7.2.2. Automated
- 7.3. Market Analysis, Insights and Forecast - by End User
- 7.3.1. Hospitals
- 7.3.2. Clinics
- 7.3.3. Other End Users
- 7.1. Market Analysis, Insights and Forecast - by Usage
- 8. Asia Pacific BP Cuffs Industry Analysis, Insights and Forecast, 2019-2031
- 8.1. Market Analysis, Insights and Forecast - by Usage
- 8.1.1. Reusable
- 8.1.2. Disposable
- 8.2. Market Analysis, Insights and Forecast - by Product Type
- 8.2.1. Manual
- 8.2.2. Automated
- 8.3. Market Analysis, Insights and Forecast - by End User
- 8.3.1. Hospitals
- 8.3.2. Clinics
- 8.3.3. Other End Users
- 8.1. Market Analysis, Insights and Forecast - by Usage
- 9. Middle East and Africa BP Cuffs Industry Analysis, Insights and Forecast, 2019-2031
- 9.1. Market Analysis, Insights and Forecast - by Usage
- 9.1.1. Reusable
- 9.1.2. Disposable
- 9.2. Market Analysis, Insights and Forecast - by Product Type
- 9.2.1. Manual
- 9.2.2. Automated
- 9.3. Market Analysis, Insights and Forecast - by End User
- 9.3.1. Hospitals
- 9.3.2. Clinics
- 9.3.3. Other End Users
- 9.1. Market Analysis, Insights and Forecast - by Usage
- 10. South America BP Cuffs Industry Analysis, Insights and Forecast, 2019-2031
- 10.1. Market Analysis, Insights and Forecast - by Usage
- 10.1.1. Reusable
- 10.1.2. Disposable
- 10.2. Market Analysis, Insights and Forecast - by Product Type
- 10.2.1. Manual
- 10.2.2. Automated
- 10.3. Market Analysis, Insights and Forecast - by End User
- 10.3.1. Hospitals
- 10.3.2. Clinics
- 10.3.3. Other End Users
- 10.1. Market Analysis, Insights and Forecast - by Usage
- 11. North America BP Cuffs Industry Analysis, Insights and Forecast, 2019-2031
- 11.1. Market Analysis, Insights and Forecast - By Country/Sub-region
- 11.1.1 United States
- 11.1.2 Canada
- 11.1.3 Mexico
- 12. Europe BP Cuffs Industry Analysis, Insights and Forecast, 2019-2031
- 12.1. Market Analysis, Insights and Forecast - By Country/Sub-region
- 12.1.1 Germany
- 12.1.2 United Kingdom
- 12.1.3 France
- 12.1.4 Italy
- 12.1.5 Spain
- 12.1.6 Rest of Europe
- 13. Asia Pacific BP Cuffs Industry Analysis, Insights and Forecast, 2019-2031
- 13.1. Market Analysis, Insights and Forecast - By Country/Sub-region
- 13.1.1 China
- 13.1.2 Japan
- 13.1.3 India
- 13.1.4 Australia
- 13.1.5 South Korea
- 13.1.6 Rest of Asia Pacific
- 14. Middle East and Africa BP Cuffs Industry Analysis, Insights and Forecast, 2019-2031
- 14.1. Market Analysis, Insights and Forecast - By Country/Sub-region
- 14.1.1 GCC
- 14.1.2 South Africa
- 14.1.3 Rest of Middle East and Africa
- 15. South America BP Cuffs Industry Analysis, Insights and Forecast, 2019-2031
- 15.1. Market Analysis, Insights and Forecast - By Country/Sub-region
- 15.1.1 Brazil
- 15.1.2 Argentina
- 15.1.3 Rest of South America
- 16. Competitive Analysis
- 16.1. Global Market Share Analysis 2024
- 16.2. Company Profiles
- 16.2.1 Halma PLC
- 16.2.1.1. Overview
- 16.2.1.2. Products
- 16.2.1.3. SWOT Analysis
- 16.2.1.4. Recent Developments
- 16.2.1.5. Financials (Based on Availability)
- 16.2.2 Elanor Surgicals
- 16.2.2.1. Overview
- 16.2.2.2. Products
- 16.2.2.3. SWOT Analysis
- 16.2.2.4. Recent Developments
- 16.2.2.5. Financials (Based on Availability)
- 16.2.3 GE Healthcare
- 16.2.3.1. Overview
- 16.2.3.2. Products
- 16.2.3.3. SWOT Analysis
- 16.2.3.4. Recent Developments
- 16.2.3.5. Financials (Based on Availability)
- 16.2.4 W A Baum Co Inc
- 16.2.4.1. Overview
- 16.2.4.2. Products
- 16.2.4.3. SWOT Analysis
- 16.2.4.4. Recent Developments
- 16.2.4.5. Financials (Based on Availability)
- 16.2.5 Baxter
- 16.2.5.1. Overview
- 16.2.5.2. Products
- 16.2.5.3. SWOT Analysis
- 16.2.5.4. Recent Developments
- 16.2.5.5. Financials (Based on Availability)
- 16.2.6 Spengler SAS
- 16.2.6.1. Overview
- 16.2.6.2. Products
- 16.2.6.3. SWOT Analysis
- 16.2.6.4. Recent Developments
- 16.2.6.5. Financials (Based on Availability)
- 16.2.7 Cardinal Health
- 16.2.7.1. Overview
- 16.2.7.2. Products
- 16.2.7.3. SWOT Analysis
- 16.2.7.4. Recent Developments
- 16.2.7.5. Financials (Based on Availability)
- 16.2.8 Koninklijke Philips NV
- 16.2.8.1. Overview
- 16.2.8.2. Products
- 16.2.8.3. SWOT Analysis
- 16.2.8.4. Recent Developments
- 16.2.8.5. Financials (Based on Availability)
- 16.2.9 Omron Healthcare Inc
- 16.2.9.1. Overview
- 16.2.9.2. Products
- 16.2.9.3. SWOT Analysis
- 16.2.9.4. Recent Developments
- 16.2.9.5. Financials (Based on Availability)
- 16.2.10 Spacelabs Healthcare
- 16.2.10.1. Overview
- 16.2.10.2. Products
- 16.2.10.3. SWOT Analysis
- 16.2.10.4. Recent Developments
- 16.2.10.5. Financials (Based on Availability)
- 16.2.11 American Diagnostic Corporation
- 16.2.11.1. Overview
- 16.2.11.2. Products
- 16.2.11.3. SWOT Analysis
- 16.2.11.4. Recent Developments
- 16.2.11.5. Financials (Based on Availability)
- 16.2.12 Medline Industries Inc
- 16.2.12.1. Overview
- 16.2.12.2. Products
- 16.2.12.3. SWOT Analysis
- 16.2.12.4. Recent Developments
- 16.2.12.5. Financials (Based on Availability)
- 16.2.1 Halma PLC
List of Figures
- Figure 1: Global BP Cuffs Industry Revenue Breakdown (Million, %) by Region 2024 & 2032
- Figure 2: Global BP Cuffs Industry Volume Breakdown (K Unit, %) by Region 2024 & 2032
- Figure 3: North America BP Cuffs Industry Revenue (Million), by Country 2024 & 2032
- Figure 4: North America BP Cuffs Industry Volume (K Unit), by Country 2024 & 2032
- Figure 5: North America BP Cuffs Industry Revenue Share (%), by Country 2024 & 2032
- Figure 6: North America BP Cuffs Industry Volume Share (%), by Country 2024 & 2032
- Figure 7: Europe BP Cuffs Industry Revenue (Million), by Country 2024 & 2032
- Figure 8: Europe BP Cuffs Industry Volume (K Unit), by Country 2024 & 2032
- Figure 9: Europe BP Cuffs Industry Revenue Share (%), by Country 2024 & 2032
- Figure 10: Europe BP Cuffs Industry Volume Share (%), by Country 2024 & 2032
- Figure 11: Asia Pacific BP Cuffs Industry Revenue (Million), by Country 2024 & 2032
- Figure 12: Asia Pacific BP Cuffs Industry Volume (K Unit), by Country 2024 & 2032
- Figure 13: Asia Pacific BP Cuffs Industry Revenue Share (%), by Country 2024 & 2032
- Figure 14: Asia Pacific BP Cuffs Industry Volume Share (%), by Country 2024 & 2032
- Figure 15: Middle East and Africa BP Cuffs Industry Revenue (Million), by Country 2024 & 2032
- Figure 16: Middle East and Africa BP Cuffs Industry Volume (K Unit), by Country 2024 & 2032
- Figure 17: Middle East and Africa BP Cuffs Industry Revenue Share (%), by Country 2024 & 2032
- Figure 18: Middle East and Africa BP Cuffs Industry Volume Share (%), by Country 2024 & 2032
- Figure 19: South America BP Cuffs Industry Revenue (Million), by Country 2024 & 2032
- Figure 20: South America BP Cuffs Industry Volume (K Unit), by Country 2024 & 2032
- Figure 21: South America BP Cuffs Industry Revenue Share (%), by Country 2024 & 2032
- Figure 22: South America BP Cuffs Industry Volume Share (%), by Country 2024 & 2032
- Figure 23: North America BP Cuffs Industry Revenue (Million), by Usage 2024 & 2032
- Figure 24: North America BP Cuffs Industry Volume (K Unit), by Usage 2024 & 2032
- Figure 25: North America BP Cuffs Industry Revenue Share (%), by Usage 2024 & 2032
- Figure 26: North America BP Cuffs Industry Volume Share (%), by Usage 2024 & 2032
- Figure 27: North America BP Cuffs Industry Revenue (Million), by Product Type 2024 & 2032
- Figure 28: North America BP Cuffs Industry Volume (K Unit), by Product Type 2024 & 2032
- Figure 29: North America BP Cuffs Industry Revenue Share (%), by Product Type 2024 & 2032
- Figure 30: North America BP Cuffs Industry Volume Share (%), by Product Type 2024 & 2032
- Figure 31: North America BP Cuffs Industry Revenue (Million), by End User 2024 & 2032
- Figure 32: North America BP Cuffs Industry Volume (K Unit), by End User 2024 & 2032
- Figure 33: North America BP Cuffs Industry Revenue Share (%), by End User 2024 & 2032
- Figure 34: North America BP Cuffs Industry Volume Share (%), by End User 2024 & 2032
- Figure 35: North America BP Cuffs Industry Revenue (Million), by Country 2024 & 2032
- Figure 36: North America BP Cuffs Industry Volume (K Unit), by Country 2024 & 2032
- Figure 37: North America BP Cuffs Industry Revenue Share (%), by Country 2024 & 2032
- Figure 38: North America BP Cuffs Industry Volume Share (%), by Country 2024 & 2032
- Figure 39: Europe BP Cuffs Industry Revenue (Million), by Usage 2024 & 2032
- Figure 40: Europe BP Cuffs Industry Volume (K Unit), by Usage 2024 & 2032
- Figure 41: Europe BP Cuffs Industry Revenue Share (%), by Usage 2024 & 2032
- Figure 42: Europe BP Cuffs Industry Volume Share (%), by Usage 2024 & 2032
- Figure 43: Europe BP Cuffs Industry Revenue (Million), by Product Type 2024 & 2032
- Figure 44: Europe BP Cuffs Industry Volume (K Unit), by Product Type 2024 & 2032
- Figure 45: Europe BP Cuffs Industry Revenue Share (%), by Product Type 2024 & 2032
- Figure 46: Europe BP Cuffs Industry Volume Share (%), by Product Type 2024 & 2032
- Figure 47: Europe BP Cuffs Industry Revenue (Million), by End User 2024 & 2032
- Figure 48: Europe BP Cuffs Industry Volume (K Unit), by End User 2024 & 2032
- Figure 49: Europe BP Cuffs Industry Revenue Share (%), by End User 2024 & 2032
- Figure 50: Europe BP Cuffs Industry Volume Share (%), by End User 2024 & 2032
- Figure 51: Europe BP Cuffs Industry Revenue (Million), by Country 2024 & 2032
- Figure 52: Europe BP Cuffs Industry Volume (K Unit), by Country 2024 & 2032
- Figure 53: Europe BP Cuffs Industry Revenue Share (%), by Country 2024 & 2032
- Figure 54: Europe BP Cuffs Industry Volume Share (%), by Country 2024 & 2032
- Figure 55: Asia Pacific BP Cuffs Industry Revenue (Million), by Usage 2024 & 2032
- Figure 56: Asia Pacific BP Cuffs Industry Volume (K Unit), by Usage 2024 & 2032
- Figure 57: Asia Pacific BP Cuffs Industry Revenue Share (%), by Usage 2024 & 2032
- Figure 58: Asia Pacific BP Cuffs Industry Volume Share (%), by Usage 2024 & 2032
- Figure 59: Asia Pacific BP Cuffs Industry Revenue (Million), by Product Type 2024 & 2032
- Figure 60: Asia Pacific BP Cuffs Industry Volume (K Unit), by Product Type 2024 & 2032
- Figure 61: Asia Pacific BP Cuffs Industry Revenue Share (%), by Product Type 2024 & 2032
- Figure 62: Asia Pacific BP Cuffs Industry Volume Share (%), by Product Type 2024 & 2032
- Figure 63: Asia Pacific BP Cuffs Industry Revenue (Million), by End User 2024 & 2032
- Figure 64: Asia Pacific BP Cuffs Industry Volume (K Unit), by End User 2024 & 2032
- Figure 65: Asia Pacific BP Cuffs Industry Revenue Share (%), by End User 2024 & 2032
- Figure 66: Asia Pacific BP Cuffs Industry Volume Share (%), by End User 2024 & 2032
- Figure 67: Asia Pacific BP Cuffs Industry Revenue (Million), by Country 2024 & 2032
- Figure 68: Asia Pacific BP Cuffs Industry Volume (K Unit), by Country 2024 & 2032
- Figure 69: Asia Pacific BP Cuffs Industry Revenue Share (%), by Country 2024 & 2032
- Figure 70: Asia Pacific BP Cuffs Industry Volume Share (%), by Country 2024 & 2032
- Figure 71: Middle East and Africa BP Cuffs Industry Revenue (Million), by Usage 2024 & 2032
- Figure 72: Middle East and Africa BP Cuffs Industry Volume (K Unit), by Usage 2024 & 2032
- Figure 73: Middle East and Africa BP Cuffs Industry Revenue Share (%), by Usage 2024 & 2032
- Figure 74: Middle East and Africa BP Cuffs Industry Volume Share (%), by Usage 2024 & 2032
- Figure 75: Middle East and Africa BP Cuffs Industry Revenue (Million), by Product Type 2024 & 2032
- Figure 76: Middle East and Africa BP Cuffs Industry Volume (K Unit), by Product Type 2024 & 2032
- Figure 77: Middle East and Africa BP Cuffs Industry Revenue Share (%), by Product Type 2024 & 2032
- Figure 78: Middle East and Africa BP Cuffs Industry Volume Share (%), by Product Type 2024 & 2032
- Figure 79: Middle East and Africa BP Cuffs Industry Revenue (Million), by End User 2024 & 2032
- Figure 80: Middle East and Africa BP Cuffs Industry Volume (K Unit), by End User 2024 & 2032
- Figure 81: Middle East and Africa BP Cuffs Industry Revenue Share (%), by End User 2024 & 2032
- Figure 82: Middle East and Africa BP Cuffs Industry Volume Share (%), by End User 2024 & 2032
- Figure 83: Middle East and Africa BP Cuffs Industry Revenue (Million), by Country 2024 & 2032
- Figure 84: Middle East and Africa BP Cuffs Industry Volume (K Unit), by Country 2024 & 2032
- Figure 85: Middle East and Africa BP Cuffs Industry Revenue Share (%), by Country 2024 & 2032
- Figure 86: Middle East and Africa BP Cuffs Industry Volume Share (%), by Country 2024 & 2032
- Figure 87: South America BP Cuffs Industry Revenue (Million), by Usage 2024 & 2032
- Figure 88: South America BP Cuffs Industry Volume (K Unit), by Usage 2024 & 2032
- Figure 89: South America BP Cuffs Industry Revenue Share (%), by Usage 2024 & 2032
- Figure 90: South America BP Cuffs Industry Volume Share (%), by Usage 2024 & 2032
- Figure 91: South America BP Cuffs Industry Revenue (Million), by Product Type 2024 & 2032
- Figure 92: South America BP Cuffs Industry Volume (K Unit), by Product Type 2024 & 2032
- Figure 93: South America BP Cuffs Industry Revenue Share (%), by Product Type 2024 & 2032
- Figure 94: South America BP Cuffs Industry Volume Share (%), by Product Type 2024 & 2032
- Figure 95: South America BP Cuffs Industry Revenue (Million), by End User 2024 & 2032
- Figure 96: South America BP Cuffs Industry Volume (K Unit), by End User 2024 & 2032
- Figure 97: South America BP Cuffs Industry Revenue Share (%), by End User 2024 & 2032
- Figure 98: South America BP Cuffs Industry Volume Share (%), by End User 2024 & 2032
- Figure 99: South America BP Cuffs Industry Revenue (Million), by Country 2024 & 2032
- Figure 100: South America BP Cuffs Industry Volume (K Unit), by Country 2024 & 2032
- Figure 101: South America BP Cuffs Industry Revenue Share (%), by Country 2024 & 2032
- Figure 102: South America BP Cuffs Industry Volume Share (%), by Country 2024 & 2032
List of Tables
- Table 1: Global BP Cuffs Industry Revenue Million Forecast, by Region 2019 & 2032
- Table 2: Global BP Cuffs Industry Volume K Unit Forecast, by Region 2019 & 2032
- Table 3: Global BP Cuffs Industry Revenue Million Forecast, by Usage 2019 & 2032
- Table 4: Global BP Cuffs Industry Volume K Unit Forecast, by Usage 2019 & 2032
- Table 5: Global BP Cuffs Industry Revenue Million Forecast, by Product Type 2019 & 2032
- Table 6: Global BP Cuffs Industry Volume K Unit Forecast, by Product Type 2019 & 2032
- Table 7: Global BP Cuffs Industry Revenue Million Forecast, by End User 2019 & 2032
- Table 8: Global BP Cuffs Industry Volume K Unit Forecast, by End User 2019 & 2032
- Table 9: Global BP Cuffs Industry Revenue Million Forecast, by Region 2019 & 2032
- Table 10: Global BP Cuffs Industry Volume K Unit Forecast, by Region 2019 & 2032
- Table 11: Global BP Cuffs Industry Revenue Million Forecast, by Country 2019 & 2032
- Table 12: Global BP Cuffs Industry Volume K Unit Forecast, by Country 2019 & 2032
- Table 13: United States BP Cuffs Industry Revenue (Million) Forecast, by Application 2019 & 2032
- Table 14: United States BP Cuffs Industry Volume (K Unit) Forecast, by Application 2019 & 2032
- Table 15: Canada BP Cuffs Industry Revenue (Million) Forecast, by Application 2019 & 2032
- Table 16: Canada BP Cuffs Industry Volume (K Unit) Forecast, by Application 2019 & 2032
- Table 17: Mexico BP Cuffs Industry Revenue (Million) Forecast, by Application 2019 & 2032
- Table 18: Mexico BP Cuffs Industry Volume (K Unit) Forecast, by Application 2019 & 2032
- Table 19: Global BP Cuffs Industry Revenue Million Forecast, by Country 2019 & 2032
- Table 20: Global BP Cuffs Industry Volume K Unit Forecast, by Country 2019 & 2032
- Table 21: Germany BP Cuffs Industry Revenue (Million) Forecast, by Application 2019 & 2032
- Table 22: Germany BP Cuffs Industry Volume (K Unit) Forecast, by Application 2019 & 2032
- Table 23: United Kingdom BP Cuffs Industry Revenue (Million) Forecast, by Application 2019 & 2032
- Table 24: United Kingdom BP Cuffs Industry Volume (K Unit) Forecast, by Application 2019 & 2032
- Table 25: France BP Cuffs Industry Revenue (Million) Forecast, by Application 2019 & 2032
- Table 26: France BP Cuffs Industry Volume (K Unit) Forecast, by Application 2019 & 2032
- Table 27: Italy BP Cuffs Industry Revenue (Million) Forecast, by Application 2019 & 2032
- Table 28: Italy BP Cuffs Industry Volume (K Unit) Forecast, by Application 2019 & 2032
- Table 29: Spain BP Cuffs Industry Revenue (Million) Forecast, by Application 2019 & 2032
- Table 30: Spain BP Cuffs Industry Volume (K Unit) Forecast, by Application 2019 & 2032
- Table 31: Rest of Europe BP Cuffs Industry Revenue (Million) Forecast, by Application 2019 & 2032
- Table 32: Rest of Europe BP Cuffs Industry Volume (K Unit) Forecast, by Application 2019 & 2032
- Table 33: Global BP Cuffs Industry Revenue Million Forecast, by Country 2019 & 2032
- Table 34: Global BP Cuffs Industry Volume K Unit Forecast, by Country 2019 & 2032
- Table 35: China BP Cuffs Industry Revenue (Million) Forecast, by Application 2019 & 2032
- Table 36: China BP Cuffs Industry Volume (K Unit) Forecast, by Application 2019 & 2032
- Table 37: Japan BP Cuffs Industry Revenue (Million) Forecast, by Application 2019 & 2032
- Table 38: Japan BP Cuffs Industry Volume (K Unit) Forecast, by Application 2019 & 2032
- Table 39: India BP Cuffs Industry Revenue (Million) Forecast, by Application 2019 & 2032
- Table 40: India BP Cuffs Industry Volume (K Unit) Forecast, by Application 2019 & 2032
- Table 41: Australia BP Cuffs Industry Revenue (Million) Forecast, by Application 2019 & 2032
- Table 42: Australia BP Cuffs Industry Volume (K Unit) Forecast, by Application 2019 & 2032
- Table 43: South Korea BP Cuffs Industry Revenue (Million) Forecast, by Application 2019 & 2032
- Table 44: South Korea BP Cuffs Industry Volume (K Unit) Forecast, by Application 2019 & 2032
- Table 45: Rest of Asia Pacific BP Cuffs Industry Revenue (Million) Forecast, by Application 2019 & 2032
- Table 46: Rest of Asia Pacific BP Cuffs Industry Volume (K Unit) Forecast, by Application 2019 & 2032
- Table 47: Global BP Cuffs Industry Revenue Million Forecast, by Country 2019 & 2032
- Table 48: Global BP Cuffs Industry Volume K Unit Forecast, by Country 2019 & 2032
- Table 49: GCC BP Cuffs Industry Revenue (Million) Forecast, by Application 2019 & 2032
- Table 50: GCC BP Cuffs Industry Volume (K Unit) Forecast, by Application 2019 & 2032
- Table 51: South Africa BP Cuffs Industry Revenue (Million) Forecast, by Application 2019 & 2032
- Table 52: South Africa BP Cuffs Industry Volume (K Unit) Forecast, by Application 2019 & 2032
- Table 53: Rest of Middle East and Africa BP Cuffs Industry Revenue (Million) Forecast, by Application 2019 & 2032
- Table 54: Rest of Middle East and Africa BP Cuffs Industry Volume (K Unit) Forecast, by Application 2019 & 2032
- Table 55: Global BP Cuffs Industry Revenue Million Forecast, by Country 2019 & 2032
- Table 56: Global BP Cuffs Industry Volume K Unit Forecast, by Country 2019 & 2032
- Table 57: Brazil BP Cuffs Industry Revenue (Million) Forecast, by Application 2019 & 2032
- Table 58: Brazil BP Cuffs Industry Volume (K Unit) Forecast, by Application 2019 & 2032
- Table 59: Argentina BP Cuffs Industry Revenue (Million) Forecast, by Application 2019 & 2032
- Table 60: Argentina BP Cuffs Industry Volume (K Unit) Forecast, by Application 2019 & 2032
- Table 61: Rest of South America BP Cuffs Industry Revenue (Million) Forecast, by Application 2019 & 2032
- Table 62: Rest of South America BP Cuffs Industry Volume (K Unit) Forecast, by Application 2019 & 2032
- Table 63: Global BP Cuffs Industry Revenue Million Forecast, by Usage 2019 & 2032
- Table 64: Global BP Cuffs Industry Volume K Unit Forecast, by Usage 2019 & 2032
- Table 65: Global BP Cuffs Industry Revenue Million Forecast, by Product Type 2019 & 2032
- Table 66: Global BP Cuffs Industry Volume K Unit Forecast, by Product Type 2019 & 2032
- Table 67: Global BP Cuffs Industry Revenue Million Forecast, by End User 2019 & 2032
- Table 68: Global BP Cuffs Industry Volume K Unit Forecast, by End User 2019 & 2032
- Table 69: Global BP Cuffs Industry Revenue Million Forecast, by Country 2019 & 2032
- Table 70: Global BP Cuffs Industry Volume K Unit Forecast, by Country 2019 & 2032
- Table 71: United States BP Cuffs Industry Revenue (Million) Forecast, by Application 2019 & 2032
- Table 72: United States BP Cuffs Industry Volume (K Unit) Forecast, by Application 2019 & 2032
- Table 73: Canada BP Cuffs Industry Revenue (Million) Forecast, by Application 2019 & 2032
- Table 74: Canada BP Cuffs Industry Volume (K Unit) Forecast, by Application 2019 & 2032
- Table 75: Mexico BP Cuffs Industry Revenue (Million) Forecast, by Application 2019 & 2032
- Table 76: Mexico BP Cuffs Industry Volume (K Unit) Forecast, by Application 2019 & 2032
- Table 77: Global BP Cuffs Industry Revenue Million Forecast, by Usage 2019 & 2032
- Table 78: Global BP Cuffs Industry Volume K Unit Forecast, by Usage 2019 & 2032
- Table 79: Global BP Cuffs Industry Revenue Million Forecast, by Product Type 2019 & 2032
- Table 80: Global BP Cuffs Industry Volume K Unit Forecast, by Product Type 2019 & 2032
- Table 81: Global BP Cuffs Industry Revenue Million Forecast, by End User 2019 & 2032
- Table 82: Global BP Cuffs Industry Volume K Unit Forecast, by End User 2019 & 2032
- Table 83: Global BP Cuffs Industry Revenue Million Forecast, by Country 2019 & 2032
- Table 84: Global BP Cuffs Industry Volume K Unit Forecast, by Country 2019 & 2032
- Table 85: Germany BP Cuffs Industry Revenue (Million) Forecast, by Application 2019 & 2032
- Table 86: Germany BP Cuffs Industry Volume (K Unit) Forecast, by Application 2019 & 2032
- Table 87: United Kingdom BP Cuffs Industry Revenue (Million) Forecast, by Application 2019 & 2032
- Table 88: United Kingdom BP Cuffs Industry Volume (K Unit) Forecast, by Application 2019 & 2032
- Table 89: France BP Cuffs Industry Revenue (Million) Forecast, by Application 2019 & 2032
- Table 90: France BP Cuffs Industry Volume (K Unit) Forecast, by Application 2019 & 2032
- Table 91: Italy BP Cuffs Industry Revenue (Million) Forecast, by Application 2019 & 2032
- Table 92: Italy BP Cuffs Industry Volume (K Unit) Forecast, by Application 2019 & 2032
- Table 93: Spain BP Cuffs Industry Revenue (Million) Forecast, by Application 2019 & 2032
- Table 94: Spain BP Cuffs Industry Volume (K Unit) Forecast, by Application 2019 & 2032
- Table 95: Rest of Europe BP Cuffs Industry Revenue (Million) Forecast, by Application 2019 & 2032
- Table 96: Rest of Europe BP Cuffs Industry Volume (K Unit) Forecast, by Application 2019 & 2032
- Table 97: Global BP Cuffs Industry Revenue Million Forecast, by Usage 2019 & 2032
- Table 98: Global BP Cuffs Industry Volume K Unit Forecast, by Usage 2019 & 2032
- Table 99: Global BP Cuffs Industry Revenue Million Forecast, by Product Type 2019 & 2032
- Table 100: Global BP Cuffs Industry Volume K Unit Forecast, by Product Type 2019 & 2032
- Table 101: Global BP Cuffs Industry Revenue Million Forecast, by End User 2019 & 2032
- Table 102: Global BP Cuffs Industry Volume K Unit Forecast, by End User 2019 & 2032
- Table 103: Global BP Cuffs Industry Revenue Million Forecast, by Country 2019 & 2032
- Table 104: Global BP Cuffs Industry Volume K Unit Forecast, by Country 2019 & 2032
- Table 105: China BP Cuffs Industry Revenue (Million) Forecast, by Application 2019 & 2032
- Table 106: China BP Cuffs Industry Volume (K Unit) Forecast, by Application 2019 & 2032
- Table 107: Japan BP Cuffs Industry Revenue (Million) Forecast, by Application 2019 & 2032
- Table 108: Japan BP Cuffs Industry Volume (K Unit) Forecast, by Application 2019 & 2032
- Table 109: India BP Cuffs Industry Revenue (Million) Forecast, by Application 2019 & 2032
- Table 110: India BP Cuffs Industry Volume (K Unit) Forecast, by Application 2019 & 2032
- Table 111: Australia BP Cuffs Industry Revenue (Million) Forecast, by Application 2019 & 2032
- Table 112: Australia BP Cuffs Industry Volume (K Unit) Forecast, by Application 2019 & 2032
- Table 113: South Korea BP Cuffs Industry Revenue (Million) Forecast, by Application 2019 & 2032
- Table 114: South Korea BP Cuffs Industry Volume (K Unit) Forecast, by Application 2019 & 2032
- Table 115: Rest of Asia Pacific BP Cuffs Industry Revenue (Million) Forecast, by Application 2019 & 2032
- Table 116: Rest of Asia Pacific BP Cuffs Industry Volume (K Unit) Forecast, by Application 2019 & 2032
- Table 117: Global BP Cuffs Industry Revenue Million Forecast, by Usage 2019 & 2032
- Table 118: Global BP Cuffs Industry Volume K Unit Forecast, by Usage 2019 & 2032
- Table 119: Global BP Cuffs Industry Revenue Million Forecast, by Product Type 2019 & 2032
- Table 120: Global BP Cuffs Industry Volume K Unit Forecast, by Product Type 2019 & 2032
- Table 121: Global BP Cuffs Industry Revenue Million Forecast, by End User 2019 & 2032
- Table 122: Global BP Cuffs Industry Volume K Unit Forecast, by End User 2019 & 2032
- Table 123: Global BP Cuffs Industry Revenue Million Forecast, by Country 2019 & 2032
- Table 124: Global BP Cuffs Industry Volume K Unit Forecast, by Country 2019 & 2032
- Table 125: GCC BP Cuffs Industry Revenue (Million) Forecast, by Application 2019 & 2032
- Table 126: GCC BP Cuffs Industry Volume (K Unit) Forecast, by Application 2019 & 2032
- Table 127: South Africa BP Cuffs Industry Revenue (Million) Forecast, by Application 2019 & 2032
- Table 128: South Africa BP Cuffs Industry Volume (K Unit) Forecast, by Application 2019 & 2032
- Table 129: Rest of Middle East and Africa BP Cuffs Industry Revenue (Million) Forecast, by Application 2019 & 2032
- Table 130: Rest of Middle East and Africa BP Cuffs Industry Volume (K Unit) Forecast, by Application 2019 & 2032
- Table 131: Global BP Cuffs Industry Revenue Million Forecast, by Usage 2019 & 2032
- Table 132: Global BP Cuffs Industry Volume K Unit Forecast, by Usage 2019 & 2032
- Table 133: Global BP Cuffs Industry Revenue Million Forecast, by Product Type 2019 & 2032
- Table 134: Global BP Cuffs Industry Volume K Unit Forecast, by Product Type 2019 & 2032
- Table 135: Global BP Cuffs Industry Revenue Million Forecast, by End User 2019 & 2032
- Table 136: Global BP Cuffs Industry Volume K Unit Forecast, by End User 2019 & 2032
- Table 137: Global BP Cuffs Industry Revenue Million Forecast, by Country 2019 & 2032
- Table 138: Global BP Cuffs Industry Volume K Unit Forecast, by Country 2019 & 2032
- Table 139: Brazil BP Cuffs Industry Revenue (Million) Forecast, by Application 2019 & 2032
- Table 140: Brazil BP Cuffs Industry Volume (K Unit) Forecast, by Application 2019 & 2032
- Table 141: Argentina BP Cuffs Industry Revenue (Million) Forecast, by Application 2019 & 2032
- Table 142: Argentina BP Cuffs Industry Volume (K Unit) Forecast, by Application 2019 & 2032
- Table 143: Rest of South America BP Cuffs Industry Revenue (Million) Forecast, by Application 2019 & 2032
- Table 144: Rest of South America BP Cuffs Industry Volume (K Unit) Forecast, by Application 2019 & 2032
Frequently Asked Questions
1. What is the projected Compound Annual Growth Rate (CAGR) of the BP Cuffs Industry?
The projected CAGR is approximately 5.89%.
2. Which companies are prominent players in the BP Cuffs Industry?
Key companies in the market include Halma PLC, Elanor Surgicals, GE Healthcare, W A Baum Co Inc , Baxter, Spengler SAS, Cardinal Health, Koninklijke Philips NV, Omron Healthcare Inc, Spacelabs Healthcare, American Diagnostic Corporation, Medline Industries Inc.
3. What are the main segments of the BP Cuffs Industry?
The market segments include Usage, Product Type, End User.
4. Can you provide details about the market size?
The market size is estimated to be USD 554.10 Million as of 2022.
5. What are some drivers contributing to market growth?
Increasing Prevalence of Hypertension; Growing Demand for Blood Monitoring Devices.
6. What are the notable trends driving market growth?
Automated Blood Pressure Cuffs Segment is Expected to Hold a Significant Market Share Over the Forecast Period.
7. Are there any restraints impacting market growth?
Threat of Infection from Reusable BP Cuffs.
8. Can you provide examples of recent developments in the market?
In September 2022, Garmin launched a smart blood pressure monitor with adjustable cuffs which allows users to measure systolic and diastolic blood pressure at home and on the go.
9. What pricing options are available for accessing the report?
Pricing options include single-user, multi-user, and enterprise licenses priced at USD 4750, USD 5250, and USD 8750 respectively.
10. Is the market size provided in terms of value or volume?
The market size is provided in terms of value, measured in Million and volume, measured in K Unit.
11. Are there any specific market keywords associated with the report?
Yes, the market keyword associated with the report is "BP Cuffs Industry," which aids in identifying and referencing the specific market segment covered.
12. How do I determine which pricing option suits my needs best?
The pricing options vary based on user requirements and access needs. Individual users may opt for single-user licenses, while businesses requiring broader access may choose multi-user or enterprise licenses for cost-effective access to the report.
13. Are there any additional resources or data provided in the BP Cuffs Industry report?
While the report offers comprehensive insights, it's advisable to review the specific contents or supplementary materials provided to ascertain if additional resources or data are available.
14. How can I stay updated on further developments or reports in the BP Cuffs Industry?
To stay informed about further developments, trends, and reports in the BP Cuffs Industry, consider subscribing to industry newsletters, following relevant companies and organizations, or regularly checking reputable industry news sources and publications.
Methodology
Step 1 - Identification of Relevant Samples Size from Population Database


Step 2 - Approaches for Defining Global Market Size (Value, Volume* & Price*)

Note*: In applicable scenarios
Step 3 - Data Sources
Primary Research
- Web Analytics
- Survey Reports
- Research Institute
- Latest Research Reports
- Opinion Leaders
Secondary Research
- Annual Reports
- White Paper
- Latest Press Release
- Industry Association
- Paid Database
- Investor Presentations

Step 4 - Data Triangulation
Involves using different sources of information in order to increase the validity of a study
These sources are likely to be stakeholders in a program - participants, other researchers, program staff, other community members, and so on.
Then we put all data in single framework & apply various statistical tools to find out the dynamic on the market.
During the analysis stage, feedback from the stakeholder groups would be compared to determine areas of agreement as well as areas of divergence
