

Key Insights
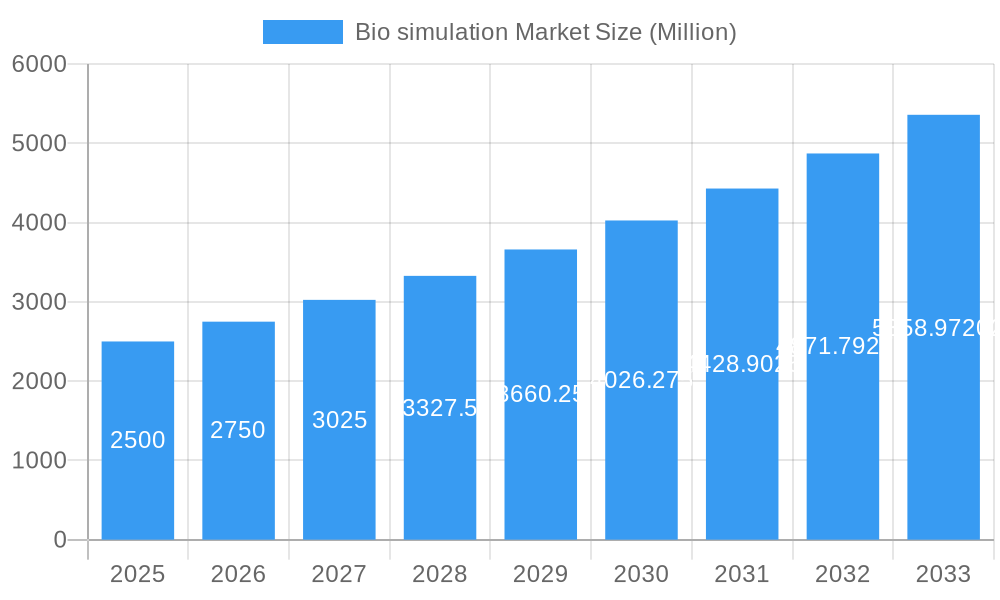
The global Bio simulation Market is poised for significant expansion, projected to reach approximately USD 2,500 Million by 2025, with an impressive Compound Annual Growth Rate (CAGR) of 10.00% anticipated over the forecast period of 2025-2033. This robust growth is primarily propelled by the escalating demand for accelerated drug discovery and development processes, coupled with the inherent need to reduce the costs and risks associated with traditional experimental methodologies. Pharmaceutical and biotechnology companies are increasingly leveraging advanced bio simulation techniques to predict drug efficacy, optimize dosing regimens, and identify potential safety concerns earlier in the pipeline, thereby streamlining R&D efforts. The growing complexity of biological systems and the burgeoning volume of biological data further fuel the adoption of sophisticated simulation tools. Furthermore, regulatory bodies are showing a greater acceptance of computational modeling and simulation data as a supportive tool in drug approval processes, creating a favorable market environment.
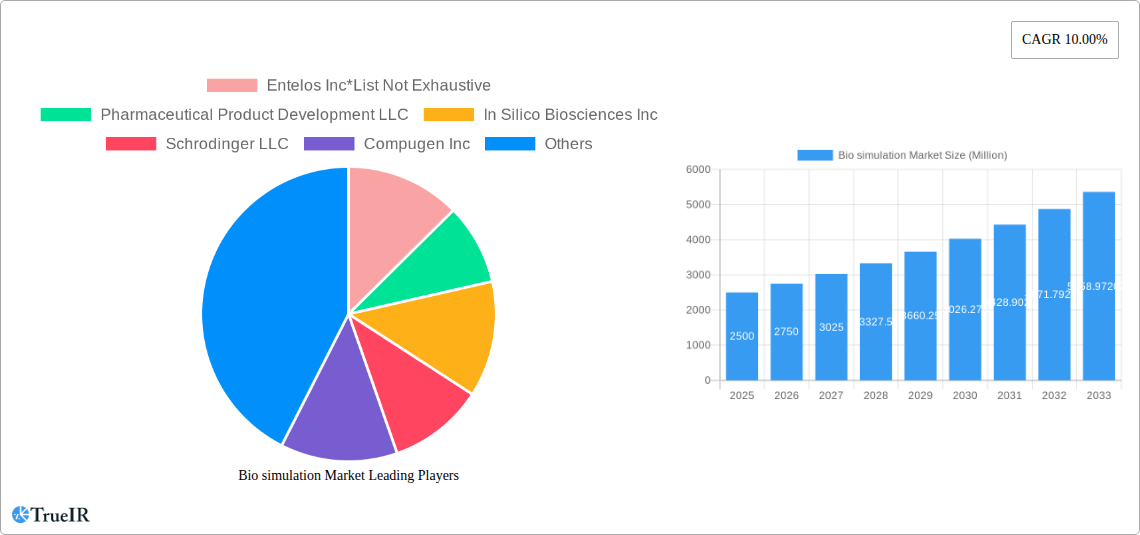
Bio simulation Market Market Size (In Billion)
The market's expansion is further underpinned by strategic advancements in software and services that enhance the accuracy and applicability of bio simulation. Key trends include the integration of artificial intelligence (AI) and machine learning (ML) into simulation platforms, enabling more predictive and personalized drug development. The expanding applications across preclinical and clinical drug development, alongside drug discovery, highlight the versatility of bio simulation solutions. While the market benefits from these powerful drivers, certain restraints such as the high initial investment for advanced simulation software and the need for specialized expertise can pose challenges. However, the ongoing development of user-friendly interfaces and the increasing availability of cloud-based simulation services are mitigating these barriers, ensuring continued market growth. North America and Europe are expected to remain dominant regions, driven by extensive research infrastructure and significant investments in pharmaceutical R&D, with Asia Pacific emerging as a rapidly growing market.
Bio simulation Market Company Market Share
This comprehensive Bio Simulation Market report provides an in-depth analysis of the global market landscape, with a focus on the period from 2019 to 2033. Leveraging advanced predictive analytics and high-volume keywords such as "drug discovery," "preclinical trials," "biologics," "pharmaceutical R&D," and "computational modeling," this report is meticulously crafted for SEO optimization, ensuring maximum visibility and engagement for industry stakeholders. The study delves into market size, trends, opportunities, competitive dynamics, and key growth drivers, offering actionable insights for pharmaceutical and biotechnology companies, contract research organizations (CROs), and software providers. The base year for the analysis is 2025, with the forecast period extending from 2025 to 2033.
Bio Simulation Market Market Structure & Competitive Landscape
The global Bio Simulation Market exhibits a moderately concentrated structure, with a mix of established industry giants and emerging innovators. Key players are heavily invested in research and development, driving innovation in computational modeling and predictive analytics for drug development. Regulatory frameworks, while essential for patient safety, also influence market dynamics by demanding robust validation of simulation data. Product substitutes, though less sophisticated, include traditional experimental methods. The market's competitive intensity is characterized by strategic partnerships, mergers, and acquisitions aimed at consolidating market share and expanding technological capabilities. For instance, in the historical period (2019-2024), an estimated XX M&A deals were recorded, highlighting the strategic consolidations within the sector. The end-user segmentation, dominated by pharmaceutical and biotechnology companies, also shapes competitive strategies, with a strong emphasis on tailored solutions for preclinical and clinical drug development. The integration of artificial intelligence and machine learning is a significant innovation driver, promising to accelerate drug discovery timelines and reduce R&D costs.
- Market Concentration: Moderately concentrated, with key players investing heavily in R&D.
- Innovation Drivers: AI/ML integration, advanced algorithms, and novel simulation methodologies.
- Regulatory Impacts: Stringent validation requirements for simulation data.
- Product Substitutes: Traditional experimental methods, though less efficient.
- End-User Segmentation: Primarily pharmaceutical and biotechnology companies, followed by CROs.
- M&A Trends: Strategic acquisitions to expand technological portfolios and market reach.
Bio Simulation Market Market Trends & Opportunities
The global Bio Simulation Market is poised for substantial growth, projected to reach an estimated $XX Billion by 2033, exhibiting a robust Compound Annual Growth Rate (CAGR) of approximately XX% during the forecast period (2025-2033). This expansion is fueled by the increasing demand for accelerated drug discovery and development cycles, coupled with the rising complexity of novel therapeutics, particularly biologics. Technological advancements, including the integration of artificial intelligence (AI) and machine learning (ML) into simulation platforms, are revolutionizing the industry. These technologies enable more accurate predictions of drug efficacy, toxicity, and pharmacokinetic profiles, significantly reducing the need for costly and time-consuming in-vivo studies.
The rising investments in pharmaceutical research and development, especially in oncology, infectious diseases, and rare diseases, are creating a fertile ground for bio simulation solutions. Pharmaceutical and biotechnology companies are increasingly adopting these tools to de-risk their R&D pipelines and identify promising drug candidates earlier in the discovery phase. Furthermore, contract research organizations (CROs) are leveraging bio simulation to offer enhanced services to their clients, thereby improving efficiency and reducing costs. The growing emphasis on personalized medicine also presents a significant opportunity, as bio simulation can help predict individual patient responses to therapies, paving the way for more targeted and effective treatment strategies.
The shift towards virtual screening and in-silico preclinical testing is a prominent trend, driven by cost-effectiveness and ethical considerations. This trend is further amplified by the increasing computational power and the availability of vast biological datasets, which enhance the accuracy and reliability of simulations. The market is also witnessing a growing adoption of services alongside software, indicating a demand for end-to-end solutions that encompass model development, validation, and interpretation. Opportunities also lie in developing specialized simulation tools for specific therapeutic areas or drug modalities, such as gene therapy and cell therapy, which present unique development challenges. The growing global healthcare expenditure and the persistent need for innovative treatments for unmet medical needs are fundamental drivers underpinning the sustained growth trajectory of the bio simulation market. The market penetration rate for advanced bio simulation solutions is expected to increase significantly as more organizations recognize their strategic value in optimizing R&D investments and bringing life-saving therapies to market faster.
Dominant Markets & Segments in Bio Simulation Market
The North America region is currently the dominant market for bio simulation, driven by a robust pharmaceutical and biotechnology ecosystem, significant R&D investments, and the presence of leading academic institutions and research centers. The United States, in particular, spearheads this dominance due to its proactive regulatory environment that encourages innovation and its substantial healthcare expenditure, fostering demand for advanced drug development solutions.
Within the Product segment, Software is the leading category. This dominance is attributable to the increasing sophistication of bio simulation platforms, offering enhanced functionalities for complex modeling and analysis. Companies are investing heavily in developing user-friendly interfaces and advanced algorithms that integrate AI and ML capabilities, making these tools indispensable for modern drug discovery and development. The demand for specialized software modules for areas like molecular modeling, systems biology, and pharmacokinetics is consistently high.
In terms of Application, Preclinical and Clinical Drug Development holds the largest market share. This is a direct consequence of the bio simulation market's core value proposition: accelerating and de-risking the drug development process. By enabling accurate predictions of drug efficacy, safety, and patient response, these simulations significantly reduce the failure rates in later, more expensive, clinical trial stages. The ability to optimize trial design and identify optimal patient populations further solidifies this segment's dominance.
The End User segment is predominantly led by Pharmaceutical and Biotechnology Companies. These organizations are the primary beneficiaries of bio simulation technologies, integrating them into their R&D pipelines to achieve faster drug development, reduced costs, and improved success rates. The increasing complexity of drug targets and the growing pipeline of biologics and advanced therapies necessitate the sophisticated predictive capabilities offered by bio simulation. Contract Research Organizations (CROs) are also a significant and growing end-user segment, leveraging bio simulation to offer competitive and efficient research services to their pharmaceutical clients.
- Dominant Region: North America, with the United States leading due to strong R&D infrastructure and investment.
- Leading Product Segment: Software, driven by advancements in AI/ML integration and specialized modeling capabilities.
- Primary Application: Preclinical and Clinical Drug Development, due to its ability to de-risk and accelerate the R&D pipeline.
- Key End User: Pharmaceutical and Biotechnology Companies, leveraging simulations for improved drug discovery outcomes.
Bio Simulation Market Product Analysis
The bio simulation market is characterized by continuous product innovation, with a strong emphasis on developing sophisticated software platforms and integrated services. Key product advancements include the incorporation of machine learning algorithms for enhanced predictive accuracy in drug discovery and development. Software solutions are increasingly offering specialized modules for areas such as molecular dynamics, systems pharmacology, and immunogenicity prediction, catering to the evolving needs of researchers. These products provide significant competitive advantages by enabling virtual screening, in-silico preclinical testing, and personalized treatment regimen optimization. The market fit is driven by the demand for faster, more cost-effective, and reliable R&D processes.
Key Drivers, Barriers & Challenges in Bio Simulation Market
Key Drivers: The bio simulation market is propelled by several critical factors. The escalating costs and lengthy timelines associated with traditional drug discovery and development processes are a major impetus. The increasing prevalence of chronic diseases and the continuous demand for novel therapeutics further fuel the need for efficient R&D solutions. Technological advancements, particularly in AI, machine learning, and computational power, are enabling more sophisticated and accurate simulations. Furthermore, the growing adoption of personalized medicine strategies necessitates predictive modeling to understand individual patient responses. Regulatory bodies' increasing acceptance of in-silico data for certain aspects of drug development also acts as a significant growth driver.
Barriers and Challenges: Despite the promising growth, the bio simulation market faces certain hurdles. The high initial investment required for advanced software and computational infrastructure can be a barrier for smaller organizations. The complexity of biological systems and the need for highly skilled personnel to develop, validate, and interpret simulation models present a challenge. Regulatory acceptance, while growing, still requires robust validation of simulation outputs. Data standardization and integration across different platforms can also pose challenges. Lastly, competitive pressures from established players and the need for continuous innovation to stay ahead of the curve are ongoing challenges.
Growth Drivers in the Bio Simulation Market Market
The Bio Simulation Market is experiencing robust growth, significantly driven by the pharmaceutical industry's relentless pursuit of faster and more cost-effective drug development. The escalating complexity of biologics and advanced therapies necessitates sophisticated predictive modeling capabilities that traditional methods cannot provide. The integration of Artificial Intelligence (AI) and Machine Learning (ML) into bio simulation platforms is a pivotal growth catalyst, enabling highly accurate predictions of drug efficacy and toxicity. Furthermore, the increasing focus on personalized medicine and the desire to de-risk R&D pipelines by identifying promising drug candidates earlier are strong motivators for adopting these advanced technologies.
Challenges Impacting Bio Simulation Market Growth
Despite its strong trajectory, the Bio Simulation Market faces several critical challenges that could impede its growth. The significant upfront investment required for advanced software and high-performance computing infrastructure can be a barrier for smaller biotech firms and academic institutions. Ensuring the regulatory acceptance and validation of in-silico data for drug approval processes remains a complex hurdle, requiring extensive validation studies. The inherent complexity of biological systems and the need for highly specialized expertise to build, run, and interpret complex simulations can limit widespread adoption. Furthermore, data standardization and interoperability across different simulation platforms can create integration issues, hindering seamless workflow.
Key Players Shaping the Bio Simulation Market Market
- Entelos Inc
- Pharmaceutical Product Development LLC
- In Silico Biosciences Inc
- Schrodinger LLC
- Compugen Inc
- Biovia
- Leadscope Inc
- Certara L P
- Simulations Plus Inc
- Genedata
Significant Bio Simulation Market Industry Milestones
- June 2022: Certara announced the launch of a new version of its Immunogenicity (IG), Immuno-Oncology (IO), and Vaccine Simulators, designed to predict drug efficacy and address key questions in the development of novel biologic therapies.
- April 2021: Applied BioMath launched its first software solution, Applied BioMath Assess, aimed at assisting project leaders and protein engineers in evaluating difficulties encountered during biotherapeutic development.
Future Outlook for Bio Simulation Market Market
The future outlook for the Bio Simulation Market is exceptionally bright, driven by sustained innovation and increasing adoption across the pharmaceutical and biotechnology sectors. The integration of quantum computing and advanced AI/ML will further enhance predictive accuracy and speed, unlocking new frontiers in drug discovery. Opportunities lie in the development of specialized simulation platforms for emerging therapeutic modalities like cell and gene therapies, as well as for predictive toxicology and patient stratification. Strategic collaborations between technology providers and pharmaceutical companies will be crucial in driving market growth and translating complex simulations into tangible clinical outcomes, ultimately leading to faster development of life-saving treatments.
Bio simulation Market Segmentation
-
1. Product
- 1.1. Software
- 1.2. Services
-
2. Application
- 2.1. Preclinical and Clinical Drug Development
- 2.2. Drug Discovery
- 2.3. Others
-
3. End User
- 3.1. Pharmaceutical and Biotechnology Companies
- 3.2. Contract Research Organizations
- 3.3. Others
Bio simulation Market Segmentation By Geography
-
1. North America
- 1.1. United States
- 1.2. Canada
- 1.3. Mexico
-
2. Europe
- 2.1. Germany
- 2.2. United Kingdom
- 2.3. France
- 2.4. Italy
- 2.5. Spain
- 2.6. Rest of Europe
-
3. Asia Pacific
- 3.1. China
- 3.2. Japan
- 3.3. India
- 3.4. Australia
- 3.5. South Korea
- 3.6. Rest of Asia Pacific
-
4. Middle East and Africa
- 4.1. GCC
- 4.2. South Africa
- 4.3. Rest of Middle East and Africa
-
5. South America
- 5.1. Brazil
- 5.2. Argentina
- 5.3. Rest of South America
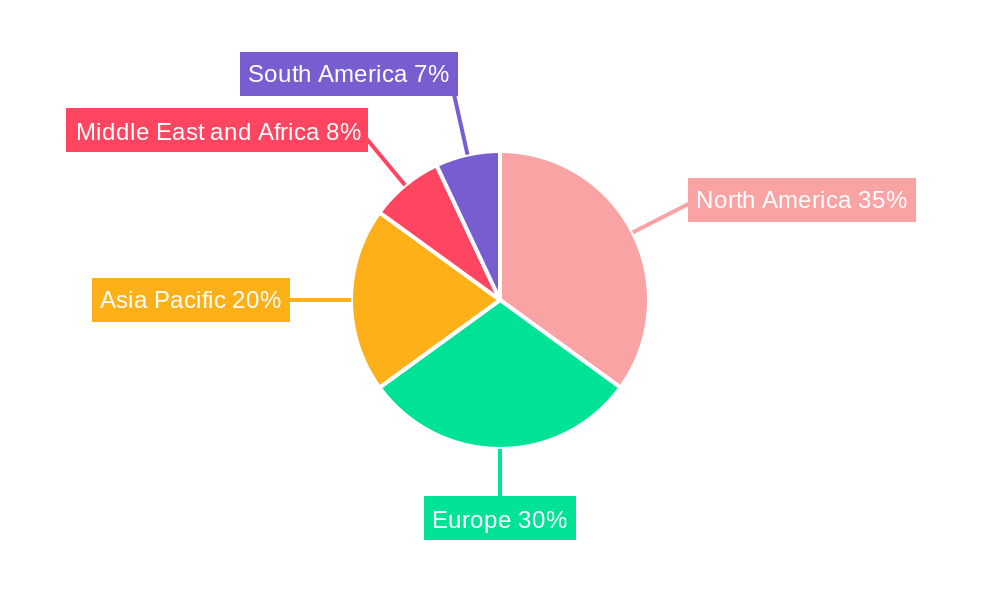
Bio simulation Market Regional Market Share
Geographic Coverage of Bio simulation Market
Bio simulation Market REPORT HIGHLIGHTS
| Aspects | Details |
|---|---|
| Study Period | 2020-2034 |
| Base Year | 2025 |
| Estimated Year | 2026 |
| Forecast Period | 2026-2034 |
| Historical Period | 2020-2025 |
| Growth Rate | CAGR of 16.7% from 2020-2034 |
| Segmentation |
|
Table of Contents
- 1. Introduction
- 1.1. Research Scope
- 1.2. Market Segmentation
- 1.3. Research Objective
- 1.4. Definitions and Assumptions
- 2. Executive Summary
- 2.1. Market Snapshot
- 3. Market Dynamics
- 3.1. Market Drivers
- 3.2. Market Restrains
- 3.3. Market Trends
- 3.4. Market Opportunities
- 4. Market Factor Analysis
- 4.1. Porters Five Forces
- 4.1.1. Bargaining Power of Suppliers
- 4.1.2. Bargaining Power of Buyers
- 4.1.3. Threat of New Entrants
- 4.1.4. Threat of Substitutes
- 4.1.5. Competitive Rivalry
- 4.2. PESTEL analysis
- 4.3. BCG Analysis
- 4.3.1. Stars (High Growth, High Market Share)
- 4.3.2. Cash Cows (Low Growth, High Market Share)
- 4.3.3. Question Mark (High Growth, Low Market Share)
- 4.3.4. Dogs (Low Growth, Low Market Share)
- 4.4. Ansoff Matrix Analysis
- 4.5. Supply Chain Analysis
- 4.6. Regulatory Landscape
- 4.7. Current Market Potential and Opportunity Assessment (TAM–SAM–SOM Framework)
- 4.8. TIR Analyst Note
- 4.1. Porters Five Forces
- 5. Market Analysis, Insights and Forecast 2021-2033
- 5.1. Market Analysis, Insights and Forecast - by Product
- 5.1.1. Software
- 5.1.2. Services
- 5.2. Market Analysis, Insights and Forecast - by Application
- 5.2.1. Preclinical and Clinical Drug Development
- 5.2.2. Drug Discovery
- 5.2.3. Others
- 5.3. Market Analysis, Insights and Forecast - by End User
- 5.3.1. Pharmaceutical and Biotechnology Companies
- 5.3.2. Contract Research Organizations
- 5.3.3. Others
- 5.4. Market Analysis, Insights and Forecast - by Region
- 5.4.1. North America
- 5.4.2. Europe
- 5.4.3. Asia Pacific
- 5.4.4. Middle East and Africa
- 5.4.5. South America
- 5.1. Market Analysis, Insights and Forecast - by Product
- 6. Global Bio simulation Market Analysis, Insights and Forecast, 2021-2033
- 6.1. Market Analysis, Insights and Forecast - by Product
- 6.1.1. Software
- 6.1.2. Services
- 6.2. Market Analysis, Insights and Forecast - by Application
- 6.2.1. Preclinical and Clinical Drug Development
- 6.2.2. Drug Discovery
- 6.2.3. Others
- 6.3. Market Analysis, Insights and Forecast - by End User
- 6.3.1. Pharmaceutical and Biotechnology Companies
- 6.3.2. Contract Research Organizations
- 6.3.3. Others
- 6.1. Market Analysis, Insights and Forecast - by Product
- 7. North America Bio simulation Market Analysis, Insights and Forecast, 2020-2032
- 7.1. Market Analysis, Insights and Forecast - by Product
- 7.1.1. Software
- 7.1.2. Services
- 7.2. Market Analysis, Insights and Forecast - by Application
- 7.2.1. Preclinical and Clinical Drug Development
- 7.2.2. Drug Discovery
- 7.2.3. Others
- 7.3. Market Analysis, Insights and Forecast - by End User
- 7.3.1. Pharmaceutical and Biotechnology Companies
- 7.3.2. Contract Research Organizations
- 7.3.3. Others
- 7.1. Market Analysis, Insights and Forecast - by Product
- 8. Europe Bio simulation Market Analysis, Insights and Forecast, 2020-2032
- 8.1. Market Analysis, Insights and Forecast - by Product
- 8.1.1. Software
- 8.1.2. Services
- 8.2. Market Analysis, Insights and Forecast - by Application
- 8.2.1. Preclinical and Clinical Drug Development
- 8.2.2. Drug Discovery
- 8.2.3. Others
- 8.3. Market Analysis, Insights and Forecast - by End User
- 8.3.1. Pharmaceutical and Biotechnology Companies
- 8.3.2. Contract Research Organizations
- 8.3.3. Others
- 8.1. Market Analysis, Insights and Forecast - by Product
- 9. Asia Pacific Bio simulation Market Analysis, Insights and Forecast, 2020-2032
- 9.1. Market Analysis, Insights and Forecast - by Product
- 9.1.1. Software
- 9.1.2. Services
- 9.2. Market Analysis, Insights and Forecast - by Application
- 9.2.1. Preclinical and Clinical Drug Development
- 9.2.2. Drug Discovery
- 9.2.3. Others
- 9.3. Market Analysis, Insights and Forecast - by End User
- 9.3.1. Pharmaceutical and Biotechnology Companies
- 9.3.2. Contract Research Organizations
- 9.3.3. Others
- 9.1. Market Analysis, Insights and Forecast - by Product
- 10. Middle East and Africa Bio simulation Market Analysis, Insights and Forecast, 2020-2032
- 10.1. Market Analysis, Insights and Forecast - by Product
- 10.1.1. Software
- 10.1.2. Services
- 10.2. Market Analysis, Insights and Forecast - by Application
- 10.2.1. Preclinical and Clinical Drug Development
- 10.2.2. Drug Discovery
- 10.2.3. Others
- 10.3. Market Analysis, Insights and Forecast - by End User
- 10.3.1. Pharmaceutical and Biotechnology Companies
- 10.3.2. Contract Research Organizations
- 10.3.3. Others
- 10.1. Market Analysis, Insights and Forecast - by Product
- 11. South America Bio simulation Market Analysis, Insights and Forecast, 2020-2032
- 11.1. Market Analysis, Insights and Forecast - by Product
- 11.1.1. Software
- 11.1.2. Services
- 11.2. Market Analysis, Insights and Forecast - by Application
- 11.2.1. Preclinical and Clinical Drug Development
- 11.2.2. Drug Discovery
- 11.2.3. Others
- 11.3. Market Analysis, Insights and Forecast - by End User
- 11.3.1. Pharmaceutical and Biotechnology Companies
- 11.3.2. Contract Research Organizations
- 11.3.3. Others
- 11.1. Market Analysis, Insights and Forecast - by Product
- 12. Competitive Analysis
- 12.1. Company Profiles
- 12.1.1 Entelos Inc*List Not Exhaustive
- 12.1.1.1. Company Overview
- 12.1.1.2. Products
- 12.1.1.3. Company Financials
- 12.1.1.4. SWOT Analysis
- 12.1.2 Pharmaceutical Product Development LLC
- 12.1.2.1. Company Overview
- 12.1.2.2. Products
- 12.1.2.3. Company Financials
- 12.1.2.4. SWOT Analysis
- 12.1.3 In Silico Biosciences Inc
- 12.1.3.1. Company Overview
- 12.1.3.2. Products
- 12.1.3.3. Company Financials
- 12.1.3.4. SWOT Analysis
- 12.1.4 Schrodinger LLC
- 12.1.4.1. Company Overview
- 12.1.4.2. Products
- 12.1.4.3. Company Financials
- 12.1.4.4. SWOT Analysis
- 12.1.5 Compugen Inc
- 12.1.5.1. Company Overview
- 12.1.5.2. Products
- 12.1.5.3. Company Financials
- 12.1.5.4. SWOT Analysis
- 12.1.6 Biovia
- 12.1.6.1. Company Overview
- 12.1.6.2. Products
- 12.1.6.3. Company Financials
- 12.1.6.4. SWOT Analysis
- 12.1.7 Leadscope Inc
- 12.1.7.1. Company Overview
- 12.1.7.2. Products
- 12.1.7.3. Company Financials
- 12.1.7.4. SWOT Analysis
- 12.1.8 Certara L P
- 12.1.8.1. Company Overview
- 12.1.8.2. Products
- 12.1.8.3. Company Financials
- 12.1.8.4. SWOT Analysis
- 12.1.9 Simulations Plus Inc
- 12.1.9.1. Company Overview
- 12.1.9.2. Products
- 12.1.9.3. Company Financials
- 12.1.9.4. SWOT Analysis
- 12.1.10 Genedata
- 12.1.10.1. Company Overview
- 12.1.10.2. Products
- 12.1.10.3. Company Financials
- 12.1.10.4. SWOT Analysis
- 12.1.1 Entelos Inc*List Not Exhaustive
- 12.2. Market Entropy
- 12.2.1 Company's Key Areas Served
- 12.2.2 Recent Developments
- 12.3. Company Market Share Analysis 2025
- 12.3.1 Top 5 Companies Market Share Analysis
- 12.3.2 Top 3 Companies Market Share Analysis
- 12.4. List of Potential Customers
- 13. Research Methodology
List of Figures
- Figure 1: Global Bio simulation Market Revenue Breakdown (billion, %) by Region 2025 & 2033
- Figure 2: North America Bio simulation Market Revenue (billion), by Product 2025 & 2033
- Figure 3: North America Bio simulation Market Revenue Share (%), by Product 2025 & 2033
- Figure 4: North America Bio simulation Market Revenue (billion), by Application 2025 & 2033
- Figure 5: North America Bio simulation Market Revenue Share (%), by Application 2025 & 2033
- Figure 6: North America Bio simulation Market Revenue (billion), by End User 2025 & 2033
- Figure 7: North America Bio simulation Market Revenue Share (%), by End User 2025 & 2033
- Figure 8: North America Bio simulation Market Revenue (billion), by Country 2025 & 2033
- Figure 9: North America Bio simulation Market Revenue Share (%), by Country 2025 & 2033
- Figure 10: Europe Bio simulation Market Revenue (billion), by Product 2025 & 2033
- Figure 11: Europe Bio simulation Market Revenue Share (%), by Product 2025 & 2033
- Figure 12: Europe Bio simulation Market Revenue (billion), by Application 2025 & 2033
- Figure 13: Europe Bio simulation Market Revenue Share (%), by Application 2025 & 2033
- Figure 14: Europe Bio simulation Market Revenue (billion), by End User 2025 & 2033
- Figure 15: Europe Bio simulation Market Revenue Share (%), by End User 2025 & 2033
- Figure 16: Europe Bio simulation Market Revenue (billion), by Country 2025 & 2033
- Figure 17: Europe Bio simulation Market Revenue Share (%), by Country 2025 & 2033
- Figure 18: Asia Pacific Bio simulation Market Revenue (billion), by Product 2025 & 2033
- Figure 19: Asia Pacific Bio simulation Market Revenue Share (%), by Product 2025 & 2033
- Figure 20: Asia Pacific Bio simulation Market Revenue (billion), by Application 2025 & 2033
- Figure 21: Asia Pacific Bio simulation Market Revenue Share (%), by Application 2025 & 2033
- Figure 22: Asia Pacific Bio simulation Market Revenue (billion), by End User 2025 & 2033
- Figure 23: Asia Pacific Bio simulation Market Revenue Share (%), by End User 2025 & 2033
- Figure 24: Asia Pacific Bio simulation Market Revenue (billion), by Country 2025 & 2033
- Figure 25: Asia Pacific Bio simulation Market Revenue Share (%), by Country 2025 & 2033
- Figure 26: Middle East and Africa Bio simulation Market Revenue (billion), by Product 2025 & 2033
- Figure 27: Middle East and Africa Bio simulation Market Revenue Share (%), by Product 2025 & 2033
- Figure 28: Middle East and Africa Bio simulation Market Revenue (billion), by Application 2025 & 2033
- Figure 29: Middle East and Africa Bio simulation Market Revenue Share (%), by Application 2025 & 2033
- Figure 30: Middle East and Africa Bio simulation Market Revenue (billion), by End User 2025 & 2033
- Figure 31: Middle East and Africa Bio simulation Market Revenue Share (%), by End User 2025 & 2033
- Figure 32: Middle East and Africa Bio simulation Market Revenue (billion), by Country 2025 & 2033
- Figure 33: Middle East and Africa Bio simulation Market Revenue Share (%), by Country 2025 & 2033
- Figure 34: South America Bio simulation Market Revenue (billion), by Product 2025 & 2033
- Figure 35: South America Bio simulation Market Revenue Share (%), by Product 2025 & 2033
- Figure 36: South America Bio simulation Market Revenue (billion), by Application 2025 & 2033
- Figure 37: South America Bio simulation Market Revenue Share (%), by Application 2025 & 2033
- Figure 38: South America Bio simulation Market Revenue (billion), by End User 2025 & 2033
- Figure 39: South America Bio simulation Market Revenue Share (%), by End User 2025 & 2033
- Figure 40: South America Bio simulation Market Revenue (billion), by Country 2025 & 2033
- Figure 41: South America Bio simulation Market Revenue Share (%), by Country 2025 & 2033
List of Tables
- Table 1: Global Bio simulation Market Revenue billion Forecast, by Product 2020 & 2033
- Table 2: Global Bio simulation Market Revenue billion Forecast, by Application 2020 & 2033
- Table 3: Global Bio simulation Market Revenue billion Forecast, by End User 2020 & 2033
- Table 4: Global Bio simulation Market Revenue billion Forecast, by Region 2020 & 2033
- Table 5: Global Bio simulation Market Revenue billion Forecast, by Product 2020 & 2033
- Table 6: Global Bio simulation Market Revenue billion Forecast, by Application 2020 & 2033
- Table 7: Global Bio simulation Market Revenue billion Forecast, by End User 2020 & 2033
- Table 8: Global Bio simulation Market Revenue billion Forecast, by Country 2020 & 2033
- Table 9: United States Bio simulation Market Revenue (billion) Forecast, by Application 2020 & 2033
- Table 10: Canada Bio simulation Market Revenue (billion) Forecast, by Application 2020 & 2033
- Table 11: Mexico Bio simulation Market Revenue (billion) Forecast, by Application 2020 & 2033
- Table 12: Global Bio simulation Market Revenue billion Forecast, by Product 2020 & 2033
- Table 13: Global Bio simulation Market Revenue billion Forecast, by Application 2020 & 2033
- Table 14: Global Bio simulation Market Revenue billion Forecast, by End User 2020 & 2033
- Table 15: Global Bio simulation Market Revenue billion Forecast, by Country 2020 & 2033
- Table 16: Germany Bio simulation Market Revenue (billion) Forecast, by Application 2020 & 2033
- Table 17: United Kingdom Bio simulation Market Revenue (billion) Forecast, by Application 2020 & 2033
- Table 18: France Bio simulation Market Revenue (billion) Forecast, by Application 2020 & 2033
- Table 19: Italy Bio simulation Market Revenue (billion) Forecast, by Application 2020 & 2033
- Table 20: Spain Bio simulation Market Revenue (billion) Forecast, by Application 2020 & 2033
- Table 21: Rest of Europe Bio simulation Market Revenue (billion) Forecast, by Application 2020 & 2033
- Table 22: Global Bio simulation Market Revenue billion Forecast, by Product 2020 & 2033
- Table 23: Global Bio simulation Market Revenue billion Forecast, by Application 2020 & 2033
- Table 24: Global Bio simulation Market Revenue billion Forecast, by End User 2020 & 2033
- Table 25: Global Bio simulation Market Revenue billion Forecast, by Country 2020 & 2033
- Table 26: China Bio simulation Market Revenue (billion) Forecast, by Application 2020 & 2033
- Table 27: Japan Bio simulation Market Revenue (billion) Forecast, by Application 2020 & 2033
- Table 28: India Bio simulation Market Revenue (billion) Forecast, by Application 2020 & 2033
- Table 29: Australia Bio simulation Market Revenue (billion) Forecast, by Application 2020 & 2033
- Table 30: South Korea Bio simulation Market Revenue (billion) Forecast, by Application 2020 & 2033
- Table 31: Rest of Asia Pacific Bio simulation Market Revenue (billion) Forecast, by Application 2020 & 2033
- Table 32: Global Bio simulation Market Revenue billion Forecast, by Product 2020 & 2033
- Table 33: Global Bio simulation Market Revenue billion Forecast, by Application 2020 & 2033
- Table 34: Global Bio simulation Market Revenue billion Forecast, by End User 2020 & 2033
- Table 35: Global Bio simulation Market Revenue billion Forecast, by Country 2020 & 2033
- Table 36: GCC Bio simulation Market Revenue (billion) Forecast, by Application 2020 & 2033
- Table 37: South Africa Bio simulation Market Revenue (billion) Forecast, by Application 2020 & 2033
- Table 38: Rest of Middle East and Africa Bio simulation Market Revenue (billion) Forecast, by Application 2020 & 2033
- Table 39: Global Bio simulation Market Revenue billion Forecast, by Product 2020 & 2033
- Table 40: Global Bio simulation Market Revenue billion Forecast, by Application 2020 & 2033
- Table 41: Global Bio simulation Market Revenue billion Forecast, by End User 2020 & 2033
- Table 42: Global Bio simulation Market Revenue billion Forecast, by Country 2020 & 2033
- Table 43: Brazil Bio simulation Market Revenue (billion) Forecast, by Application 2020 & 2033
- Table 44: Argentina Bio simulation Market Revenue (billion) Forecast, by Application 2020 & 2033
- Table 45: Rest of South America Bio simulation Market Revenue (billion) Forecast, by Application 2020 & 2033
Frequently Asked Questions
1. What is the projected Compound Annual Growth Rate (CAGR) of the Bio simulation Market?
The projected CAGR is approximately 16.7%.
2. Which companies are prominent players in the Bio simulation Market?
Key companies in the market include Entelos Inc*List Not Exhaustive, Pharmaceutical Product Development LLC, In Silico Biosciences Inc, Schrodinger LLC, Compugen Inc, Biovia, Leadscope Inc, Certara L P, Simulations Plus Inc, Genedata.
3. What are the main segments of the Bio simulation Market?
The market segments include Product, Application, End User.
4. Can you provide details about the market size?
The market size is estimated to be USD 4.24 billion as of 2022.
5. What are some drivers contributing to market growth?
Increasing Healthcare Expenditure; Growing Adoption of Biosimulation Software; High Drug Discovery and Development Costs.
6. What are the notable trends driving market growth?
Software Segment is Expected to Show Significant Growth Over the Forecast Period.
7. Are there any restraints impacting market growth?
Lack of Awareness Among Healthcare Professionals; Lack of Skilled Personnel.
8. Can you provide examples of recent developments in the market?
In June 2022, Certara announced a launch of a new version of its Immunogenicity (IG), Immuno-Oncology (IO), and Vaccine Simulators to help predict how drugs work and address key questions in the development of novel biologic therapies.
9. What pricing options are available for accessing the report?
Pricing options include single-user, multi-user, and enterprise licenses priced at USD 4750, USD 5250, and USD 8750 respectively.
10. Is the market size provided in terms of value or volume?
The market size is provided in terms of value, measured in billion.
11. Are there any specific market keywords associated with the report?
Yes, the market keyword associated with the report is "Bio simulation Market," which aids in identifying and referencing the specific market segment covered.
12. How do I determine which pricing option suits my needs best?
The pricing options vary based on user requirements and access needs. Individual users may opt for single-user licenses, while businesses requiring broader access may choose multi-user or enterprise licenses for cost-effective access to the report.
13. Are there any additional resources or data provided in the Bio simulation Market report?
While the report offers comprehensive insights, it's advisable to review the specific contents or supplementary materials provided to ascertain if additional resources or data are available.
14. How can I stay updated on further developments or reports in the Bio simulation Market?
To stay informed about further developments, trends, and reports in the Bio simulation Market, consider subscribing to industry newsletters, following relevant companies and organizations, or regularly checking reputable industry news sources and publications.
Methodology
Step 1 - Identification of Relevant Samples Size from Population Database


Step 2 - Approaches for Defining Global Market Size (Value, Volume* & Price*)

Note*: In applicable scenarios
Step 3 - Data Sources
Primary Research
- Web Analytics
- Survey Reports
- Research Institute
- Latest Research Reports
- Opinion Leaders
Secondary Research
- Annual Reports
- White Paper
- Latest Press Release
- Industry Association
- Paid Database
- Investor Presentations

Step 4 - Data Triangulation
Involves using different sources of information in order to increase the validity of a study
These sources are likely to be stakeholders in a program - participants, other researchers, program staff, other community members, and so on.
Then we put all data in single framework & apply various statistical tools to find out the dynamic on the market.
During the analysis stage, feedback from the stakeholder groups would be compared to determine areas of agreement as well as areas of divergence