

Key Insights
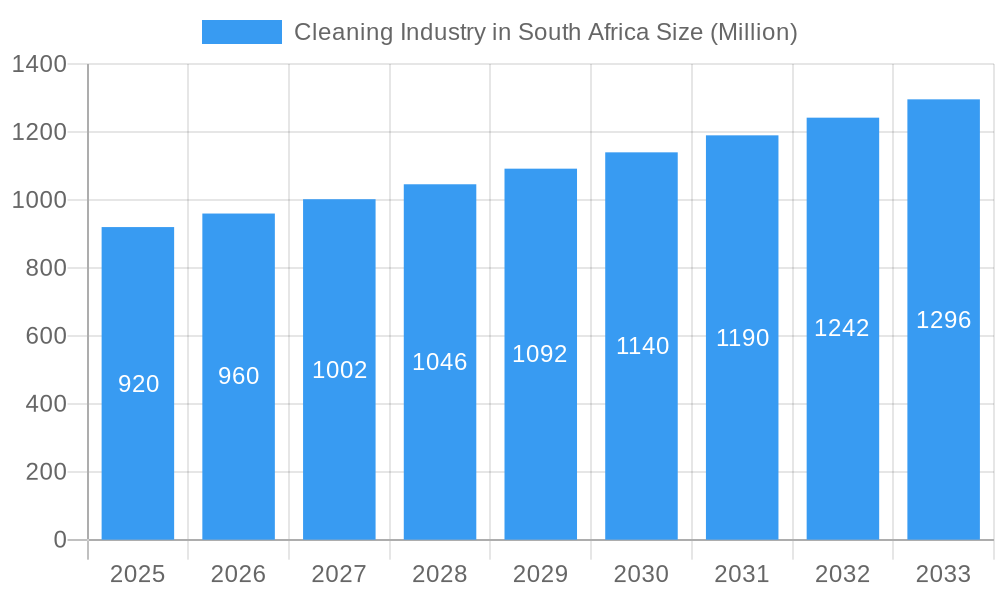
The South African cleaning industry, valued at $0.92 billion in 2025, is projected to experience robust growth, driven by increasing urbanization, rising disposable incomes, and a growing awareness of hygiene and sanitation. The market's Compound Annual Growth Rate (CAGR) of 4.38% from 2019-2033 signals a steady expansion. Key segments driving this growth include commercial/industrial cleaning, fueled by the increasing number of businesses and infrastructure projects, and online sales channels, reflecting a broader shift towards e-commerce. While the offline channel remains dominant, the online segment is expected to see significant growth due to convenience and wider product accessibility. Product demand is diverse, encompassing cleaning equipment, and consumables such as chemicals, powders, and gels. Major players like Dyson, Nilfisk, and Karcher, alongside several local South African companies, compete for market share. The industry faces challenges including economic fluctuations and potential supply chain disruptions, however, the long-term outlook remains positive, fueled by sustained demand for cleaning solutions in both residential and commercial sectors across major cities like Johannesburg, Cape Town, and Durban. The forecast indicates a consistent expansion throughout the projection period, with the market size expected to surpass $1.3 billion by 2033.
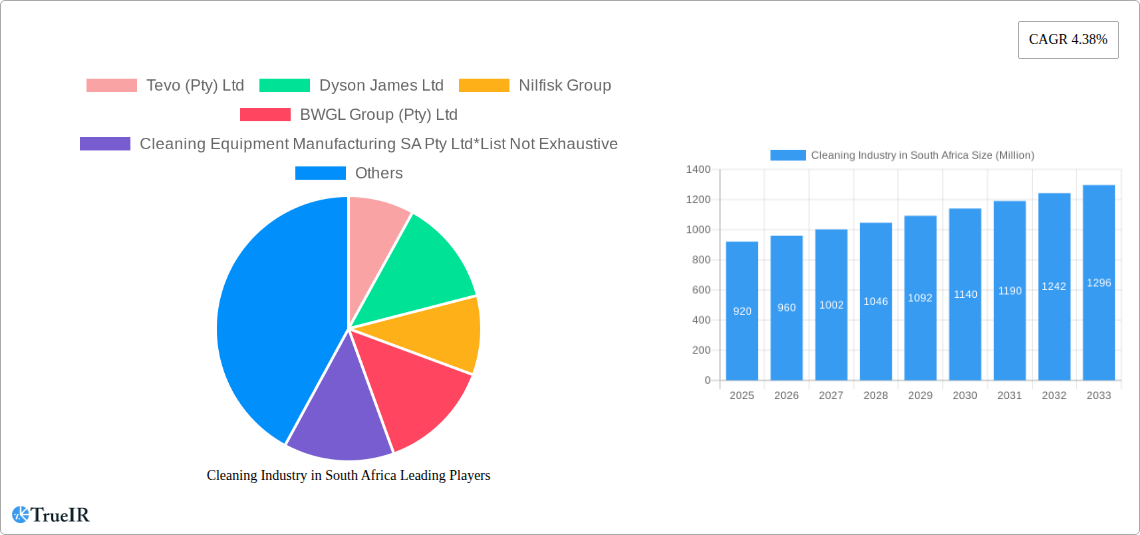
Cleaning Industry in South Africa Market Size (In Million)
The continued growth trajectory is supported by increasing government initiatives promoting hygiene standards and infrastructural development. Furthermore, the rising popularity of eco-friendly cleaning products presents a significant opportunity for market players to cater to environmentally conscious consumers. The competitive landscape will likely see increased consolidation and innovation, with established players investing in technology to enhance efficiency and product offerings, and new entrants seeking to establish a foothold in specific market niches. The residential sector, while exhibiting steady growth, will likely see slower expansion compared to the commercial/industrial segment due to the nature of market dynamics in individual consumer purchasing patterns. The diverse end-user segments offer significant scope for targeted marketing and product diversification.
Cleaning Industry in South Africa Company Market Share
Cleaning Industry in South Africa: A Comprehensive Market Report (2019-2033)
This dynamic report provides a deep dive into the South African cleaning industry, offering invaluable insights for businesses, investors, and policymakers. Analyzing market trends from 2019 to 2024 and projecting growth until 2033, this report covers market size, segmentation, competitive landscape, and key growth drivers. Discover the opportunities and challenges shaping this Rxx Million industry, with a focus on key players like Tevo (Pty) Ltd, Dyson James Ltd, and more.
Cleaning Industry in South Africa Market Structure & Competitive Landscape
The South African cleaning industry, valued at Rxx Million in 2024, exhibits a moderately concentrated market structure. The Herfindahl-Hirschman Index (HHI) is estimated at xx, indicating a balance between larger established players and smaller, more specialized firms. Innovation is a key driver, with companies continuously developing eco-friendly products and technologically advanced cleaning equipment. Stringent regulations regarding chemical composition and waste disposal significantly impact industry practices. Product substitutes, such as DIY cleaning solutions, exert moderate pressure.
The end-user segment is broadly divided into residential and commercial/industrial, with the latter accounting for a larger market share due to consistent demand from offices, healthcare facilities, and industrial complexes. Mergers and acquisitions (M&A) activity has been moderate in recent years, with an estimated xx number of deals between 2019 and 2024, driven primarily by the consolidation of distribution networks and expansion into new product categories.
- Market Concentration: Moderately concentrated, HHI at xx.
- Innovation Drivers: Eco-friendly products, advanced equipment.
- Regulatory Impacts: Stringent rules on chemicals and waste.
- Product Substitutes: DIY cleaning solutions.
- End-User Segmentation: Residential and Commercial/Industrial.
- M&A Trends: Moderate activity, xx deals between 2019-2024.
Cleaning Industry in South Africa Market Trends & Opportunities
The South African cleaning industry is poised for significant expansion, with projections indicating a Compound Annual Growth Rate (CAGR) of [Insert Specific CAGR % Here] during the forecast period (2025-2033). This upward trajectory is anticipated to culminate in a market valuation of R[Insert Specific Market Value in Millions Here] by 2033. Key catalysts for this robust growth include escalating urbanization, a rise in disposable incomes, a heightened public consciousness regarding hygiene standards, and the increasing adoption of cutting-edge, technologically advanced cleaning solutions. Despite this growth, the market penetration of sophisticated cleaning equipment remains relatively nascent, presenting substantial opportunities for innovative companies to establish a strong foothold. Furthermore, a pronounced shift towards sustainable and eco-friendly cleaning products is a defining trend, largely influenced by growing environmental awareness among consumers and the implementation of more stringent environmental regulations. The competitive landscape is characterized by a dual dynamic: fierce competition among established industry leaders and the emergence of agile, innovative startups carving out specialized niches.
Dominant Markets & Segments in Cleaning Industry in South Africa
The commercial/industrial segment dominates the South African cleaning industry, accounting for xx% of the total market value in 2024. This is primarily driven by the high demand for cleaning services across various sectors, including healthcare, hospitality, and manufacturing. The offline distribution channel currently holds the largest market share, but the online channel is experiencing rapid growth, driven by e-commerce expansion and increasing digital adoption amongst consumers. Within product types, cleaning equipment holds a larger share than other cleaning equipment (consumables, chemicals, powders and gels), however, the latter is experiencing a faster growth rate due to ongoing innovation in environmentally friendly solutions.
- Key Growth Drivers (Commercial/Industrial Segment): Increasing urbanization, expanding industrial sector, stringent hygiene standards in healthcare.
- Key Growth Drivers (Online Channel): E-commerce expansion, increased digital adoption, convenience.
- Key Growth Drivers (Other Cleaning Equipment): Innovation in eco-friendly products, growing preference for specialized cleaning solutions.
Cleaning Industry in South Africa Product Analysis
Product innovation is a constant in the South African cleaning industry. Recent breakthroughs showcase a range of advancements, including the development of environmentally responsible cleaning solutions, the advent of cordless and automated cleaning equipment, and the creation of specialized products meticulously designed to address unique cleaning requirements. These innovations are predominantly driven by consumer demand for greater convenience, superior effectiveness, and a commitment to sustainability. The market is increasingly integrating smart technology into cleaning apparatus, thereby enhancing operational efficiency and elevating the overall user experience. The paramount importance placed on hygiene and sanitation, particularly amplified in the post-pandemic era, continues to fuel a strong demand for high-performance, germ-reducing cleaning solutions.
Key Drivers, Barriers & Challenges in Cleaning Industry in South Africa
Key Drivers: An expanding urban population coupled with rising disposable incomes are significant economic propellers. Heightened awareness surrounding hygiene and sanitation practices across both domestic and commercial spheres plays a crucial role. The continuous evolution and adoption of technological advancements in cleaning equipment and solutions offer enhanced efficiency and effectiveness. Supportive government initiatives aimed at promoting public sanitation and environmental protection also contribute positively to market growth.
Challenges: The industry faces hurdles such as potential supply chain disruptions that can impact the availability and cost of essential raw materials. A consistent rise in raw material prices can squeeze profit margins. Intense competition among existing market players often leads to price wars and necessitates strategic differentiation. Navigating complex regulatory landscapes, particularly concerning chemical composition, product safety, and waste disposal protocols, presents an ongoing challenge. These combined challenges are estimated to exert a moderate impact, potentially curbing annual market growth by approximately [Insert Specific Reduction Percentage Here]%.
Growth Drivers in the Cleaning Industry in South Africa Market
The South African cleaning market's expansion is significantly influenced by several key factors. Increasing disposable incomes empower consumers and businesses to invest more in cleaning products and services. Urbanization drives a greater demand for professional cleaning services in residential, commercial, and industrial spaces. Stringent hygiene regulations being implemented across various sectors, from healthcare to hospitality, necessitate higher standards of cleanliness. There's a discernible and growing consumer preference for cleaning products that are environmentally friendly and sustainable. Furthermore, technological advancements, exemplified by the introduction of intelligent cleaning equipment and autonomous robotic solutions, are actively propelling market growth by offering enhanced efficiency and novel cleaning methodologies.
Challenges Impacting Cleaning Industry in South Africa Growth
Several significant challenges continue to affect the growth trajectory of the cleaning industry in South Africa. Vulnerabilities within the supply chain can lead to unpredictable availability of raw materials and volatile cost fluctuations. The intensifying competition among market participants can result in considerable price pressure, impacting profitability. Navigating the complexities of regulatory frameworks governing product safety, chemical usage, and environmental compliance adds layers of difficulty to product development and distribution strategies. Fluctuations in exchange rates also pose a challenge, particularly for businesses reliant on imported raw materials or finished goods, impacting overall import costs and market competitiveness.
Key Players Shaping the Cleaning Industry in South Africa Market
- Tevo (Pty) Ltd
- Dyson James Ltd
- Nilfisk Group
- BWGL Group (Pty) Ltd
- Cleaning Equipment Manufacturing SA Pty Ltd
- Chemstrat
- Robert Bosch GmbH
- Alfred Karcher SE & Co KG
- Miele & Cie KG
- Nu-World Holdings Ltd
Significant Cleaning Industry in South Africa Industry Milestones
- July 2021: Samsung launched its Samsung Jet cordless stick vacuum cleaner with an innovative clean station.
- October 2021: Unilever SA launched Sunlight, a dishwashing liquid utilizing captured carbon emissions.
- November 2021: BWGL Group (Pty) Ltd launched a new range of eco-friendly cleaning products under the Lioness brand.
Future Outlook for Cleaning Industry in South Africa Market
The South African cleaning industry is poised for sustained growth, driven by ongoing urbanization, rising disposable incomes, and a heightened focus on hygiene and sustainability. Opportunities exist in developing innovative, eco-friendly cleaning solutions, expanding into underserved markets, and leveraging technology to improve efficiency and user experience. Strategic partnerships and investments in research and development will be crucial for achieving long-term success in this dynamic market.
Cleaning Industry in South Africa Segmentation
-
1. Product Type
-
1.1. Cleaning Equipment
- 1.1.1. Vaccum Cleaners
- 1.1.2. Steam Cleaners
- 1.1.3. High-Pressure Cleaners
- 1.1.4. Scrubbers/Polishers
- 1.1.5. Other Cleaning Equipement
- 1.2. Consumables
- 1.3. Chemicals, Powders and Gels
-
1.1. Cleaning Equipment
-
2. End User
- 2.1. Residential
- 2.2. Commercial/Industrial
-
3. Distribution Channel
- 3.1. Offline Channel
- 3.2. Online Channel
Cleaning Industry in South Africa Segmentation By Geography
-
1. North America
- 1.1. United States
- 1.2. Canada
- 1.3. Mexico
-
2. South America
- 2.1. Brazil
- 2.2. Argentina
- 2.3. Rest of South America
-
3. Europe
- 3.1. United Kingdom
- 3.2. Germany
- 3.3. France
- 3.4. Italy
- 3.5. Spain
- 3.6. Russia
- 3.7. Benelux
- 3.8. Nordics
- 3.9. Rest of Europe
-
4. Middle East & Africa
- 4.1. Turkey
- 4.2. Israel
- 4.3. GCC
- 4.4. North Africa
- 4.5. South Africa
- 4.6. Rest of Middle East & Africa
-
5. Asia Pacific
- 5.1. China
- 5.2. India
- 5.3. Japan
- 5.4. South Korea
- 5.5. ASEAN
- 5.6. Oceania
- 5.7. Rest of Asia Pacific
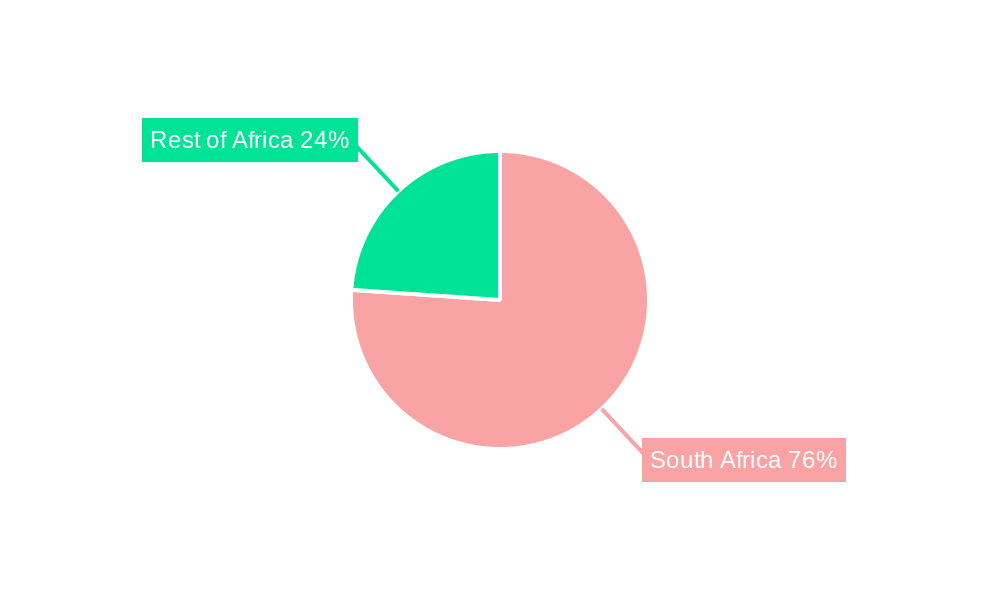
Cleaning Industry in South Africa Regional Market Share
Geographic Coverage of Cleaning Industry in South Africa
Cleaning Industry in South Africa REPORT HIGHLIGHTS
| Aspects | Details |
|---|---|
| Study Period | 2020-2034 |
| Base Year | 2025 |
| Estimated Year | 2026 |
| Forecast Period | 2026-2034 |
| Historical Period | 2020-2025 |
| Growth Rate | CAGR of 4.38% from 2020-2034 |
| Segmentation |
|
Table of Contents
- 1. Introduction
- 1.1. Research Scope
- 1.2. Market Segmentation
- 1.3. Research Objective
- 1.4. Definitions and Assumptions
- 2. Executive Summary
- 2.1. Market Snapshot
- 3. Market Dynamics
- 3.1. Market Drivers
- 3.2. Market Restrains
- 3.3. Market Trends
- 3.4. Market Opportunities
- 4. Market Factor Analysis
- 4.1. Porters Five Forces
- 4.1.1. Bargaining Power of Suppliers
- 4.1.2. Bargaining Power of Buyers
- 4.1.3. Threat of New Entrants
- 4.1.4. Threat of Substitutes
- 4.1.5. Competitive Rivalry
- 4.2. PESTEL analysis
- 4.3. BCG Analysis
- 4.3.1. Stars (High Growth, High Market Share)
- 4.3.2. Cash Cows (Low Growth, High Market Share)
- 4.3.3. Question Mark (High Growth, Low Market Share)
- 4.3.4. Dogs (Low Growth, Low Market Share)
- 4.4. Ansoff Matrix Analysis
- 4.5. Supply Chain Analysis
- 4.6. Regulatory Landscape
- 4.7. Current Market Potential and Opportunity Assessment (TAM–SAM–SOM Framework)
- 4.8. TIR Analyst Note
- 4.1. Porters Five Forces
- 5. Market Analysis, Insights and Forecast 2021-2033
- 5.1. Market Analysis, Insights and Forecast - by Product Type
- 5.1.1. Cleaning Equipment
- 5.1.1.1. Vaccum Cleaners
- 5.1.1.2. Steam Cleaners
- 5.1.1.3. High-Pressure Cleaners
- 5.1.1.4. Scrubbers/Polishers
- 5.1.1.5. Other Cleaning Equipement
- 5.1.2. Consumables
- 5.1.3. Chemicals, Powders and Gels
- 5.1.1. Cleaning Equipment
- 5.2. Market Analysis, Insights and Forecast - by End User
- 5.2.1. Residential
- 5.2.2. Commercial/Industrial
- 5.3. Market Analysis, Insights and Forecast - by Distribution Channel
- 5.3.1. Offline Channel
- 5.3.2. Online Channel
- 5.4. Market Analysis, Insights and Forecast - by Region
- 5.4.1. North America
- 5.4.2. South America
- 5.4.3. Europe
- 5.4.4. Middle East & Africa
- 5.4.5. Asia Pacific
- 5.1. Market Analysis, Insights and Forecast - by Product Type
- 6. Global Cleaning Industry in South Africa Analysis, Insights and Forecast, 2021-2033
- 6.1. Market Analysis, Insights and Forecast - by Product Type
- 6.1.1. Cleaning Equipment
- 6.1.1.1. Vaccum Cleaners
- 6.1.1.2. Steam Cleaners
- 6.1.1.3. High-Pressure Cleaners
- 6.1.1.4. Scrubbers/Polishers
- 6.1.1.5. Other Cleaning Equipement
- 6.1.2. Consumables
- 6.1.3. Chemicals, Powders and Gels
- 6.1.1. Cleaning Equipment
- 6.2. Market Analysis, Insights and Forecast - by End User
- 6.2.1. Residential
- 6.2.2. Commercial/Industrial
- 6.3. Market Analysis, Insights and Forecast - by Distribution Channel
- 6.3.1. Offline Channel
- 6.3.2. Online Channel
- 6.1. Market Analysis, Insights and Forecast - by Product Type
- 7. North America Cleaning Industry in South Africa Analysis, Insights and Forecast, 2020-2032
- 7.1. Market Analysis, Insights and Forecast - by Product Type
- 7.1.1. Cleaning Equipment
- 7.1.1.1. Vaccum Cleaners
- 7.1.1.2. Steam Cleaners
- 7.1.1.3. High-Pressure Cleaners
- 7.1.1.4. Scrubbers/Polishers
- 7.1.1.5. Other Cleaning Equipement
- 7.1.2. Consumables
- 7.1.3. Chemicals, Powders and Gels
- 7.1.1. Cleaning Equipment
- 7.2. Market Analysis, Insights and Forecast - by End User
- 7.2.1. Residential
- 7.2.2. Commercial/Industrial
- 7.3. Market Analysis, Insights and Forecast - by Distribution Channel
- 7.3.1. Offline Channel
- 7.3.2. Online Channel
- 7.1. Market Analysis, Insights and Forecast - by Product Type
- 8. South America Cleaning Industry in South Africa Analysis, Insights and Forecast, 2020-2032
- 8.1. Market Analysis, Insights and Forecast - by Product Type
- 8.1.1. Cleaning Equipment
- 8.1.1.1. Vaccum Cleaners
- 8.1.1.2. Steam Cleaners
- 8.1.1.3. High-Pressure Cleaners
- 8.1.1.4. Scrubbers/Polishers
- 8.1.1.5. Other Cleaning Equipement
- 8.1.2. Consumables
- 8.1.3. Chemicals, Powders and Gels
- 8.1.1. Cleaning Equipment
- 8.2. Market Analysis, Insights and Forecast - by End User
- 8.2.1. Residential
- 8.2.2. Commercial/Industrial
- 8.3. Market Analysis, Insights and Forecast - by Distribution Channel
- 8.3.1. Offline Channel
- 8.3.2. Online Channel
- 8.1. Market Analysis, Insights and Forecast - by Product Type
- 9. Europe Cleaning Industry in South Africa Analysis, Insights and Forecast, 2020-2032
- 9.1. Market Analysis, Insights and Forecast - by Product Type
- 9.1.1. Cleaning Equipment
- 9.1.1.1. Vaccum Cleaners
- 9.1.1.2. Steam Cleaners
- 9.1.1.3. High-Pressure Cleaners
- 9.1.1.4. Scrubbers/Polishers
- 9.1.1.5. Other Cleaning Equipement
- 9.1.2. Consumables
- 9.1.3. Chemicals, Powders and Gels
- 9.1.1. Cleaning Equipment
- 9.2. Market Analysis, Insights and Forecast - by End User
- 9.2.1. Residential
- 9.2.2. Commercial/Industrial
- 9.3. Market Analysis, Insights and Forecast - by Distribution Channel
- 9.3.1. Offline Channel
- 9.3.2. Online Channel
- 9.1. Market Analysis, Insights and Forecast - by Product Type
- 10. Middle East & Africa Cleaning Industry in South Africa Analysis, Insights and Forecast, 2020-2032
- 10.1. Market Analysis, Insights and Forecast - by Product Type
- 10.1.1. Cleaning Equipment
- 10.1.1.1. Vaccum Cleaners
- 10.1.1.2. Steam Cleaners
- 10.1.1.3. High-Pressure Cleaners
- 10.1.1.4. Scrubbers/Polishers
- 10.1.1.5. Other Cleaning Equipement
- 10.1.2. Consumables
- 10.1.3. Chemicals, Powders and Gels
- 10.1.1. Cleaning Equipment
- 10.2. Market Analysis, Insights and Forecast - by End User
- 10.2.1. Residential
- 10.2.2. Commercial/Industrial
- 10.3. Market Analysis, Insights and Forecast - by Distribution Channel
- 10.3.1. Offline Channel
- 10.3.2. Online Channel
- 10.1. Market Analysis, Insights and Forecast - by Product Type
- 11. Asia Pacific Cleaning Industry in South Africa Analysis, Insights and Forecast, 2020-2032
- 11.1. Market Analysis, Insights and Forecast - by Product Type
- 11.1.1. Cleaning Equipment
- 11.1.1.1. Vaccum Cleaners
- 11.1.1.2. Steam Cleaners
- 11.1.1.3. High-Pressure Cleaners
- 11.1.1.4. Scrubbers/Polishers
- 11.1.1.5. Other Cleaning Equipement
- 11.1.2. Consumables
- 11.1.3. Chemicals, Powders and Gels
- 11.1.1. Cleaning Equipment
- 11.2. Market Analysis, Insights and Forecast - by End User
- 11.2.1. Residential
- 11.2.2. Commercial/Industrial
- 11.3. Market Analysis, Insights and Forecast - by Distribution Channel
- 11.3.1. Offline Channel
- 11.3.2. Online Channel
- 11.1. Market Analysis, Insights and Forecast - by Product Type
- 12. Competitive Analysis
- 12.1. Company Profiles
- 12.1.1 Tevo (Pty) Ltd
- 12.1.1.1. Company Overview
- 12.1.1.2. Products
- 12.1.1.3. Company Financials
- 12.1.1.4. SWOT Analysis
- 12.1.2 Dyson James Ltd
- 12.1.2.1. Company Overview
- 12.1.2.2. Products
- 12.1.2.3. Company Financials
- 12.1.2.4. SWOT Analysis
- 12.1.3 Nilfisk Group
- 12.1.3.1. Company Overview
- 12.1.3.2. Products
- 12.1.3.3. Company Financials
- 12.1.3.4. SWOT Analysis
- 12.1.4 BWGL Group (Pty) Ltd
- 12.1.4.1. Company Overview
- 12.1.4.2. Products
- 12.1.4.3. Company Financials
- 12.1.4.4. SWOT Analysis
- 12.1.5 Cleaning Equipment Manufacturing SA Pty Ltd*List Not Exhaustive
- 12.1.5.1. Company Overview
- 12.1.5.2. Products
- 12.1.5.3. Company Financials
- 12.1.5.4. SWOT Analysis
- 12.1.6 Chemstrat
- 12.1.6.1. Company Overview
- 12.1.6.2. Products
- 12.1.6.3. Company Financials
- 12.1.6.4. SWOT Analysis
- 12.1.7 Robert Bosch GmbH
- 12.1.7.1. Company Overview
- 12.1.7.2. Products
- 12.1.7.3. Company Financials
- 12.1.7.4. SWOT Analysis
- 12.1.8 Alfred Karcher SE & Co KG
- 12.1.8.1. Company Overview
- 12.1.8.2. Products
- 12.1.8.3. Company Financials
- 12.1.8.4. SWOT Analysis
- 12.1.9 Miele & Cie KG
- 12.1.9.1. Company Overview
- 12.1.9.2. Products
- 12.1.9.3. Company Financials
- 12.1.9.4. SWOT Analysis
- 12.1.10 Nu-World Holdings Ltd
- 12.1.10.1. Company Overview
- 12.1.10.2. Products
- 12.1.10.3. Company Financials
- 12.1.10.4. SWOT Analysis
- 12.1.1 Tevo (Pty) Ltd
- 12.2. Market Entropy
- 12.2.1 Company's Key Areas Served
- 12.2.2 Recent Developments
- 12.3. Company Market Share Analysis 2025
- 12.3.1 Top 5 Companies Market Share Analysis
- 12.3.2 Top 3 Companies Market Share Analysis
- 12.4. List of Potential Customers
- 13. Research Methodology
List of Figures
- Figure 1: Global Cleaning Industry in South Africa Revenue Breakdown (Million, %) by Region 2025 & 2033
- Figure 2: North America Cleaning Industry in South Africa Revenue (Million), by Product Type 2025 & 2033
- Figure 3: North America Cleaning Industry in South Africa Revenue Share (%), by Product Type 2025 & 2033
- Figure 4: North America Cleaning Industry in South Africa Revenue (Million), by End User 2025 & 2033
- Figure 5: North America Cleaning Industry in South Africa Revenue Share (%), by End User 2025 & 2033
- Figure 6: North America Cleaning Industry in South Africa Revenue (Million), by Distribution Channel 2025 & 2033
- Figure 7: North America Cleaning Industry in South Africa Revenue Share (%), by Distribution Channel 2025 & 2033
- Figure 8: North America Cleaning Industry in South Africa Revenue (Million), by Country 2025 & 2033
- Figure 9: North America Cleaning Industry in South Africa Revenue Share (%), by Country 2025 & 2033
- Figure 10: South America Cleaning Industry in South Africa Revenue (Million), by Product Type 2025 & 2033
- Figure 11: South America Cleaning Industry in South Africa Revenue Share (%), by Product Type 2025 & 2033
- Figure 12: South America Cleaning Industry in South Africa Revenue (Million), by End User 2025 & 2033
- Figure 13: South America Cleaning Industry in South Africa Revenue Share (%), by End User 2025 & 2033
- Figure 14: South America Cleaning Industry in South Africa Revenue (Million), by Distribution Channel 2025 & 2033
- Figure 15: South America Cleaning Industry in South Africa Revenue Share (%), by Distribution Channel 2025 & 2033
- Figure 16: South America Cleaning Industry in South Africa Revenue (Million), by Country 2025 & 2033
- Figure 17: South America Cleaning Industry in South Africa Revenue Share (%), by Country 2025 & 2033
- Figure 18: Europe Cleaning Industry in South Africa Revenue (Million), by Product Type 2025 & 2033
- Figure 19: Europe Cleaning Industry in South Africa Revenue Share (%), by Product Type 2025 & 2033
- Figure 20: Europe Cleaning Industry in South Africa Revenue (Million), by End User 2025 & 2033
- Figure 21: Europe Cleaning Industry in South Africa Revenue Share (%), by End User 2025 & 2033
- Figure 22: Europe Cleaning Industry in South Africa Revenue (Million), by Distribution Channel 2025 & 2033
- Figure 23: Europe Cleaning Industry in South Africa Revenue Share (%), by Distribution Channel 2025 & 2033
- Figure 24: Europe Cleaning Industry in South Africa Revenue (Million), by Country 2025 & 2033
- Figure 25: Europe Cleaning Industry in South Africa Revenue Share (%), by Country 2025 & 2033
- Figure 26: Middle East & Africa Cleaning Industry in South Africa Revenue (Million), by Product Type 2025 & 2033
- Figure 27: Middle East & Africa Cleaning Industry in South Africa Revenue Share (%), by Product Type 2025 & 2033
- Figure 28: Middle East & Africa Cleaning Industry in South Africa Revenue (Million), by End User 2025 & 2033
- Figure 29: Middle East & Africa Cleaning Industry in South Africa Revenue Share (%), by End User 2025 & 2033
- Figure 30: Middle East & Africa Cleaning Industry in South Africa Revenue (Million), by Distribution Channel 2025 & 2033
- Figure 31: Middle East & Africa Cleaning Industry in South Africa Revenue Share (%), by Distribution Channel 2025 & 2033
- Figure 32: Middle East & Africa Cleaning Industry in South Africa Revenue (Million), by Country 2025 & 2033
- Figure 33: Middle East & Africa Cleaning Industry in South Africa Revenue Share (%), by Country 2025 & 2033
- Figure 34: Asia Pacific Cleaning Industry in South Africa Revenue (Million), by Product Type 2025 & 2033
- Figure 35: Asia Pacific Cleaning Industry in South Africa Revenue Share (%), by Product Type 2025 & 2033
- Figure 36: Asia Pacific Cleaning Industry in South Africa Revenue (Million), by End User 2025 & 2033
- Figure 37: Asia Pacific Cleaning Industry in South Africa Revenue Share (%), by End User 2025 & 2033
- Figure 38: Asia Pacific Cleaning Industry in South Africa Revenue (Million), by Distribution Channel 2025 & 2033
- Figure 39: Asia Pacific Cleaning Industry in South Africa Revenue Share (%), by Distribution Channel 2025 & 2033
- Figure 40: Asia Pacific Cleaning Industry in South Africa Revenue (Million), by Country 2025 & 2033
- Figure 41: Asia Pacific Cleaning Industry in South Africa Revenue Share (%), by Country 2025 & 2033
List of Tables
- Table 1: Global Cleaning Industry in South Africa Revenue Million Forecast, by Product Type 2020 & 2033
- Table 2: Global Cleaning Industry in South Africa Revenue Million Forecast, by End User 2020 & 2033
- Table 3: Global Cleaning Industry in South Africa Revenue Million Forecast, by Distribution Channel 2020 & 2033
- Table 4: Global Cleaning Industry in South Africa Revenue Million Forecast, by Region 2020 & 2033
- Table 5: Global Cleaning Industry in South Africa Revenue Million Forecast, by Product Type 2020 & 2033
- Table 6: Global Cleaning Industry in South Africa Revenue Million Forecast, by End User 2020 & 2033
- Table 7: Global Cleaning Industry in South Africa Revenue Million Forecast, by Distribution Channel 2020 & 2033
- Table 8: Global Cleaning Industry in South Africa Revenue Million Forecast, by Country 2020 & 2033
- Table 9: United States Cleaning Industry in South Africa Revenue (Million) Forecast, by Application 2020 & 2033
- Table 10: Canada Cleaning Industry in South Africa Revenue (Million) Forecast, by Application 2020 & 2033
- Table 11: Mexico Cleaning Industry in South Africa Revenue (Million) Forecast, by Application 2020 & 2033
- Table 12: Global Cleaning Industry in South Africa Revenue Million Forecast, by Product Type 2020 & 2033
- Table 13: Global Cleaning Industry in South Africa Revenue Million Forecast, by End User 2020 & 2033
- Table 14: Global Cleaning Industry in South Africa Revenue Million Forecast, by Distribution Channel 2020 & 2033
- Table 15: Global Cleaning Industry in South Africa Revenue Million Forecast, by Country 2020 & 2033
- Table 16: Brazil Cleaning Industry in South Africa Revenue (Million) Forecast, by Application 2020 & 2033
- Table 17: Argentina Cleaning Industry in South Africa Revenue (Million) Forecast, by Application 2020 & 2033
- Table 18: Rest of South America Cleaning Industry in South Africa Revenue (Million) Forecast, by Application 2020 & 2033
- Table 19: Global Cleaning Industry in South Africa Revenue Million Forecast, by Product Type 2020 & 2033
- Table 20: Global Cleaning Industry in South Africa Revenue Million Forecast, by End User 2020 & 2033
- Table 21: Global Cleaning Industry in South Africa Revenue Million Forecast, by Distribution Channel 2020 & 2033
- Table 22: Global Cleaning Industry in South Africa Revenue Million Forecast, by Country 2020 & 2033
- Table 23: United Kingdom Cleaning Industry in South Africa Revenue (Million) Forecast, by Application 2020 & 2033
- Table 24: Germany Cleaning Industry in South Africa Revenue (Million) Forecast, by Application 2020 & 2033
- Table 25: France Cleaning Industry in South Africa Revenue (Million) Forecast, by Application 2020 & 2033
- Table 26: Italy Cleaning Industry in South Africa Revenue (Million) Forecast, by Application 2020 & 2033
- Table 27: Spain Cleaning Industry in South Africa Revenue (Million) Forecast, by Application 2020 & 2033
- Table 28: Russia Cleaning Industry in South Africa Revenue (Million) Forecast, by Application 2020 & 2033
- Table 29: Benelux Cleaning Industry in South Africa Revenue (Million) Forecast, by Application 2020 & 2033
- Table 30: Nordics Cleaning Industry in South Africa Revenue (Million) Forecast, by Application 2020 & 2033
- Table 31: Rest of Europe Cleaning Industry in South Africa Revenue (Million) Forecast, by Application 2020 & 2033
- Table 32: Global Cleaning Industry in South Africa Revenue Million Forecast, by Product Type 2020 & 2033
- Table 33: Global Cleaning Industry in South Africa Revenue Million Forecast, by End User 2020 & 2033
- Table 34: Global Cleaning Industry in South Africa Revenue Million Forecast, by Distribution Channel 2020 & 2033
- Table 35: Global Cleaning Industry in South Africa Revenue Million Forecast, by Country 2020 & 2033
- Table 36: Turkey Cleaning Industry in South Africa Revenue (Million) Forecast, by Application 2020 & 2033
- Table 37: Israel Cleaning Industry in South Africa Revenue (Million) Forecast, by Application 2020 & 2033
- Table 38: GCC Cleaning Industry in South Africa Revenue (Million) Forecast, by Application 2020 & 2033
- Table 39: North Africa Cleaning Industry in South Africa Revenue (Million) Forecast, by Application 2020 & 2033
- Table 40: South Africa Cleaning Industry in South Africa Revenue (Million) Forecast, by Application 2020 & 2033
- Table 41: Rest of Middle East & Africa Cleaning Industry in South Africa Revenue (Million) Forecast, by Application 2020 & 2033
- Table 42: Global Cleaning Industry in South Africa Revenue Million Forecast, by Product Type 2020 & 2033
- Table 43: Global Cleaning Industry in South Africa Revenue Million Forecast, by End User 2020 & 2033
- Table 44: Global Cleaning Industry in South Africa Revenue Million Forecast, by Distribution Channel 2020 & 2033
- Table 45: Global Cleaning Industry in South Africa Revenue Million Forecast, by Country 2020 & 2033
- Table 46: China Cleaning Industry in South Africa Revenue (Million) Forecast, by Application 2020 & 2033
- Table 47: India Cleaning Industry in South Africa Revenue (Million) Forecast, by Application 2020 & 2033
- Table 48: Japan Cleaning Industry in South Africa Revenue (Million) Forecast, by Application 2020 & 2033
- Table 49: South Korea Cleaning Industry in South Africa Revenue (Million) Forecast, by Application 2020 & 2033
- Table 50: ASEAN Cleaning Industry in South Africa Revenue (Million) Forecast, by Application 2020 & 2033
- Table 51: Oceania Cleaning Industry in South Africa Revenue (Million) Forecast, by Application 2020 & 2033
- Table 52: Rest of Asia Pacific Cleaning Industry in South Africa Revenue (Million) Forecast, by Application 2020 & 2033
Frequently Asked Questions
1. What is the projected Compound Annual Growth Rate (CAGR) of the Cleaning Industry in South Africa?
The projected CAGR is approximately 4.38%.
2. Which companies are prominent players in the Cleaning Industry in South Africa?
Key companies in the market include Tevo (Pty) Ltd, Dyson James Ltd, Nilfisk Group, BWGL Group (Pty) Ltd, Cleaning Equipment Manufacturing SA Pty Ltd*List Not Exhaustive, Chemstrat, Robert Bosch GmbH, Alfred Karcher SE & Co KG, Miele & Cie KG, Nu-World Holdings Ltd.
3. What are the main segments of the Cleaning Industry in South Africa?
The market segments include Product Type, End User, Distribution Channel.
4. Can you provide details about the market size?
The market size is estimated to be USD 0.92 Million as of 2022.
5. What are some drivers contributing to market growth?
Rising Diabetic Population Across the Globe; Innovative and Fashionable Footwear.
6. What are the notable trends driving market growth?
Growing Penetration of Cleaning Products in Households.
7. Are there any restraints impacting market growth?
Enhanced Presence of Counterfeit and Poor-Quality Products.
8. Can you provide examples of recent developments in the market?
November 2021: South Africa's BWGL Group (Pty) Ltd, Lioness, launched a new range of natural and environmentally friendly cleaning products.
9. What pricing options are available for accessing the report?
Pricing options include single-user, multi-user, and enterprise licenses priced at USD 3800, USD 4500, and USD 5800 respectively.
10. Is the market size provided in terms of value or volume?
The market size is provided in terms of value, measured in Million.
11. Are there any specific market keywords associated with the report?
Yes, the market keyword associated with the report is "Cleaning Industry in South Africa," which aids in identifying and referencing the specific market segment covered.
12. How do I determine which pricing option suits my needs best?
The pricing options vary based on user requirements and access needs. Individual users may opt for single-user licenses, while businesses requiring broader access may choose multi-user or enterprise licenses for cost-effective access to the report.
13. Are there any additional resources or data provided in the Cleaning Industry in South Africa report?
While the report offers comprehensive insights, it's advisable to review the specific contents or supplementary materials provided to ascertain if additional resources or data are available.
14. How can I stay updated on further developments or reports in the Cleaning Industry in South Africa?
To stay informed about further developments, trends, and reports in the Cleaning Industry in South Africa, consider subscribing to industry newsletters, following relevant companies and organizations, or regularly checking reputable industry news sources and publications.
Methodology
Step 1 - Identification of Relevant Samples Size from Population Database


Step 2 - Approaches for Defining Global Market Size (Value, Volume* & Price*)

Note*: In applicable scenarios
Step 3 - Data Sources
Primary Research
- Web Analytics
- Survey Reports
- Research Institute
- Latest Research Reports
- Opinion Leaders
Secondary Research
- Annual Reports
- White Paper
- Latest Press Release
- Industry Association
- Paid Database
- Investor Presentations

Step 4 - Data Triangulation
Involves using different sources of information in order to increase the validity of a study
These sources are likely to be stakeholders in a program - participants, other researchers, program staff, other community members, and so on.
Then we put all data in single framework & apply various statistical tools to find out the dynamic on the market.
During the analysis stage, feedback from the stakeholder groups would be compared to determine areas of agreement as well as areas of divergence