

Key Insights
The global market for Contact Linear Position Sensors is poised for significant expansion, projected to reach an estimated $6.94 billion in 2024. This robust growth is driven by a CAGR of 9.28%, indicating a dynamic and expanding sector. A primary driver for this surge is the increasing adoption of automation across various industries, including automotive, mining, marine, food and beverages, and agriculture. These sectors rely heavily on precise linear position feedback for enhanced operational efficiency, safety, and quality control. The automotive industry, in particular, is a major consumer due to its integration of advanced driver-assistance systems (ADAS), electronic power steering, and other electronic components that demand accurate positional data. Furthermore, the growing emphasis on Industry 4.0 initiatives, which prioritize smart manufacturing and interconnected systems, further fuels the demand for reliable position sensing technologies. The ability of contact linear position sensors to provide high accuracy, repeatability, and cost-effectiveness in diverse operating environments makes them indispensable for modern industrial applications.
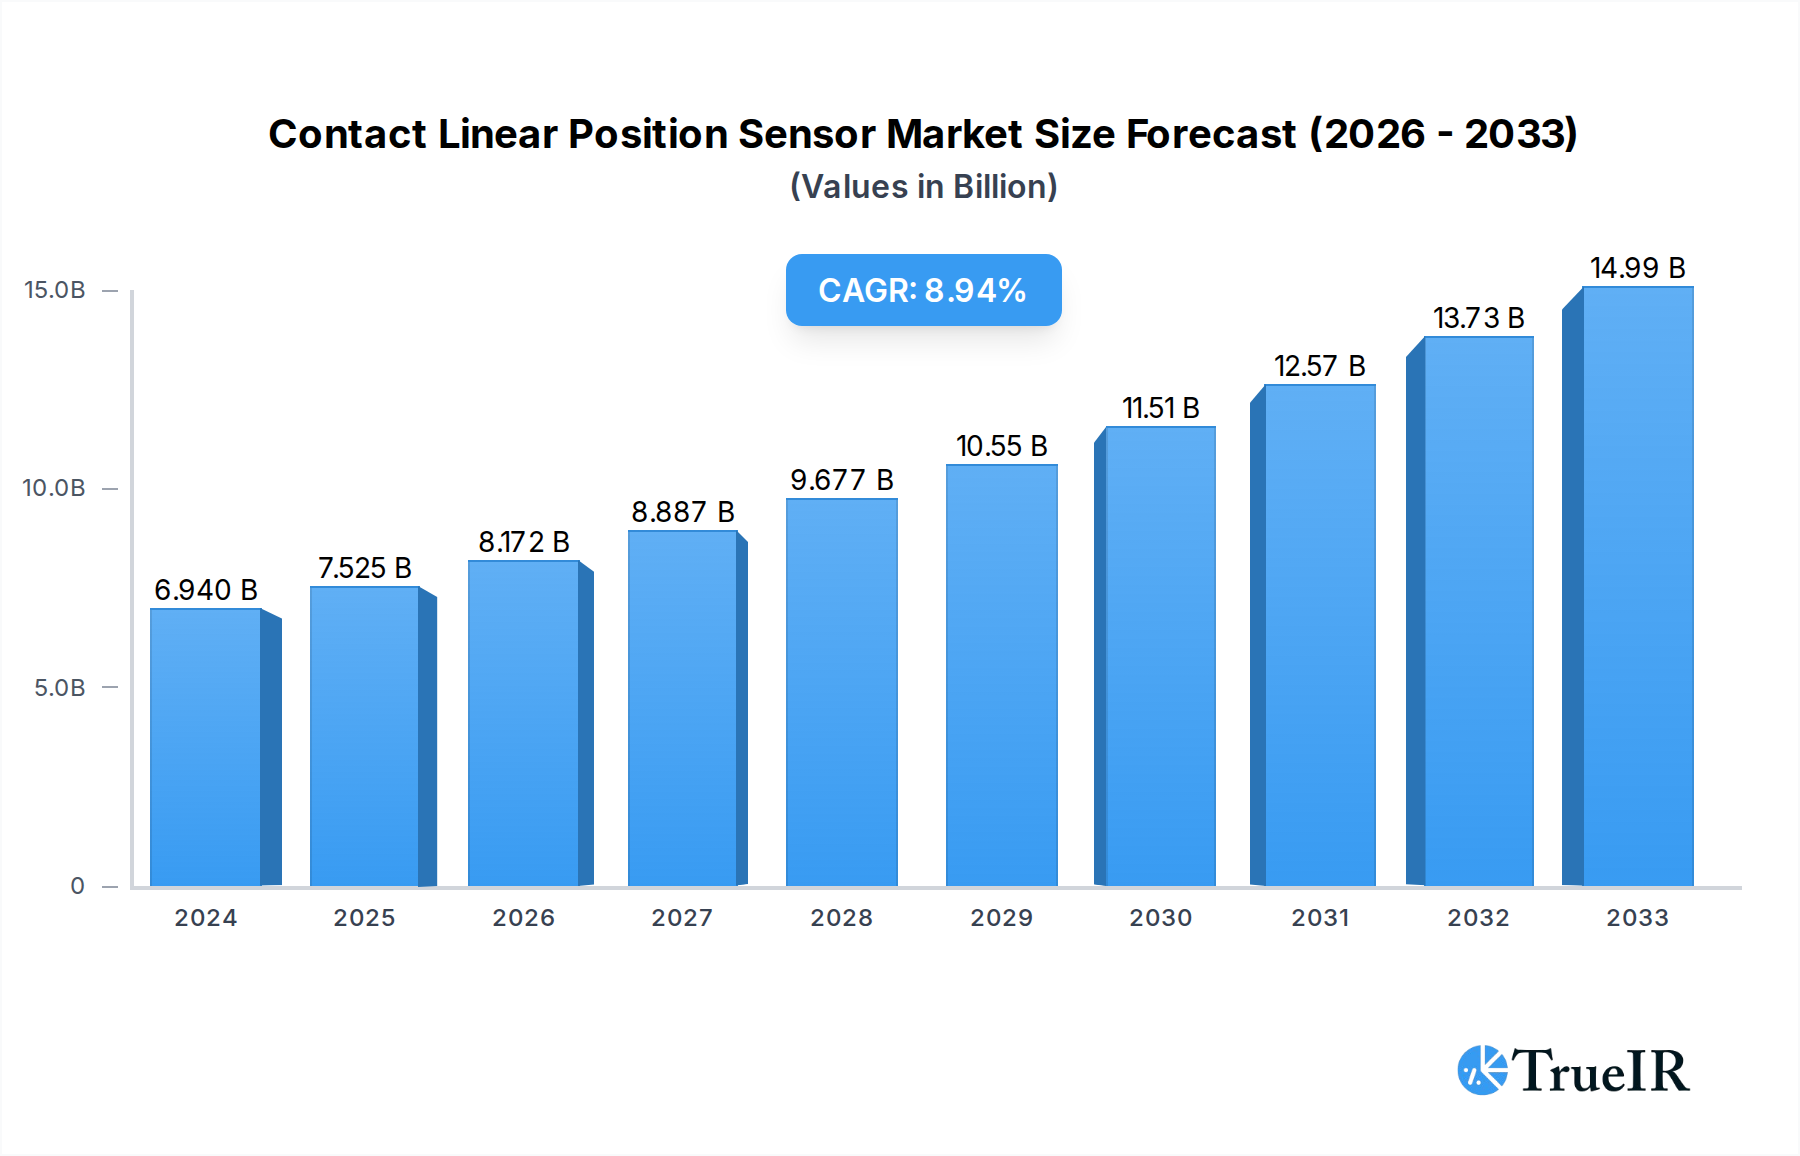
Contact Linear Position Sensor Market Size (In Billion)
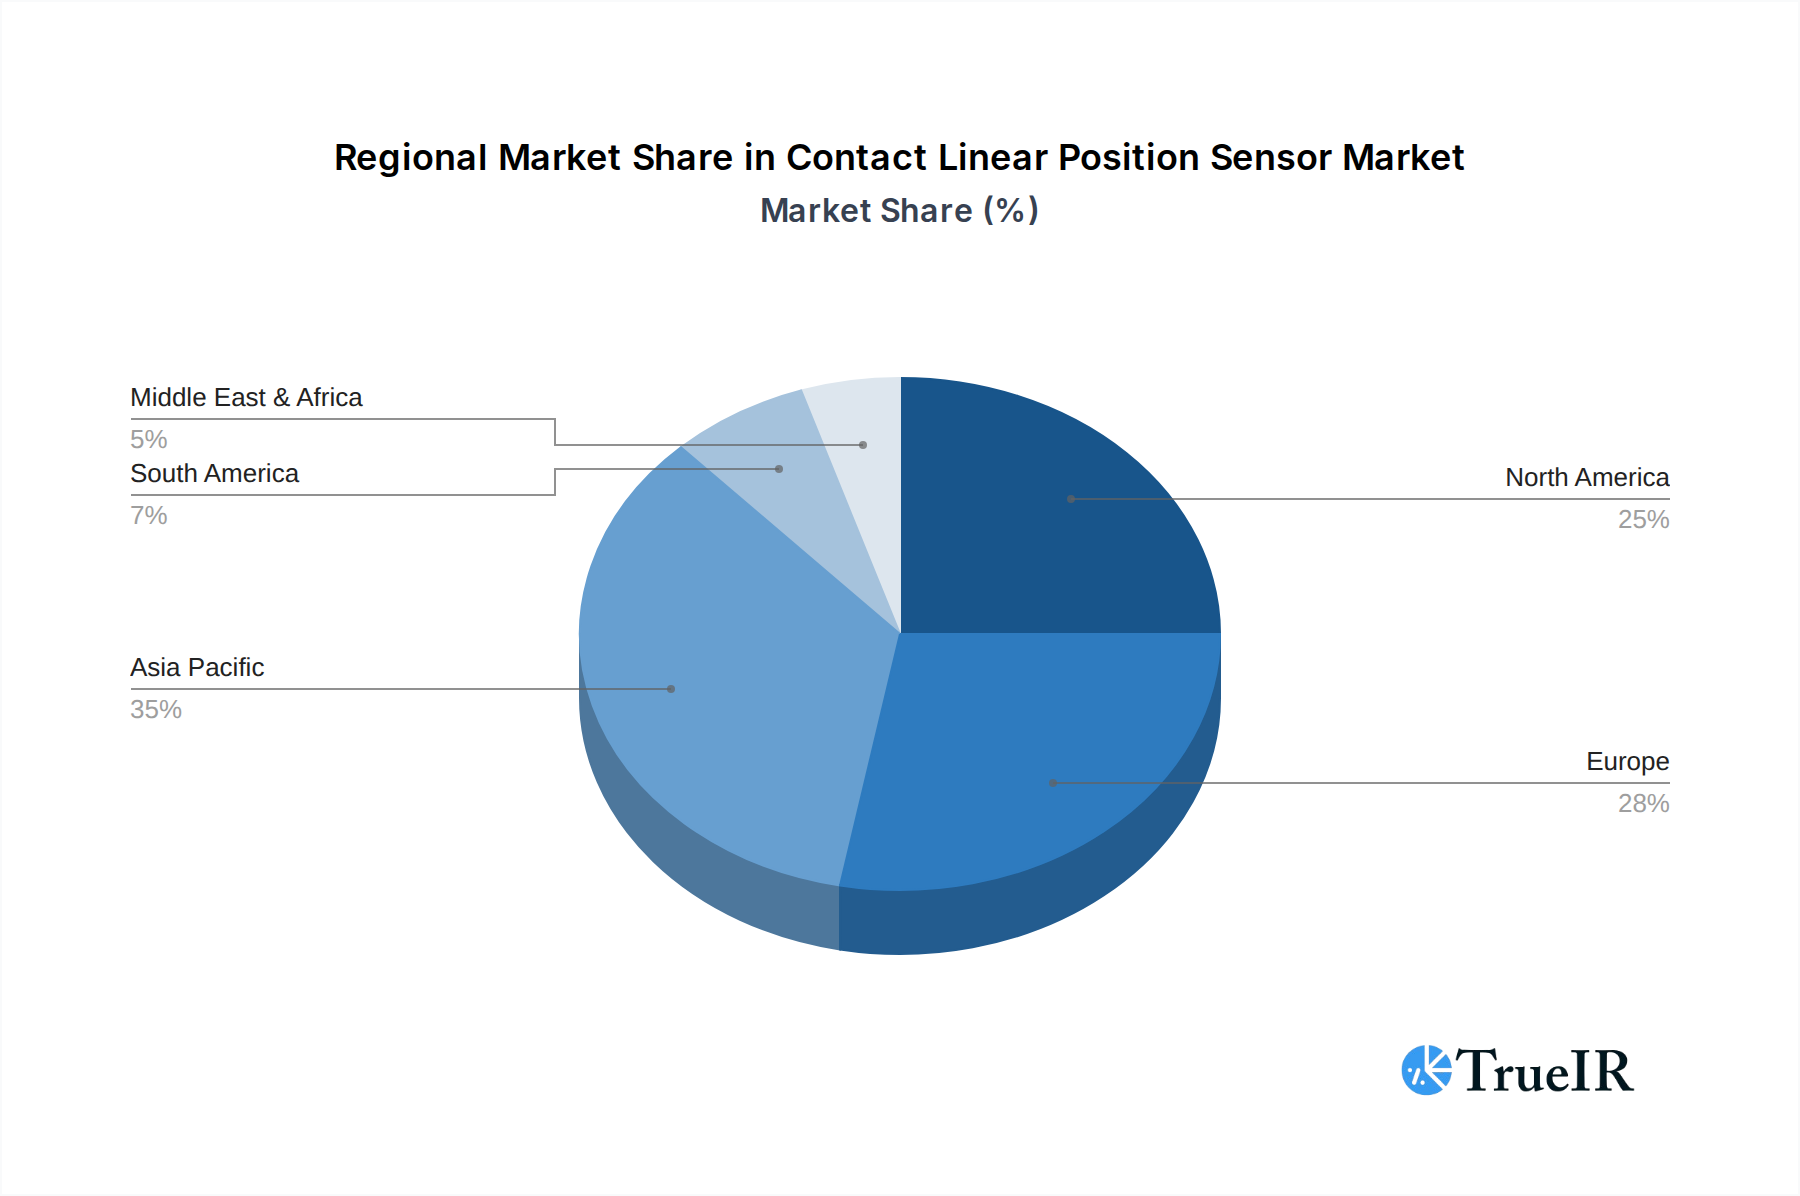
The market is segmented into two primary types: Analog Output Signals and Digital Output Signals, catering to a wide spectrum of system integration requirements. Geographically, Asia Pacific is expected to emerge as a dominant force, driven by rapid industrialization in countries like China and India, coupled with significant investments in manufacturing infrastructure and technological advancements. North America and Europe also represent substantial markets, benefiting from established industrial bases, stringent quality standards, and the continuous drive for innovation and automation. While the market enjoys strong growth, potential restraints could include the increasing competition from non-contact sensing technologies in certain niche applications and the initial cost of integration for some advanced sensor models. However, the inherent reliability and proven performance of contact linear position sensors are expected to sustain their market prominence for the foreseeable future, with ongoing technological refinements enhancing their capabilities and expanding their application scope.

Contact Linear Position Sensor Company Market Share
Contact Linear Position Sensor Market Structure & Competitive Landscape
The global contact linear position sensor market exhibits a moderately fragmented structure, characterized by the presence of several established multinational corporations and a growing number of regional specialists. Key players like IFM Electronic, Honeywell, and TE Connectivity command significant market share, driven by extensive product portfolios, robust R&D investments, and strong distribution networks. Innovation drivers are primarily centered around enhanced accuracy, improved durability, miniaturization, and the integration of smart features for IoT connectivity. Regulatory impacts, while not extensively stringent, often revolve around industry-specific safety and performance standards. Product substitutes, such as non-contact sensors (e.g., laser, ultrasonic), pose a competitive challenge, particularly in applications demanding higher speeds or harsh environmental resistance. End-user segmentation reveals a dominant automotive sector, followed by industrial automation, mining, and agriculture equipment. Merger and acquisition (M&A) trends are evident as larger entities seek to expand their technological capabilities, market reach, and product offerings. The estimated volume of M&A activities in the historical period (2019-2024) is in the range of xx billion USD, with key acquisitions focusing on companies with expertise in advanced materials and digital integration. Concentration ratios for the top five players are estimated to be around xx%, indicating a dynamic yet competitive landscape.
Contact Linear Position Sensor Market Trends & Opportunities
The global contact linear position sensor market is poised for substantial growth, driven by a confluence of technological advancements, expanding industrial applications, and evolving consumer preferences. The market size is projected to surge from approximately xx billion USD in 2019 to an estimated xx billion USD by 2033, reflecting a compound annual growth rate (CAGR) of xx% during the forecast period of 2025-2033. This robust expansion is fueled by the increasing demand for precise position feedback in automated systems across various industries. Technological shifts are a prominent trend, with a marked inclination towards sensors offering higher resolution, faster response times, and greater resistance to harsh environmental conditions such as dust, moisture, and extreme temperatures. The development of magnetostrictive and magneto-resistive technologies is enabling more robust and reliable linear position sensing solutions. Consumer preferences are increasingly leaning towards integrated, intelligent sensors that can communicate data wirelessly and seamlessly, aligning with the broader Internet of Things (IoT) revolution. This necessitates the development of smart sensors with built-in diagnostics and connectivity capabilities. Competitive dynamics are intensifying, with manufacturers focusing on product differentiation through enhanced performance, cost-effectiveness, and specialized solutions for niche applications. The growing adoption of Industry 4.0 principles across manufacturing sectors is a significant catalyst, driving the demand for sophisticated sensing technologies to optimize production processes, improve quality control, and enable predictive maintenance. For instance, the automotive industry's transition to electric vehicles (EVs) and advanced driver-assistance systems (ADAS) necessitates highly accurate and reliable linear position sensors for critical components like steering systems, braking mechanisms, and battery management. Similarly, the mining sector's drive for automation and safety in extraction operations further propels the adoption of robust contact linear position sensors. Opportunities also lie in emerging markets and developing economies where industrialization is on the rise, creating a fertile ground for increased sensor deployment. The food and beverage sector's increasing automation for hygiene and efficiency, coupled with the agricultural equipment sector's need for precision farming solutions, represent further avenues for market expansion. The continuous pursuit of energy efficiency and reduced operational costs across industries also presents opportunities for manufacturers to develop and market sensors that contribute to these goals.
Dominant Markets & Segments in Contact Linear Position Sensor
The Automotive sector stands as the undisputed leader in the contact linear position sensor market, dominating both application and value contribution. This dominance is driven by the ever-increasing integration of electronic control units (ECUs) and automated functionalities within vehicles. Modern automobiles rely on a multitude of linear position sensors for critical systems, including:
- Steering Systems: Ensuring precise control and feedback for power steering and steer-by-wire applications.
- Braking Systems: Vital for ABS, electronic stability control (ESC), and regenerative braking in electric vehicles.
- Transmission Control: Accurate position sensing for gear selection and optimal shifting.
- Accelerator and Throttle Control: Essential for engine management and drivability.
- Suspension Systems: Enabling adaptive damping and ride height control.
Key growth drivers in this segment include the global push towards autonomous driving, the electrification of powertrains, and stringent safety regulations mandating advanced driver-assistance systems (ADAS). The projected market size for automotive applications is estimated to be xx billion USD by 2033.
Within the Type segmentation, Analog Output Signals continue to hold a significant market share, favored for their continuous output and compatibility with a wide range of legacy and modern control systems. However, Digital Output Signals are experiencing robust growth, driven by the increasing adoption of microcontrollers and the need for direct digital interfacing in automated systems, enabling easier data integration and processing.
- Key Growth Drivers for Digital Output Signals:
- Growing adoption of Industry 4.0 and IIoT (Industrial Internet of Things).
- Demand for seamless data integration with programmable logic controllers (PLCs) and industrial PCs.
- Enhanced accuracy and resolution offered by digital communication protocols.
- Simplification of wiring and system integration.
The Mining industry represents another significant segment, propelled by the imperative for enhanced safety, operational efficiency, and remote monitoring of heavy machinery. Contact linear position sensors are deployed in:
- Hydraulic and Pneumatic Systems: Monitoring the position of actuators and valves in excavators, loaders, and drills.
- Conveyor Belt Systems: Ensuring proper tensioning and tracking.
- Haul Truck Suspensions: Optimizing load distribution and stability.
Government initiatives promoting mine safety, coupled with investments in automation to reduce human exposure to hazardous environments, are key growth catalysts in this sector. The market for mining applications is projected to reach xx billion USD by 2033.
The Agriculture Equipment segment is also experiencing considerable growth, driven by the adoption of precision agriculture techniques. Sensors are critical for:
- Automated Steering Systems for Tractors: Enabling precise row following and reducing overlap.
- Implement Control: Ensuring accurate depth and angle for plows, cultivators, and sprayers.
- Harvester Adjustments: Optimizing header height and reel speed for efficient crop collection.
The increasing global food demand and the need for optimized resource utilization (water, fertilizers) are fundamental drivers for sensor adoption in this segment.
Contact Linear Position Sensor Product Analysis
Contact linear position sensors are undergoing continuous innovation, with a focus on enhancing their performance, reliability, and integration capabilities. Product advancements include the development of sensors with higher resolution (xx micrometers or less), faster response times (xx milliseconds), and extended operational lifespans. Manufacturers are also emphasizing ruggedized designs capable of withstanding extreme temperatures (e.g., -40°C to +120°C), high vibration, and ingress protection (e.g., IP67/IP69K). Competitive advantages are being carved out through the integration of digital communication protocols like SSI, SPI, and IO-Link, facilitating seamless data exchange with control systems. Furthermore, the development of sensors with integrated diagnostics and self-monitoring features offers improved uptime and reduced maintenance costs. Novel materials and manufacturing techniques are also contributing to smaller form factors and improved resistance to wear and tear, making these sensors suitable for increasingly demanding applications across automotive, industrial automation, and heavy machinery sectors.
Key Drivers, Barriers & Challenges in Contact Linear Position Sensor
The contact linear position sensor market is propelled by several key drivers. Foremost among these is the relentless expansion of industrial automation and the adoption of Industry 4.0 principles, which necessitate precise positional feedback for optimized process control and efficiency. The burgeoning automotive sector, particularly the shift towards electric vehicles and advanced driver-assistance systems (ADAS), significantly fuels demand. Furthermore, increasing safety regulations in sectors like mining and construction mandate the use of reliable sensing technologies. Economic growth in developing nations and the subsequent industrialization also contribute to market expansion.
Conversely, the market faces significant barriers and challenges. The presence of non-contact alternatives, such as laser and ultrasonic sensors, poses a competitive threat, especially in applications where durability against physical contact is not paramount. Supply chain disruptions and the increasing cost of raw materials can impact pricing and availability. Regulatory hurdles, though generally less stringent than some other industrial components, can still add complexity in terms of compliance for specific applications and regions. Finally, intense competition among a multitude of manufacturers leads to price pressures, requiring continuous innovation and cost optimization to maintain market share.
Growth Drivers in the Contact Linear Position Sensor Market
The contact linear position sensor market is experiencing robust growth driven by several interconnected factors. The pervasive adoption of industrial automation and the ongoing transition towards Industry 4.0 are paramount, demanding precise positional data for efficient and intelligent manufacturing processes. The automotive industry's evolution towards electrification and advanced driver-assistance systems (ADAS) creates significant demand for high-accuracy sensors in steering, braking, and powertrain systems. Increasing global investments in infrastructure projects, particularly in emerging economies, also boost the need for reliable position sensing in heavy machinery and construction equipment. Furthermore, stringent safety regulations across industries like mining and marine transportation are compelling the adoption of advanced sensing technologies to enhance operational safety and prevent accidents.
Challenges Impacting Contact Linear Position Sensor Growth
Despite the positive growth trajectory, the contact linear position sensor market confronts several challenges. The ever-present competition from non-contact sensing technologies (e.g., LVDTs, optical encoders, ultrasonic sensors) poses a significant threat, especially in applications where direct physical contact can lead to wear and tear or where higher speeds are required. Fluctuations in raw material prices, such as rare earth metals used in magnets, can impact manufacturing costs and lead to price volatility. Furthermore, evolving regulatory landscapes and the need for compliance with diverse international standards can add complexity and cost to product development and market entry. Supply chain vulnerabilities, as highlighted by recent global events, can lead to lead-time extensions and increased logistical costs. Intense market competition also contributes to downward pressure on profit margins, necessitating continuous innovation and operational efficiency.
Key Players Shaping the Contact Linear Position Sensor Market
- IFM Electronic
- Honeywell
- TE Connectivity
- Bernstein
- ASM
- SIKO
- Gimatic
- Temposonics
- WayCon Positionsmesstechnik
- MEGATRON Elektronik
- Angst+Pfister
- NovoTechnik
- Elap
- Sauter
- Shanghai Sibo M&E
- Shanghai Yuanben Magnetoelectric Technology
Significant Contact Linear Position Sensor Industry Milestones
- 2019: Launch of advanced magnetostrictive sensors with enhanced resolution and diagnostic capabilities by Temposonics, impacting industrial automation and heavy machinery applications.
- 2020: TE Connectivity introduces a new generation of compact and robust linear position sensors designed for harsh automotive environments, supporting the EV and ADAS market growth.
- 2021: Honeywell expands its portfolio with integrated digital output sensors, facilitating seamless IIoT connectivity for manufacturing sectors.
- 2022: IFM Electronic releases a series of ultra-short stroke contact linear position sensors, catering to niche automation requirements in food and beverage and medical device manufacturing.
- 2023: SIKO introduces innovative linear encoders with enhanced wear resistance, extending product lifespan in high-cycle industrial applications.
- 2024: Increased M&A activity, with several smaller players being acquired by larger entities seeking to bolster their technological offerings and market presence in the contact linear position sensor domain.
Future Outlook for Contact Linear Position Sensor Market
The future outlook for the contact linear position sensor market is exceptionally promising, projecting sustained and robust growth throughout the forecast period. The continued expansion of industrial automation, the escalating demand for sophisticated automotive systems, and the increasing emphasis on safety and efficiency in heavy industries will remain primary growth catalysts. The ongoing trend towards Industry 4.0 and the Internet of Things (IoT) will further drive the adoption of intelligent and connected sensors with enhanced data processing and communication capabilities. Opportunities lie in the development of more compact, power-efficient, and cost-effective solutions, particularly for emerging applications in robotics, renewable energy systems, and smart agriculture. Strategic collaborations and further M&A activities are anticipated as companies aim to consolidate their market positions and expand their technological frontiers, ensuring a dynamic and innovative future for this critical segment of the sensor market.
Contact Linear Position Sensor Segmentation
-
1. Application
- 1.1. Automotive
- 1.2. Mining
- 1.3. Marine
- 1.4. Food and Beverages
- 1.5. Agriculture Equipment
- 1.6. Others
-
2. Type
- 2.1. Analog Output Signals
- 2.2. Digital Output Signals
Contact Linear Position Sensor Segmentation By Geography
-
1. North America
- 1.1. United States
- 1.2. Canada
- 1.3. Mexico
-
2. South America
- 2.1. Brazil
- 2.2. Argentina
- 2.3. Rest of South America
-
3. Europe
- 3.1. United Kingdom
- 3.2. Germany
- 3.3. France
- 3.4. Italy
- 3.5. Spain
- 3.6. Russia
- 3.7. Benelux
- 3.8. Nordics
- 3.9. Rest of Europe
-
4. Middle East & Africa
- 4.1. Turkey
- 4.2. Israel
- 4.3. GCC
- 4.4. North Africa
- 4.5. South Africa
- 4.6. Rest of Middle East & Africa
-
5. Asia Pacific
- 5.1. China
- 5.2. India
- 5.3. Japan
- 5.4. South Korea
- 5.5. ASEAN
- 5.6. Oceania
- 5.7. Rest of Asia Pacific
Contact Linear Position Sensor Regional Market Share
Geographic Coverage of Contact Linear Position Sensor
Contact Linear Position Sensor REPORT HIGHLIGHTS
| Aspects | Details |
|---|---|
| Study Period | 2020-2034 |
| Base Year | 2025 |
| Estimated Year | 2026 |
| Forecast Period | 2026-2034 |
| Historical Period | 2020-2025 |
| Growth Rate | CAGR of 9.28% from 2020-2034 |
| Segmentation |
|
Table of Contents
- 1. Introduction
- 1.1. Research Scope
- 1.2. Market Segmentation
- 1.3. Research Methodology
- 1.4. Definitions and Assumptions
- 2. Executive Summary
- 2.1. Introduction
- 3. Market Dynamics
- 3.1. Introduction
- 3.2. Market Drivers
- 3.3. Market Restrains
- 3.4. Market Trends
- 4. Market Factor Analysis
- 4.1. Porters Five Forces
- 4.2. Supply/Value Chain
- 4.3. PESTEL analysis
- 4.4. Market Entropy
- 4.5. Patent/Trademark Analysis
- 5. Global Contact Linear Position Sensor Analysis, Insights and Forecast, 2020-2032
- 5.1. Market Analysis, Insights and Forecast - by Application
- 5.1.1. Automotive
- 5.1.2. Mining
- 5.1.3. Marine
- 5.1.4. Food and Beverages
- 5.1.5. Agriculture Equipment
- 5.1.6. Others
- 5.2. Market Analysis, Insights and Forecast - by Type
- 5.2.1. Analog Output Signals
- 5.2.2. Digital Output Signals
- 5.3. Market Analysis, Insights and Forecast - by Region
- 5.3.1. North America
- 5.3.2. South America
- 5.3.3. Europe
- 5.3.4. Middle East & Africa
- 5.3.5. Asia Pacific
- 5.1. Market Analysis, Insights and Forecast - by Application
- 6. North America Contact Linear Position Sensor Analysis, Insights and Forecast, 2020-2032
- 6.1. Market Analysis, Insights and Forecast - by Application
- 6.1.1. Automotive
- 6.1.2. Mining
- 6.1.3. Marine
- 6.1.4. Food and Beverages
- 6.1.5. Agriculture Equipment
- 6.1.6. Others
- 6.2. Market Analysis, Insights and Forecast - by Type
- 6.2.1. Analog Output Signals
- 6.2.2. Digital Output Signals
- 6.1. Market Analysis, Insights and Forecast - by Application
- 7. South America Contact Linear Position Sensor Analysis, Insights and Forecast, 2020-2032
- 7.1. Market Analysis, Insights and Forecast - by Application
- 7.1.1. Automotive
- 7.1.2. Mining
- 7.1.3. Marine
- 7.1.4. Food and Beverages
- 7.1.5. Agriculture Equipment
- 7.1.6. Others
- 7.2. Market Analysis, Insights and Forecast - by Type
- 7.2.1. Analog Output Signals
- 7.2.2. Digital Output Signals
- 7.1. Market Analysis, Insights and Forecast - by Application
- 8. Europe Contact Linear Position Sensor Analysis, Insights and Forecast, 2020-2032
- 8.1. Market Analysis, Insights and Forecast - by Application
- 8.1.1. Automotive
- 8.1.2. Mining
- 8.1.3. Marine
- 8.1.4. Food and Beverages
- 8.1.5. Agriculture Equipment
- 8.1.6. Others
- 8.2. Market Analysis, Insights and Forecast - by Type
- 8.2.1. Analog Output Signals
- 8.2.2. Digital Output Signals
- 8.1. Market Analysis, Insights and Forecast - by Application
- 9. Middle East & Africa Contact Linear Position Sensor Analysis, Insights and Forecast, 2020-2032
- 9.1. Market Analysis, Insights and Forecast - by Application
- 9.1.1. Automotive
- 9.1.2. Mining
- 9.1.3. Marine
- 9.1.4. Food and Beverages
- 9.1.5. Agriculture Equipment
- 9.1.6. Others
- 9.2. Market Analysis, Insights and Forecast - by Type
- 9.2.1. Analog Output Signals
- 9.2.2. Digital Output Signals
- 9.1. Market Analysis, Insights and Forecast - by Application
- 10. Asia Pacific Contact Linear Position Sensor Analysis, Insights and Forecast, 2020-2032
- 10.1. Market Analysis, Insights and Forecast - by Application
- 10.1.1. Automotive
- 10.1.2. Mining
- 10.1.3. Marine
- 10.1.4. Food and Beverages
- 10.1.5. Agriculture Equipment
- 10.1.6. Others
- 10.2. Market Analysis, Insights and Forecast - by Type
- 10.2.1. Analog Output Signals
- 10.2.2. Digital Output Signals
- 10.1. Market Analysis, Insights and Forecast - by Application
- 11. Competitive Analysis
- 11.1. Global Market Share Analysis 2025
- 11.2. Company Profiles
- 11.2.1 IFM Electronic
- 11.2.1.1. Overview
- 11.2.1.2. Products
- 11.2.1.3. SWOT Analysis
- 11.2.1.4. Recent Developments
- 11.2.1.5. Financials (Based on Availability)
- 11.2.2 Honeywell
- 11.2.2.1. Overview
- 11.2.2.2. Products
- 11.2.2.3. SWOT Analysis
- 11.2.2.4. Recent Developments
- 11.2.2.5. Financials (Based on Availability)
- 11.2.3 TE Connectivity
- 11.2.3.1. Overview
- 11.2.3.2. Products
- 11.2.3.3. SWOT Analysis
- 11.2.3.4. Recent Developments
- 11.2.3.5. Financials (Based on Availability)
- 11.2.4 Bernstein
- 11.2.4.1. Overview
- 11.2.4.2. Products
- 11.2.4.3. SWOT Analysis
- 11.2.4.4. Recent Developments
- 11.2.4.5. Financials (Based on Availability)
- 11.2.5 ASM
- 11.2.5.1. Overview
- 11.2.5.2. Products
- 11.2.5.3. SWOT Analysis
- 11.2.5.4. Recent Developments
- 11.2.5.5. Financials (Based on Availability)
- 11.2.6 SIKO
- 11.2.6.1. Overview
- 11.2.6.2. Products
- 11.2.6.3. SWOT Analysis
- 11.2.6.4. Recent Developments
- 11.2.6.5. Financials (Based on Availability)
- 11.2.7 Gimatic
- 11.2.7.1. Overview
- 11.2.7.2. Products
- 11.2.7.3. SWOT Analysis
- 11.2.7.4. Recent Developments
- 11.2.7.5. Financials (Based on Availability)
- 11.2.8 Temposonics
- 11.2.8.1. Overview
- 11.2.8.2. Products
- 11.2.8.3. SWOT Analysis
- 11.2.8.4. Recent Developments
- 11.2.8.5. Financials (Based on Availability)
- 11.2.9 WayCon Positionsmesstechnik
- 11.2.9.1. Overview
- 11.2.9.2. Products
- 11.2.9.3. SWOT Analysis
- 11.2.9.4. Recent Developments
- 11.2.9.5. Financials (Based on Availability)
- 11.2.10 MEGATRON Elektronik
- 11.2.10.1. Overview
- 11.2.10.2. Products
- 11.2.10.3. SWOT Analysis
- 11.2.10.4. Recent Developments
- 11.2.10.5. Financials (Based on Availability)
- 11.2.11 Angst+Pfister
- 11.2.11.1. Overview
- 11.2.11.2. Products
- 11.2.11.3. SWOT Analysis
- 11.2.11.4. Recent Developments
- 11.2.11.5. Financials (Based on Availability)
- 11.2.12 NovoTechnik
- 11.2.12.1. Overview
- 11.2.12.2. Products
- 11.2.12.3. SWOT Analysis
- 11.2.12.4. Recent Developments
- 11.2.12.5. Financials (Based on Availability)
- 11.2.13 Elap
- 11.2.13.1. Overview
- 11.2.13.2. Products
- 11.2.13.3. SWOT Analysis
- 11.2.13.4. Recent Developments
- 11.2.13.5. Financials (Based on Availability)
- 11.2.14 Sauter
- 11.2.14.1. Overview
- 11.2.14.2. Products
- 11.2.14.3. SWOT Analysis
- 11.2.14.4. Recent Developments
- 11.2.14.5. Financials (Based on Availability)
- 11.2.15 Shanghai Sibo M&E
- 11.2.15.1. Overview
- 11.2.15.2. Products
- 11.2.15.3. SWOT Analysis
- 11.2.15.4. Recent Developments
- 11.2.15.5. Financials (Based on Availability)
- 11.2.16 Shanghai Yuanben Magnetoelectric Technology
- 11.2.16.1. Overview
- 11.2.16.2. Products
- 11.2.16.3. SWOT Analysis
- 11.2.16.4. Recent Developments
- 11.2.16.5. Financials (Based on Availability)
- 11.2.1 IFM Electronic
List of Figures
- Figure 1: Global Contact Linear Position Sensor Revenue Breakdown (undefined, %) by Region 2025 & 2033
- Figure 2: Global Contact Linear Position Sensor Volume Breakdown (K, %) by Region 2025 & 2033
- Figure 3: North America Contact Linear Position Sensor Revenue (undefined), by Application 2025 & 2033
- Figure 4: North America Contact Linear Position Sensor Volume (K), by Application 2025 & 2033
- Figure 5: North America Contact Linear Position Sensor Revenue Share (%), by Application 2025 & 2033
- Figure 6: North America Contact Linear Position Sensor Volume Share (%), by Application 2025 & 2033
- Figure 7: North America Contact Linear Position Sensor Revenue (undefined), by Type 2025 & 2033
- Figure 8: North America Contact Linear Position Sensor Volume (K), by Type 2025 & 2033
- Figure 9: North America Contact Linear Position Sensor Revenue Share (%), by Type 2025 & 2033
- Figure 10: North America Contact Linear Position Sensor Volume Share (%), by Type 2025 & 2033
- Figure 11: North America Contact Linear Position Sensor Revenue (undefined), by Country 2025 & 2033
- Figure 12: North America Contact Linear Position Sensor Volume (K), by Country 2025 & 2033
- Figure 13: North America Contact Linear Position Sensor Revenue Share (%), by Country 2025 & 2033
- Figure 14: North America Contact Linear Position Sensor Volume Share (%), by Country 2025 & 2033
- Figure 15: South America Contact Linear Position Sensor Revenue (undefined), by Application 2025 & 2033
- Figure 16: South America Contact Linear Position Sensor Volume (K), by Application 2025 & 2033
- Figure 17: South America Contact Linear Position Sensor Revenue Share (%), by Application 2025 & 2033
- Figure 18: South America Contact Linear Position Sensor Volume Share (%), by Application 2025 & 2033
- Figure 19: South America Contact Linear Position Sensor Revenue (undefined), by Type 2025 & 2033
- Figure 20: South America Contact Linear Position Sensor Volume (K), by Type 2025 & 2033
- Figure 21: South America Contact Linear Position Sensor Revenue Share (%), by Type 2025 & 2033
- Figure 22: South America Contact Linear Position Sensor Volume Share (%), by Type 2025 & 2033
- Figure 23: South America Contact Linear Position Sensor Revenue (undefined), by Country 2025 & 2033
- Figure 24: South America Contact Linear Position Sensor Volume (K), by Country 2025 & 2033
- Figure 25: South America Contact Linear Position Sensor Revenue Share (%), by Country 2025 & 2033
- Figure 26: South America Contact Linear Position Sensor Volume Share (%), by Country 2025 & 2033
- Figure 27: Europe Contact Linear Position Sensor Revenue (undefined), by Application 2025 & 2033
- Figure 28: Europe Contact Linear Position Sensor Volume (K), by Application 2025 & 2033
- Figure 29: Europe Contact Linear Position Sensor Revenue Share (%), by Application 2025 & 2033
- Figure 30: Europe Contact Linear Position Sensor Volume Share (%), by Application 2025 & 2033
- Figure 31: Europe Contact Linear Position Sensor Revenue (undefined), by Type 2025 & 2033
- Figure 32: Europe Contact Linear Position Sensor Volume (K), by Type 2025 & 2033
- Figure 33: Europe Contact Linear Position Sensor Revenue Share (%), by Type 2025 & 2033
- Figure 34: Europe Contact Linear Position Sensor Volume Share (%), by Type 2025 & 2033
- Figure 35: Europe Contact Linear Position Sensor Revenue (undefined), by Country 2025 & 2033
- Figure 36: Europe Contact Linear Position Sensor Volume (K), by Country 2025 & 2033
- Figure 37: Europe Contact Linear Position Sensor Revenue Share (%), by Country 2025 & 2033
- Figure 38: Europe Contact Linear Position Sensor Volume Share (%), by Country 2025 & 2033
- Figure 39: Middle East & Africa Contact Linear Position Sensor Revenue (undefined), by Application 2025 & 2033
- Figure 40: Middle East & Africa Contact Linear Position Sensor Volume (K), by Application 2025 & 2033
- Figure 41: Middle East & Africa Contact Linear Position Sensor Revenue Share (%), by Application 2025 & 2033
- Figure 42: Middle East & Africa Contact Linear Position Sensor Volume Share (%), by Application 2025 & 2033
- Figure 43: Middle East & Africa Contact Linear Position Sensor Revenue (undefined), by Type 2025 & 2033
- Figure 44: Middle East & Africa Contact Linear Position Sensor Volume (K), by Type 2025 & 2033
- Figure 45: Middle East & Africa Contact Linear Position Sensor Revenue Share (%), by Type 2025 & 2033
- Figure 46: Middle East & Africa Contact Linear Position Sensor Volume Share (%), by Type 2025 & 2033
- Figure 47: Middle East & Africa Contact Linear Position Sensor Revenue (undefined), by Country 2025 & 2033
- Figure 48: Middle East & Africa Contact Linear Position Sensor Volume (K), by Country 2025 & 2033
- Figure 49: Middle East & Africa Contact Linear Position Sensor Revenue Share (%), by Country 2025 & 2033
- Figure 50: Middle East & Africa Contact Linear Position Sensor Volume Share (%), by Country 2025 & 2033
- Figure 51: Asia Pacific Contact Linear Position Sensor Revenue (undefined), by Application 2025 & 2033
- Figure 52: Asia Pacific Contact Linear Position Sensor Volume (K), by Application 2025 & 2033
- Figure 53: Asia Pacific Contact Linear Position Sensor Revenue Share (%), by Application 2025 & 2033
- Figure 54: Asia Pacific Contact Linear Position Sensor Volume Share (%), by Application 2025 & 2033
- Figure 55: Asia Pacific Contact Linear Position Sensor Revenue (undefined), by Type 2025 & 2033
- Figure 56: Asia Pacific Contact Linear Position Sensor Volume (K), by Type 2025 & 2033
- Figure 57: Asia Pacific Contact Linear Position Sensor Revenue Share (%), by Type 2025 & 2033
- Figure 58: Asia Pacific Contact Linear Position Sensor Volume Share (%), by Type 2025 & 2033
- Figure 59: Asia Pacific Contact Linear Position Sensor Revenue (undefined), by Country 2025 & 2033
- Figure 60: Asia Pacific Contact Linear Position Sensor Volume (K), by Country 2025 & 2033
- Figure 61: Asia Pacific Contact Linear Position Sensor Revenue Share (%), by Country 2025 & 2033
- Figure 62: Asia Pacific Contact Linear Position Sensor Volume Share (%), by Country 2025 & 2033
List of Tables
- Table 1: Global Contact Linear Position Sensor Revenue undefined Forecast, by Application 2020 & 2033
- Table 2: Global Contact Linear Position Sensor Volume K Forecast, by Application 2020 & 2033
- Table 3: Global Contact Linear Position Sensor Revenue undefined Forecast, by Type 2020 & 2033
- Table 4: Global Contact Linear Position Sensor Volume K Forecast, by Type 2020 & 2033
- Table 5: Global Contact Linear Position Sensor Revenue undefined Forecast, by Region 2020 & 2033
- Table 6: Global Contact Linear Position Sensor Volume K Forecast, by Region 2020 & 2033
- Table 7: Global Contact Linear Position Sensor Revenue undefined Forecast, by Application 2020 & 2033
- Table 8: Global Contact Linear Position Sensor Volume K Forecast, by Application 2020 & 2033
- Table 9: Global Contact Linear Position Sensor Revenue undefined Forecast, by Type 2020 & 2033
- Table 10: Global Contact Linear Position Sensor Volume K Forecast, by Type 2020 & 2033
- Table 11: Global Contact Linear Position Sensor Revenue undefined Forecast, by Country 2020 & 2033
- Table 12: Global Contact Linear Position Sensor Volume K Forecast, by Country 2020 & 2033
- Table 13: United States Contact Linear Position Sensor Revenue (undefined) Forecast, by Application 2020 & 2033
- Table 14: United States Contact Linear Position Sensor Volume (K) Forecast, by Application 2020 & 2033
- Table 15: Canada Contact Linear Position Sensor Revenue (undefined) Forecast, by Application 2020 & 2033
- Table 16: Canada Contact Linear Position Sensor Volume (K) Forecast, by Application 2020 & 2033
- Table 17: Mexico Contact Linear Position Sensor Revenue (undefined) Forecast, by Application 2020 & 2033
- Table 18: Mexico Contact Linear Position Sensor Volume (K) Forecast, by Application 2020 & 2033
- Table 19: Global Contact Linear Position Sensor Revenue undefined Forecast, by Application 2020 & 2033
- Table 20: Global Contact Linear Position Sensor Volume K Forecast, by Application 2020 & 2033
- Table 21: Global Contact Linear Position Sensor Revenue undefined Forecast, by Type 2020 & 2033
- Table 22: Global Contact Linear Position Sensor Volume K Forecast, by Type 2020 & 2033
- Table 23: Global Contact Linear Position Sensor Revenue undefined Forecast, by Country 2020 & 2033
- Table 24: Global Contact Linear Position Sensor Volume K Forecast, by Country 2020 & 2033
- Table 25: Brazil Contact Linear Position Sensor Revenue (undefined) Forecast, by Application 2020 & 2033
- Table 26: Brazil Contact Linear Position Sensor Volume (K) Forecast, by Application 2020 & 2033
- Table 27: Argentina Contact Linear Position Sensor Revenue (undefined) Forecast, by Application 2020 & 2033
- Table 28: Argentina Contact Linear Position Sensor Volume (K) Forecast, by Application 2020 & 2033
- Table 29: Rest of South America Contact Linear Position Sensor Revenue (undefined) Forecast, by Application 2020 & 2033
- Table 30: Rest of South America Contact Linear Position Sensor Volume (K) Forecast, by Application 2020 & 2033
- Table 31: Global Contact Linear Position Sensor Revenue undefined Forecast, by Application 2020 & 2033
- Table 32: Global Contact Linear Position Sensor Volume K Forecast, by Application 2020 & 2033
- Table 33: Global Contact Linear Position Sensor Revenue undefined Forecast, by Type 2020 & 2033
- Table 34: Global Contact Linear Position Sensor Volume K Forecast, by Type 2020 & 2033
- Table 35: Global Contact Linear Position Sensor Revenue undefined Forecast, by Country 2020 & 2033
- Table 36: Global Contact Linear Position Sensor Volume K Forecast, by Country 2020 & 2033
- Table 37: United Kingdom Contact Linear Position Sensor Revenue (undefined) Forecast, by Application 2020 & 2033
- Table 38: United Kingdom Contact Linear Position Sensor Volume (K) Forecast, by Application 2020 & 2033
- Table 39: Germany Contact Linear Position Sensor Revenue (undefined) Forecast, by Application 2020 & 2033
- Table 40: Germany Contact Linear Position Sensor Volume (K) Forecast, by Application 2020 & 2033
- Table 41: France Contact Linear Position Sensor Revenue (undefined) Forecast, by Application 2020 & 2033
- Table 42: France Contact Linear Position Sensor Volume (K) Forecast, by Application 2020 & 2033
- Table 43: Italy Contact Linear Position Sensor Revenue (undefined) Forecast, by Application 2020 & 2033
- Table 44: Italy Contact Linear Position Sensor Volume (K) Forecast, by Application 2020 & 2033
- Table 45: Spain Contact Linear Position Sensor Revenue (undefined) Forecast, by Application 2020 & 2033
- Table 46: Spain Contact Linear Position Sensor Volume (K) Forecast, by Application 2020 & 2033
- Table 47: Russia Contact Linear Position Sensor Revenue (undefined) Forecast, by Application 2020 & 2033
- Table 48: Russia Contact Linear Position Sensor Volume (K) Forecast, by Application 2020 & 2033
- Table 49: Benelux Contact Linear Position Sensor Revenue (undefined) Forecast, by Application 2020 & 2033
- Table 50: Benelux Contact Linear Position Sensor Volume (K) Forecast, by Application 2020 & 2033
- Table 51: Nordics Contact Linear Position Sensor Revenue (undefined) Forecast, by Application 2020 & 2033
- Table 52: Nordics Contact Linear Position Sensor Volume (K) Forecast, by Application 2020 & 2033
- Table 53: Rest of Europe Contact Linear Position Sensor Revenue (undefined) Forecast, by Application 2020 & 2033
- Table 54: Rest of Europe Contact Linear Position Sensor Volume (K) Forecast, by Application 2020 & 2033
- Table 55: Global Contact Linear Position Sensor Revenue undefined Forecast, by Application 2020 & 2033
- Table 56: Global Contact Linear Position Sensor Volume K Forecast, by Application 2020 & 2033
- Table 57: Global Contact Linear Position Sensor Revenue undefined Forecast, by Type 2020 & 2033
- Table 58: Global Contact Linear Position Sensor Volume K Forecast, by Type 2020 & 2033
- Table 59: Global Contact Linear Position Sensor Revenue undefined Forecast, by Country 2020 & 2033
- Table 60: Global Contact Linear Position Sensor Volume K Forecast, by Country 2020 & 2033
- Table 61: Turkey Contact Linear Position Sensor Revenue (undefined) Forecast, by Application 2020 & 2033
- Table 62: Turkey Contact Linear Position Sensor Volume (K) Forecast, by Application 2020 & 2033
- Table 63: Israel Contact Linear Position Sensor Revenue (undefined) Forecast, by Application 2020 & 2033
- Table 64: Israel Contact Linear Position Sensor Volume (K) Forecast, by Application 2020 & 2033
- Table 65: GCC Contact Linear Position Sensor Revenue (undefined) Forecast, by Application 2020 & 2033
- Table 66: GCC Contact Linear Position Sensor Volume (K) Forecast, by Application 2020 & 2033
- Table 67: North Africa Contact Linear Position Sensor Revenue (undefined) Forecast, by Application 2020 & 2033
- Table 68: North Africa Contact Linear Position Sensor Volume (K) Forecast, by Application 2020 & 2033
- Table 69: South Africa Contact Linear Position Sensor Revenue (undefined) Forecast, by Application 2020 & 2033
- Table 70: South Africa Contact Linear Position Sensor Volume (K) Forecast, by Application 2020 & 2033
- Table 71: Rest of Middle East & Africa Contact Linear Position Sensor Revenue (undefined) Forecast, by Application 2020 & 2033
- Table 72: Rest of Middle East & Africa Contact Linear Position Sensor Volume (K) Forecast, by Application 2020 & 2033
- Table 73: Global Contact Linear Position Sensor Revenue undefined Forecast, by Application 2020 & 2033
- Table 74: Global Contact Linear Position Sensor Volume K Forecast, by Application 2020 & 2033
- Table 75: Global Contact Linear Position Sensor Revenue undefined Forecast, by Type 2020 & 2033
- Table 76: Global Contact Linear Position Sensor Volume K Forecast, by Type 2020 & 2033
- Table 77: Global Contact Linear Position Sensor Revenue undefined Forecast, by Country 2020 & 2033
- Table 78: Global Contact Linear Position Sensor Volume K Forecast, by Country 2020 & 2033
- Table 79: China Contact Linear Position Sensor Revenue (undefined) Forecast, by Application 2020 & 2033
- Table 80: China Contact Linear Position Sensor Volume (K) Forecast, by Application 2020 & 2033
- Table 81: India Contact Linear Position Sensor Revenue (undefined) Forecast, by Application 2020 & 2033
- Table 82: India Contact Linear Position Sensor Volume (K) Forecast, by Application 2020 & 2033
- Table 83: Japan Contact Linear Position Sensor Revenue (undefined) Forecast, by Application 2020 & 2033
- Table 84: Japan Contact Linear Position Sensor Volume (K) Forecast, by Application 2020 & 2033
- Table 85: South Korea Contact Linear Position Sensor Revenue (undefined) Forecast, by Application 2020 & 2033
- Table 86: South Korea Contact Linear Position Sensor Volume (K) Forecast, by Application 2020 & 2033
- Table 87: ASEAN Contact Linear Position Sensor Revenue (undefined) Forecast, by Application 2020 & 2033
- Table 88: ASEAN Contact Linear Position Sensor Volume (K) Forecast, by Application 2020 & 2033
- Table 89: Oceania Contact Linear Position Sensor Revenue (undefined) Forecast, by Application 2020 & 2033
- Table 90: Oceania Contact Linear Position Sensor Volume (K) Forecast, by Application 2020 & 2033
- Table 91: Rest of Asia Pacific Contact Linear Position Sensor Revenue (undefined) Forecast, by Application 2020 & 2033
- Table 92: Rest of Asia Pacific Contact Linear Position Sensor Volume (K) Forecast, by Application 2020 & 2033
Frequently Asked Questions
1. What is the projected Compound Annual Growth Rate (CAGR) of the Contact Linear Position Sensor?
The projected CAGR is approximately 9.28%.
2. Which companies are prominent players in the Contact Linear Position Sensor?
Key companies in the market include IFM Electronic, Honeywell, TE Connectivity, Bernstein, ASM, SIKO, Gimatic, Temposonics, WayCon Positionsmesstechnik, MEGATRON Elektronik, Angst+Pfister, NovoTechnik, Elap, Sauter, Shanghai Sibo M&E, Shanghai Yuanben Magnetoelectric Technology.
3. What are the main segments of the Contact Linear Position Sensor?
The market segments include Application, Type.
4. Can you provide details about the market size?
The market size is estimated to be USD XXX N/A as of 2022.
5. What are some drivers contributing to market growth?
N/A
6. What are the notable trends driving market growth?
N/A
7. Are there any restraints impacting market growth?
N/A
8. Can you provide examples of recent developments in the market?
N/A
9. What pricing options are available for accessing the report?
Pricing options include single-user, multi-user, and enterprise licenses priced at USD 3950.00, USD 5925.00, and USD 7900.00 respectively.
10. Is the market size provided in terms of value or volume?
The market size is provided in terms of value, measured in N/A and volume, measured in K.
11. Are there any specific market keywords associated with the report?
Yes, the market keyword associated with the report is "Contact Linear Position Sensor," which aids in identifying and referencing the specific market segment covered.
12. How do I determine which pricing option suits my needs best?
The pricing options vary based on user requirements and access needs. Individual users may opt for single-user licenses, while businesses requiring broader access may choose multi-user or enterprise licenses for cost-effective access to the report.
13. Are there any additional resources or data provided in the Contact Linear Position Sensor report?
While the report offers comprehensive insights, it's advisable to review the specific contents or supplementary materials provided to ascertain if additional resources or data are available.
14. How can I stay updated on further developments or reports in the Contact Linear Position Sensor?
To stay informed about further developments, trends, and reports in the Contact Linear Position Sensor, consider subscribing to industry newsletters, following relevant companies and organizations, or regularly checking reputable industry news sources and publications.
Methodology
Step 1 - Identification of Relevant Samples Size from Population Database


Step 2 - Approaches for Defining Global Market Size (Value, Volume* & Price*)

Note*: In applicable scenarios
Step 3 - Data Sources
Primary Research
- Web Analytics
- Survey Reports
- Research Institute
- Latest Research Reports
- Opinion Leaders
Secondary Research
- Annual Reports
- White Paper
- Latest Press Release
- Industry Association
- Paid Database
- Investor Presentations

Step 4 - Data Triangulation
Involves using different sources of information in order to increase the validity of a study
These sources are likely to be stakeholders in a program - participants, other researchers, program staff, other community members, and so on.
Then we put all data in single framework & apply various statistical tools to find out the dynamic on the market.
During the analysis stage, feedback from the stakeholder groups would be compared to determine areas of agreement as well as areas of divergence