

Key Insights
The US residential smart meter market is poised for significant expansion, driven by the accelerating adoption of smart grid technologies and increasing consumer demand for enhanced energy management capabilities. With a robust market size of approximately $98.93 million in 2025, the sector is expected to witness a compound annual growth rate (CAGR) of 6.32% from 2025 to 2033. This growth is fueled by a convergence of factors, including government initiatives promoting energy efficiency, the inherent benefits of smart meters in reducing operational costs for utilities, and the growing awareness among homeowners about the potential for cost savings through optimized energy consumption. The deployment of both electric and gas smart meters is a key trend, supported by advancements in wireless communication technologies that facilitate seamless data transmission and real-time monitoring. The increasing focus on renewable energy integration and the need for sophisticated demand-response programs further bolster the market's upward trajectory.
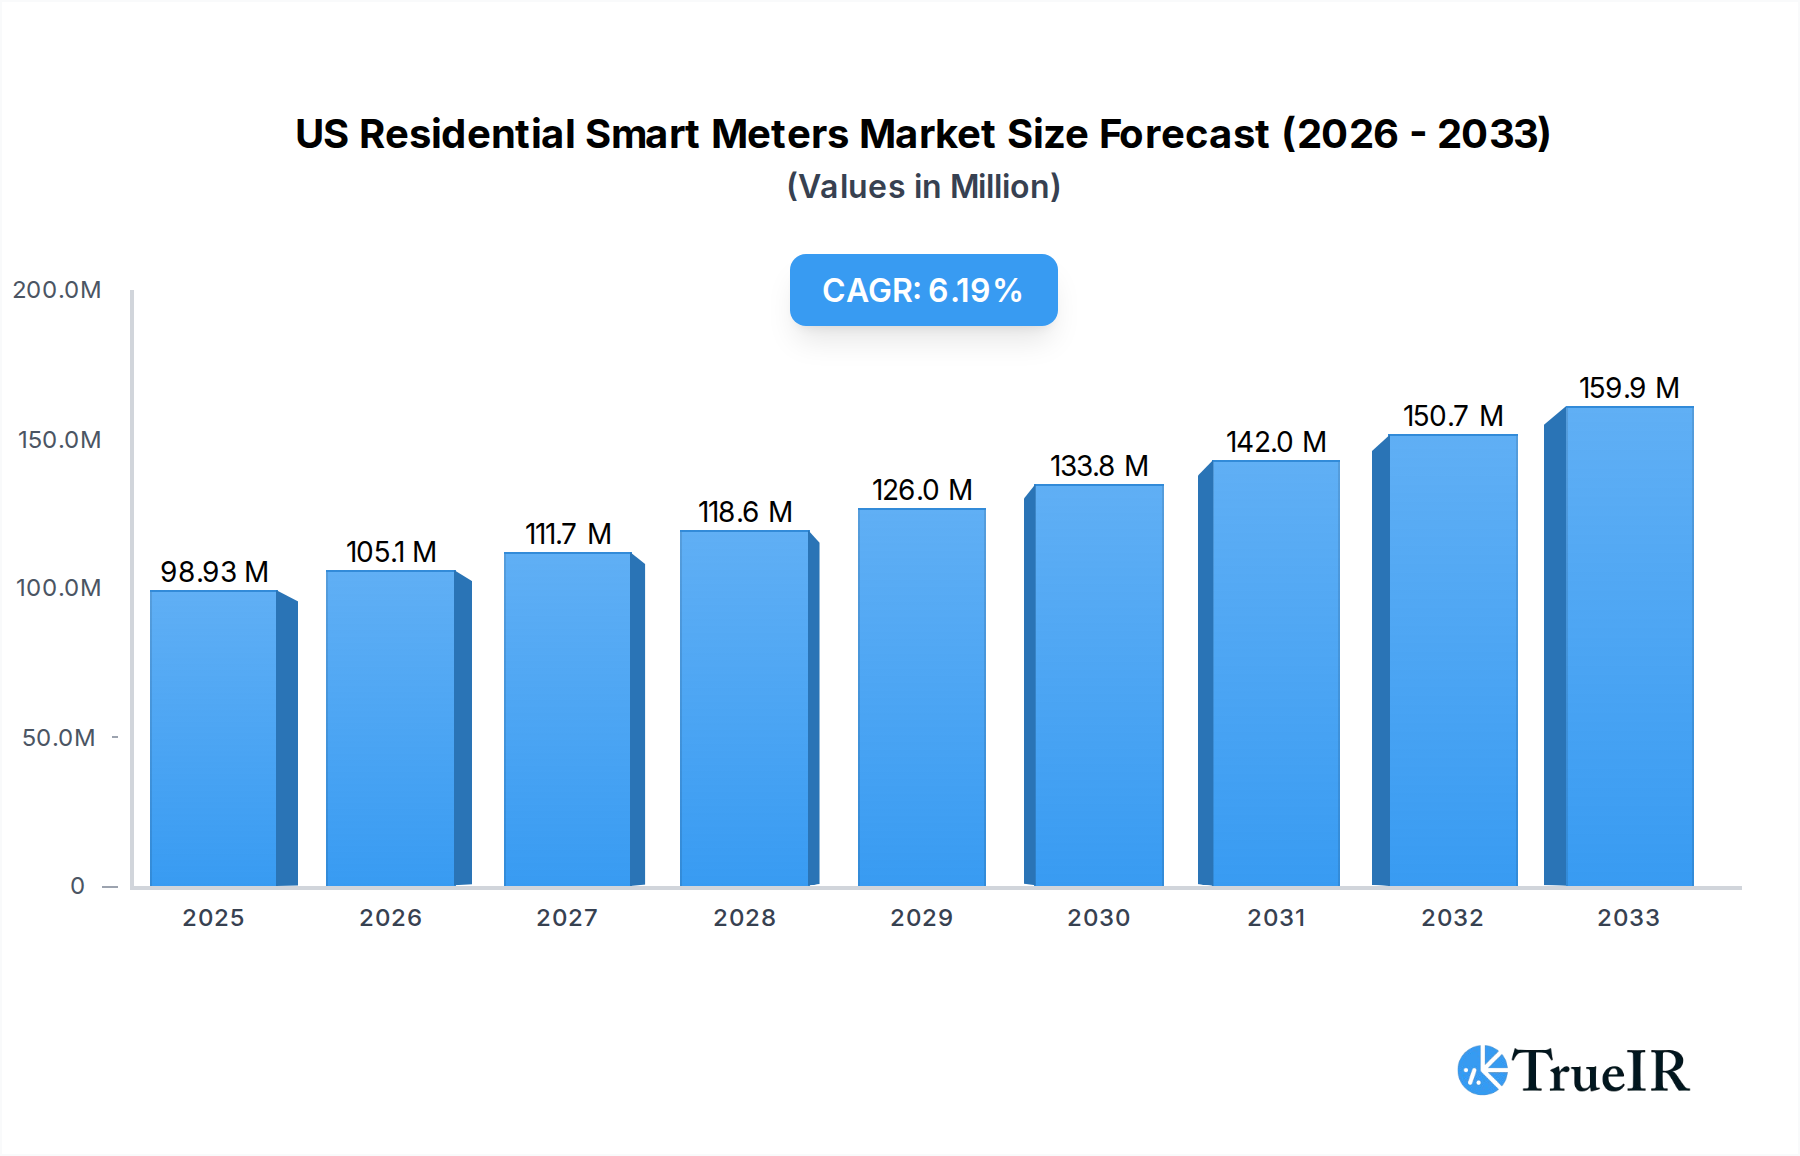
US Residential Smart Meters Market Market Size (In Million)
The market is characterized by a dynamic competitive landscape with established players like Itron Inc., Badger Meter Inc., and Honeywell International Inc. (through Elster Group GmbH) leading the charge in innovation and deployment. The demand for smart meters is further amplified by their crucial role in enabling efficient energy monitoring, swift outage management, and effective demand response strategies, all of which are becoming increasingly critical for modern utility operations and consumer engagement. While the market exhibits strong growth potential, potential restraints such as high initial deployment costs and cybersecurity concerns need to be addressed proactively by stakeholders to ensure sustained and widespread adoption. Nonetheless, the overarching trend towards a more connected, efficient, and consumer-centric energy ecosystem strongly favors the continued expansion of the US residential smart meter market.

US Residential Smart Meters Market Company Market Share
This in-depth report provides a detailed examination of the US residential smart meters market, offering critical insights into its structure, trends, dominant segments, product innovations, growth drivers, challenges, and competitive landscape. Leveraging a study period from 2019 to 2033, with a base year of 2025 and a forecast period extending to 2033, this analysis is designed for industry stakeholders seeking a strategic understanding of this rapidly evolving sector. Our research incorporates high-volume SEO keywords such as "residential smart meters," "smart meter market," "utility meter technology," "energy monitoring solutions," "demand response management," and "outage management systems" to ensure maximum visibility and engagement for industry professionals.
US Residential Smart Meters Market Market Structure & Competitive Landscape
The US residential smart meters market is characterized by a moderately concentrated competitive landscape, driven by significant capital investment requirements, technological expertise, and established relationships with utility providers. Key players are actively engaged in innovation to enhance meter capabilities and data analytics. Regulatory frameworks, particularly those promoting grid modernization and energy efficiency, play a crucial role in shaping market dynamics. While direct product substitutes are limited, alternative energy management technologies are emerging, necessitating continuous product differentiation. The end-user segmentation primarily focuses on residential utility consumers, with increasing emphasis on data-driven energy insights. Mergers and acquisitions (M&A) are a notable trend, indicating a consolidation phase where larger companies acquire innovative smaller players to expand their product portfolios and market reach. For instance, historical M&A volumes indicate a growing trend in recent years as companies seek to strengthen their competitive position. The market benefits from drivers such as government initiatives for smart grid deployment and rising consumer demand for energy efficiency solutions.
US Residential Smart Meters Market Market Trends & Opportunities
The US residential smart meters market is experiencing robust growth, projected to reach substantial market size in the coming years. This expansion is fueled by a confluence of technological advancements, shifting consumer preferences, and evolving utility operational needs. Technological shifts are at the forefront, with a strong move towards more sophisticated wireless smart meters offering enhanced connectivity, faster data transmission, and greater flexibility in deployment. The increasing adoption of IoT (Internet of Things) technologies is further accelerating this trend, enabling seamless integration with smart home ecosystems and advanced data analytics platforms. Consumer preferences are increasingly leaning towards greater control and transparency over their energy consumption. Smart meters empower homeowners with detailed usage data, facilitating better energy management, cost savings, and a reduced carbon footprint. This growing awareness of environmental sustainability is a significant market driver.
Utility companies are recognizing the immense potential of smart meters to optimize their operations. Outage management systems are significantly improved through real-time data from smart meters, allowing for quicker identification and restoration of power, thereby enhancing customer satisfaction and reducing operational costs. Furthermore, smart meters are instrumental in implementing demand response programs, enabling utilities to better manage peak load demands and integrate renewable energy sources more effectively into the grid. The market penetration rate of smart meters is steadily increasing across the US, driven by ongoing utility rollouts and government mandates. The CAGR (Compound Annual Growth Rate) for the US residential smart meters market is expected to remain strong throughout the forecast period, indicating sustained investment and adoption. The market presents numerous opportunities for innovation in areas such as cybersecurity, advanced metering infrastructure (AMI) integration, and data analytics services that leverage the vast amounts of data generated by these devices. The transition towards a more digitized and intelligent energy infrastructure underpins the continued expansion of this vital market.
Dominant Markets & Segments in US Residential Smart Meters Market
The US residential smart meters market is dominated by Electric smart meters, reflecting the ubiquitous nature of electricity consumption in every household. The widespread infrastructure for electricity distribution and the critical need for efficient energy management in this segment are key drivers.
- Electric Smart Meters: This segment holds the largest market share due to the fundamental role of electricity in residential settings and the ongoing modernization of the electric grid. Government initiatives promoting smart grid technologies and renewable energy integration further bolster its dominance.
- Communication: Wireless smart meters are rapidly gaining prominence over wired counterparts. The ease of installation, flexibility in deployment, and cost-effectiveness of wireless technologies, such as cellular and radio frequency, make them the preferred choice for widespread residential deployments.
- Technology: Within wireless technologies, cellular communication and RF mesh networks are particularly dominant, offering reliable data transmission over extended ranges and supporting dense deployments.
- Application: Energy monitoring is the most prominent application, empowering consumers with granular insights into their electricity usage, enabling them to make informed decisions for cost savings and efficiency. Outage management is another critical application, with smart meters providing real-time data to utilities for faster power restoration and improved grid reliability. Demand response is an increasingly important application, allowing utilities to manage grid load by incentivizing consumers to reduce consumption during peak periods.
The dominance of these segments is underpinned by factors such as large-scale utility investment in smart grid infrastructure, supportive federal and state policies encouraging smart meter adoption, and a growing consumer demand for data-driven energy management tools. The ongoing rollouts by major utility companies across various states are significantly contributing to the market penetration and growth of these dominant segments.
US Residential Smart Meters Market Product Analysis
US residential smart meters are evolving rapidly, with a strong emphasis on enhanced functionality and data intelligence. Innovations are focused on improving accuracy, reliability, and the seamless integration of data into advanced analytics platforms. Key competitive advantages lie in secure wireless communication capabilities, enabling real-time data transmission for effective energy monitoring and outage management. Manufacturers are investing in robust cybersecurity features to protect sensitive consumer data and ensure grid integrity. The market is witnessing the introduction of meters with expanded communication protocols and interoperability, allowing for integration with various smart home devices and utility back-end systems. These advancements are crucial for enabling sophisticated demand response programs and supporting the integration of distributed energy resources.
Key Drivers, Barriers & Challenges in US Residential Smart Meters Market
Key Drivers, Barriers & Challenges in US Residential Smart Meters Market
Key Drivers:
- Government Initiatives and Mandates: Federal and state policies promoting grid modernization, energy efficiency, and smart grid deployment are significant growth catalysts.
- Technological Advancements: Continuous innovation in wireless communication, data analytics, and IoT integration enhances meter capabilities and data utilization.
- Consumer Demand for Energy Efficiency: Growing environmental awareness and a desire for cost savings are driving consumer interest in energy management tools provided by smart meters.
- Utility Operational Efficiency: Smart meters enable utilities to optimize operations, reduce costs, and improve customer service through real-time data for outage management and load balancing.
Barriers and Challenges:
- High Upfront Investment Costs: The initial cost of deploying a large-scale smart meter infrastructure can be substantial for utilities, requiring significant capital allocation.
- Cybersecurity Concerns: Protecting sensitive consumer data and ensuring the integrity of the grid from cyber threats remains a critical challenge.
- Regulatory Hurdles and Standardization: Navigating complex regulatory landscapes and ensuring interoperability standards across different technologies can be challenging.
- Public Perception and Privacy Concerns: Addressing consumer concerns regarding data privacy and electromagnetic field (EMF) exposure is crucial for widespread acceptance.
- Integration Complexity: Integrating new smart meter data with legacy utility systems can be complex and time-consuming.
Growth Drivers in the US Residential Smart Meters Market Market
Key growth drivers in the US residential smart meters market are multifaceted, encompassing technological, economic, and regulatory factors. Technological advancements in wireless communication protocols (e.g., 5G, LPWAN), enhanced data analytics capabilities, and the integration of Artificial Intelligence (AI) are creating more sophisticated and valuable meter solutions. Economically, rising energy costs and a growing consumer consciousness towards sustainability are fueling the demand for energy monitoring and demand response applications. Federal and state government initiatives, such as incentives for grid modernization and mandates for smart meter deployment, act as powerful regulatory drivers. For instance, the push for a more resilient and efficient energy grid directly supports the widespread adoption of smart metering technology.
Challenges Impacting US Residential Smart Meters Market Growth
Challenges impacting US residential smart meters market growth include significant regulatory complexities and the need for continuous adaptation to evolving data privacy laws. Supply chain issues, particularly concerning semiconductor availability, can lead to deployment delays and increased costs for manufacturers. Furthermore, competitive pressures from established players and emerging technology providers necessitate ongoing innovation and cost optimization. The high upfront investment cost for utilities remains a barrier, requiring careful financial planning and justification. Addressing public perception and ensuring robust cybersecurity measures are paramount to building trust and ensuring the secure operation of smart meter networks.
Key Players Shaping the US Residential Smart Meters Market Market
- Itron Inc
- Badger Meter Inc
- Elster Group GmbH (Honeywell International Inc)
- Wasion Holdings Limited
- Kamstrup A/S
- Neptune Technology Group Inc
- Sensus USA Inc (Xylem Inc )
- Aclara Technologies Inc (Hubbel Inc )
- Landis+GYR Group AG
- General Electric Company
- Diehl Metering U S
- Mueller Systems LLC
Significant US Residential Smart Meters Market Industry Milestones
- September 2023: Southwestern Electric Power Co., an American Electric Power company, announced the commencement of advanced digital smart meter installations in Louisiana for approximately 234,000 customers, utilizing secure wireless technology for accurate readings and real-time outage notifications. Deployment is slated to continue across the state through 2025.
- August 2023: United States, Rankin Road West MUD partnered with WasteWater Management Services and Accurate Meter to implement smart water meters. This initiative aims to modernize operations, improve customer experience, reduce water loss, enhance usage visibility, and accelerate reporting.
Future Outlook for US Residential Smart Meters Market Market
The US residential smart meters market is poised for continued expansion, driven by the ongoing transition towards a smarter, more connected, and resilient energy infrastructure. Strategic opportunities lie in the development of advanced data analytics platforms that leverage the vast datasets generated by smart meters, offering valuable insights to both consumers and utilities. The increasing integration of smart meters with renewable energy sources, electric vehicle charging infrastructure, and smart home ecosystems will further enhance their value proposition. Continued government support for grid modernization and a growing consumer demand for energy efficiency and control will act as sustained growth catalysts. The market is expected to witness further innovation in cybersecurity, interoperability, and the development of comprehensive energy management solutions, solidifying the central role of smart meters in the future of residential energy consumption.
US Residential Smart Meters Market Segmentation
-
1. Type
- 1.1. Electric smart meters
- 1.2. Gas smart meters
- 1.3. Communication
-
2. Technology
- 2.1. Wireless smart meters
- 2.2. Wired smart meters
-
3. Application
- 3.1. Energy monitoring
- 3.2. Outage management
- 3.3. Demand response
US Residential Smart Meters Market Segmentation By Geography
-
1. North America
- 1.1. United States
- 1.2. Canada
- 1.3. Mexico
-
2. South America
- 2.1. Brazil
- 2.2. Argentina
- 2.3. Rest of South America
-
3. Europe
- 3.1. United Kingdom
- 3.2. Germany
- 3.3. France
- 3.4. Italy
- 3.5. Spain
- 3.6. Russia
- 3.7. Benelux
- 3.8. Nordics
- 3.9. Rest of Europe
-
4. Middle East & Africa
- 4.1. Turkey
- 4.2. Israel
- 4.3. GCC
- 4.4. North Africa
- 4.5. South Africa
- 4.6. Rest of Middle East & Africa
-
5. Asia Pacific
- 5.1. China
- 5.2. India
- 5.3. Japan
- 5.4. South Korea
- 5.5. ASEAN
- 5.6. Oceania
- 5.7. Rest of Asia Pacific
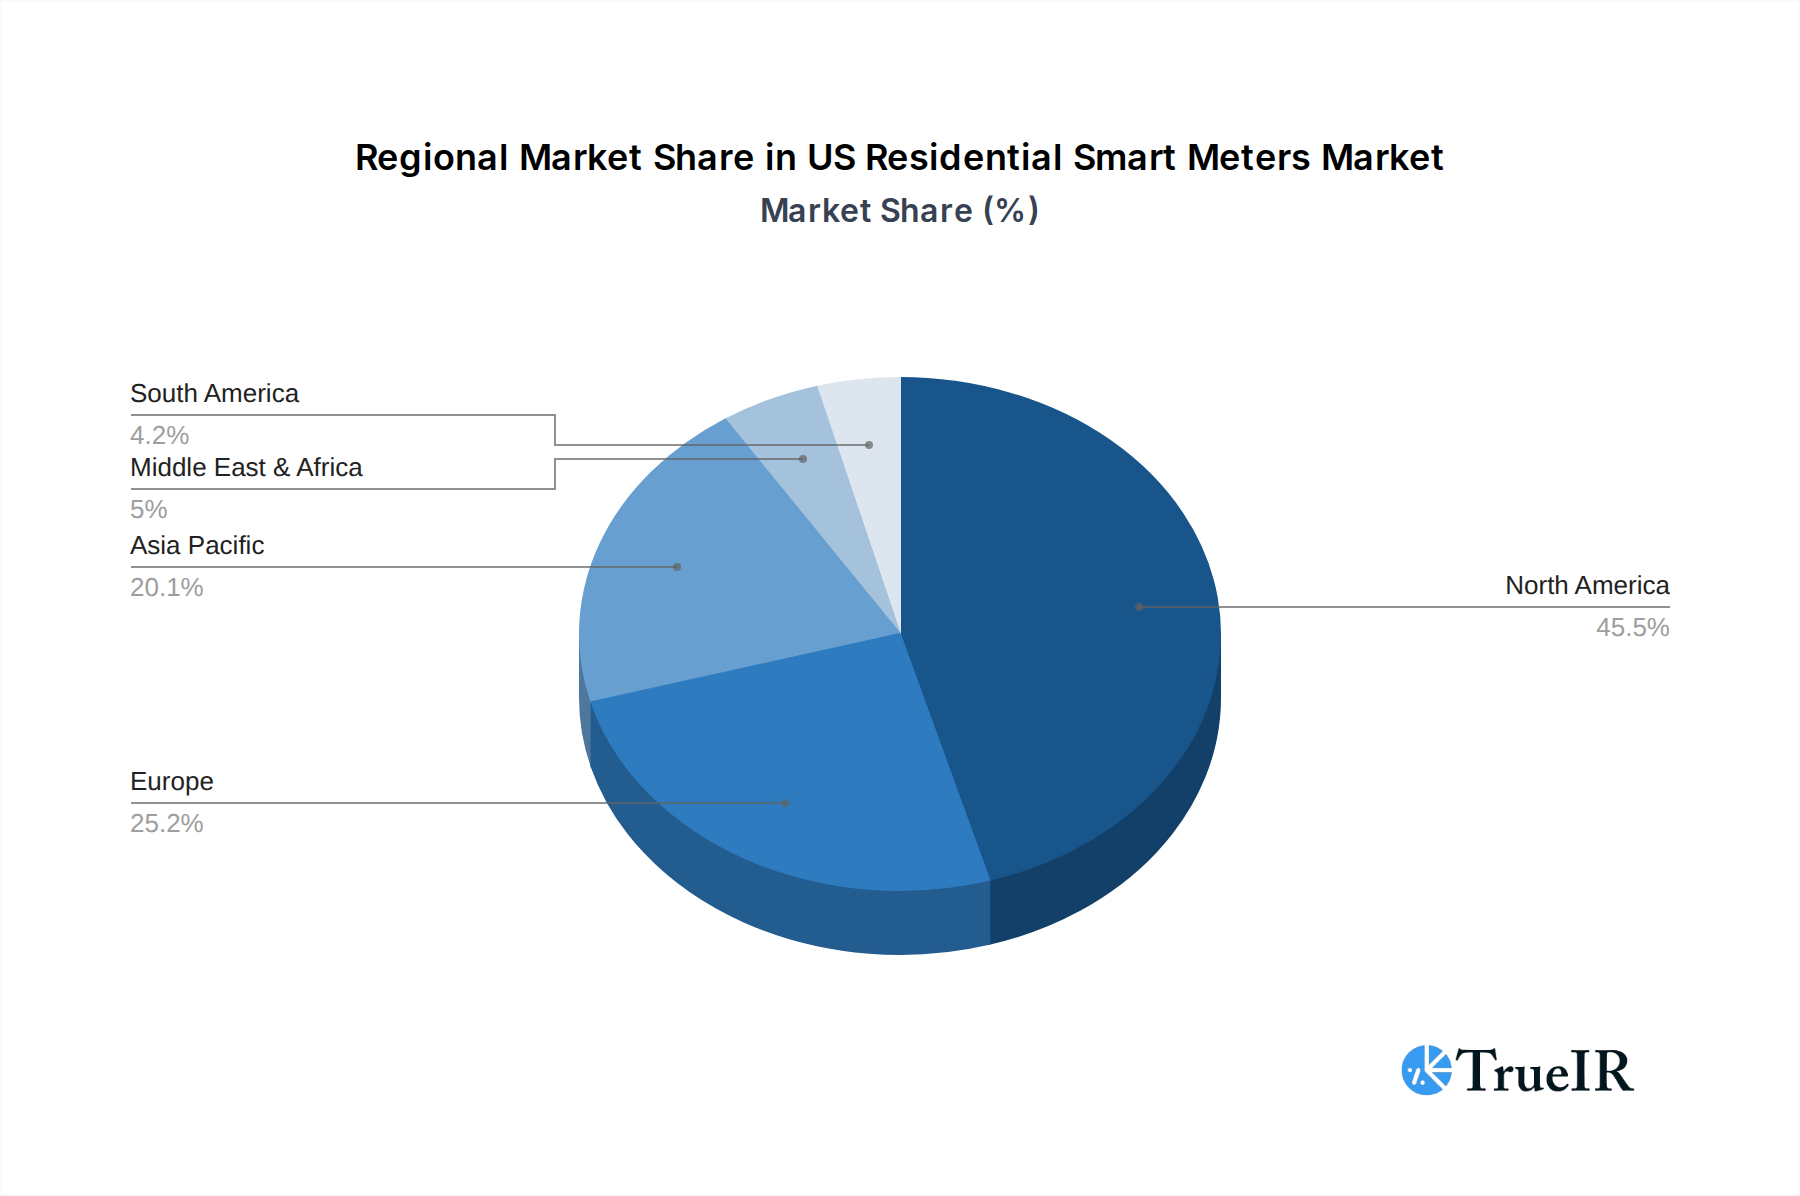
US Residential Smart Meters Market Regional Market Share
Geographic Coverage of US Residential Smart Meters Market
US Residential Smart Meters Market REPORT HIGHLIGHTS
| Aspects | Details |
|---|---|
| Study Period | 2020-2034 |
| Base Year | 2025 |
| Estimated Year | 2026 |
| Forecast Period | 2026-2034 |
| Historical Period | 2020-2025 |
| Growth Rate | CAGR of 6.32% from 2020-2034 |
| Segmentation |
|
Table of Contents
- 1. Introduction
- 1.1. Research Scope
- 1.2. Market Segmentation
- 1.3. Research Objective
- 1.4. Definitions and Assumptions
- 2. Executive Summary
- 2.1. Market Snapshot
- 3. Market Dynamics
- 3.1. Market Drivers
- 3.2. Market Restrains
- 3.3. Market Trends
- 3.4. Market Opportunities
- 4. Market Factor Analysis
- 4.1. Porters Five Forces
- 4.1.1. Bargaining Power of Suppliers
- 4.1.2. Bargaining Power of Buyers
- 4.1.3. Threat of New Entrants
- 4.1.4. Threat of Substitutes
- 4.1.5. Competitive Rivalry
- 4.2. PESTEL analysis
- 4.3. BCG Analysis
- 4.3.1. Stars (High Growth, High Market Share)
- 4.3.2. Cash Cows (Low Growth, High Market Share)
- 4.3.3. Question Mark (High Growth, Low Market Share)
- 4.3.4. Dogs (Low Growth, Low Market Share)
- 4.4. Ansoff Matrix Analysis
- 4.5. Supply Chain Analysis
- 4.6. Regulatory Landscape
- 4.7. Current Market Potential and Opportunity Assessment (TAM–SAM–SOM Framework)
- 4.8. TIR Analyst Note
- 4.1. Porters Five Forces
- 5. Market Analysis, Insights and Forecast 2021-2033
- 5.1. Market Analysis, Insights and Forecast - by Type
- 5.1.1. Electric smart meters
- 5.1.2. Gas smart meters
- 5.1.3. Communication
- 5.2. Market Analysis, Insights and Forecast - by Technology
- 5.2.1. Wireless smart meters
- 5.2.2. Wired smart meters
- 5.3. Market Analysis, Insights and Forecast - by Application
- 5.3.1. Energy monitoring
- 5.3.2. Outage management
- 5.3.3. Demand response
- 5.4. Market Analysis, Insights and Forecast - by Region
- 5.4.1. North America
- 5.4.2. South America
- 5.4.3. Europe
- 5.4.4. Middle East & Africa
- 5.4.5. Asia Pacific
- 5.1. Market Analysis, Insights and Forecast - by Type
- 6. Global US Residential Smart Meters Market Analysis, Insights and Forecast, 2021-2033
- 6.1. Market Analysis, Insights and Forecast - by Type
- 6.1.1. Electric smart meters
- 6.1.2. Gas smart meters
- 6.1.3. Communication
- 6.2. Market Analysis, Insights and Forecast - by Technology
- 6.2.1. Wireless smart meters
- 6.2.2. Wired smart meters
- 6.3. Market Analysis, Insights and Forecast - by Application
- 6.3.1. Energy monitoring
- 6.3.2. Outage management
- 6.3.3. Demand response
- 6.1. Market Analysis, Insights and Forecast - by Type
- 7. North America US Residential Smart Meters Market Analysis, Insights and Forecast, 2020-2032
- 7.1. Market Analysis, Insights and Forecast - by Type
- 7.1.1. Electric smart meters
- 7.1.2. Gas smart meters
- 7.1.3. Communication
- 7.2. Market Analysis, Insights and Forecast - by Technology
- 7.2.1. Wireless smart meters
- 7.2.2. Wired smart meters
- 7.3. Market Analysis, Insights and Forecast - by Application
- 7.3.1. Energy monitoring
- 7.3.2. Outage management
- 7.3.3. Demand response
- 7.1. Market Analysis, Insights and Forecast - by Type
- 8. South America US Residential Smart Meters Market Analysis, Insights and Forecast, 2020-2032
- 8.1. Market Analysis, Insights and Forecast - by Type
- 8.1.1. Electric smart meters
- 8.1.2. Gas smart meters
- 8.1.3. Communication
- 8.2. Market Analysis, Insights and Forecast - by Technology
- 8.2.1. Wireless smart meters
- 8.2.2. Wired smart meters
- 8.3. Market Analysis, Insights and Forecast - by Application
- 8.3.1. Energy monitoring
- 8.3.2. Outage management
- 8.3.3. Demand response
- 8.1. Market Analysis, Insights and Forecast - by Type
- 9. Europe US Residential Smart Meters Market Analysis, Insights and Forecast, 2020-2032
- 9.1. Market Analysis, Insights and Forecast - by Type
- 9.1.1. Electric smart meters
- 9.1.2. Gas smart meters
- 9.1.3. Communication
- 9.2. Market Analysis, Insights and Forecast - by Technology
- 9.2.1. Wireless smart meters
- 9.2.2. Wired smart meters
- 9.3. Market Analysis, Insights and Forecast - by Application
- 9.3.1. Energy monitoring
- 9.3.2. Outage management
- 9.3.3. Demand response
- 9.1. Market Analysis, Insights and Forecast - by Type
- 10. Middle East & Africa US Residential Smart Meters Market Analysis, Insights and Forecast, 2020-2032
- 10.1. Market Analysis, Insights and Forecast - by Type
- 10.1.1. Electric smart meters
- 10.1.2. Gas smart meters
- 10.1.3. Communication
- 10.2. Market Analysis, Insights and Forecast - by Technology
- 10.2.1. Wireless smart meters
- 10.2.2. Wired smart meters
- 10.3. Market Analysis, Insights and Forecast - by Application
- 10.3.1. Energy monitoring
- 10.3.2. Outage management
- 10.3.3. Demand response
- 10.1. Market Analysis, Insights and Forecast - by Type
- 11. Asia Pacific US Residential Smart Meters Market Analysis, Insights and Forecast, 2020-2032
- 11.1. Market Analysis, Insights and Forecast - by Type
- 11.1.1. Electric smart meters
- 11.1.2. Gas smart meters
- 11.1.3. Communication
- 11.2. Market Analysis, Insights and Forecast - by Technology
- 11.2.1. Wireless smart meters
- 11.2.2. Wired smart meters
- 11.3. Market Analysis, Insights and Forecast - by Application
- 11.3.1. Energy monitoring
- 11.3.2. Outage management
- 11.3.3. Demand response
- 11.1. Market Analysis, Insights and Forecast - by Type
- 12. Competitive Analysis
- 12.1. Company Profiles
- 12.1.1 Itron Inc
- 12.1.1.1. Company Overview
- 12.1.1.2. Products
- 12.1.1.3. Company Financials
- 12.1.1.4. SWOT Analysis
- 12.1.2 Badger Meter Inc
- 12.1.2.1. Company Overview
- 12.1.2.2. Products
- 12.1.2.3. Company Financials
- 12.1.2.4. SWOT Analysis
- 12.1.3 Elster Group GmbH (Honeywell International Inc)
- 12.1.3.1. Company Overview
- 12.1.3.2. Products
- 12.1.3.3. Company Financials
- 12.1.3.4. SWOT Analysis
- 12.1.4 Wasion Holdings Limited
- 12.1.4.1. Company Overview
- 12.1.4.2. Products
- 12.1.4.3. Company Financials
- 12.1.4.4. SWOT Analysis
- 12.1.5 Kamstrup A/S
- 12.1.5.1. Company Overview
- 12.1.5.2. Products
- 12.1.5.3. Company Financials
- 12.1.5.4. SWOT Analysis
- 12.1.6 Neptune Technology Group Inc
- 12.1.6.1. Company Overview
- 12.1.6.2. Products
- 12.1.6.3. Company Financials
- 12.1.6.4. SWOT Analysis
- 12.1.7 Sensus USA Inc (Xylem Inc )
- 12.1.7.1. Company Overview
- 12.1.7.2. Products
- 12.1.7.3. Company Financials
- 12.1.7.4. SWOT Analysis
- 12.1.8 Aclara Technologies Inc (Hubbel Inc )
- 12.1.8.1. Company Overview
- 12.1.8.2. Products
- 12.1.8.3. Company Financials
- 12.1.8.4. SWOT Analysis
- 12.1.9 Landis+GYR Group AG
- 12.1.9.1. Company Overview
- 12.1.9.2. Products
- 12.1.9.3. Company Financials
- 12.1.9.4. SWOT Analysis
- 12.1.10 General Electric Company
- 12.1.10.1. Company Overview
- 12.1.10.2. Products
- 12.1.10.3. Company Financials
- 12.1.10.4. SWOT Analysis
- 12.1.11 Diehl Metering U S
- 12.1.11.1. Company Overview
- 12.1.11.2. Products
- 12.1.11.3. Company Financials
- 12.1.11.4. SWOT Analysis
- 12.1.12 Mueller Systems LLC
- 12.1.12.1. Company Overview
- 12.1.12.2. Products
- 12.1.12.3. Company Financials
- 12.1.12.4. SWOT Analysis
- 12.1.1 Itron Inc
- 12.2. Market Entropy
- 12.2.1 Company's Key Areas Served
- 12.2.2 Recent Developments
- 12.3. Company Market Share Analysis 2025
- 12.3.1 Top 5 Companies Market Share Analysis
- 12.3.2 Top 3 Companies Market Share Analysis
- 12.4. List of Potential Customers
- 13. Research Methodology
List of Figures
- Figure 1: Global US Residential Smart Meters Market Revenue Breakdown (million, %) by Region 2025 & 2033
- Figure 2: Global US Residential Smart Meters Market Volume Breakdown (Million, %) by Region 2025 & 2033
- Figure 3: North America US Residential Smart Meters Market Revenue (million), by Type 2025 & 2033
- Figure 4: North America US Residential Smart Meters Market Volume (Million), by Type 2025 & 2033
- Figure 5: North America US Residential Smart Meters Market Revenue Share (%), by Type 2025 & 2033
- Figure 6: North America US Residential Smart Meters Market Volume Share (%), by Type 2025 & 2033
- Figure 7: North America US Residential Smart Meters Market Revenue (million), by Technology 2025 & 2033
- Figure 8: North America US Residential Smart Meters Market Volume (Million), by Technology 2025 & 2033
- Figure 9: North America US Residential Smart Meters Market Revenue Share (%), by Technology 2025 & 2033
- Figure 10: North America US Residential Smart Meters Market Volume Share (%), by Technology 2025 & 2033
- Figure 11: North America US Residential Smart Meters Market Revenue (million), by Application 2025 & 2033
- Figure 12: North America US Residential Smart Meters Market Volume (Million), by Application 2025 & 2033
- Figure 13: North America US Residential Smart Meters Market Revenue Share (%), by Application 2025 & 2033
- Figure 14: North America US Residential Smart Meters Market Volume Share (%), by Application 2025 & 2033
- Figure 15: North America US Residential Smart Meters Market Revenue (million), by Country 2025 & 2033
- Figure 16: North America US Residential Smart Meters Market Volume (Million), by Country 2025 & 2033
- Figure 17: North America US Residential Smart Meters Market Revenue Share (%), by Country 2025 & 2033
- Figure 18: North America US Residential Smart Meters Market Volume Share (%), by Country 2025 & 2033
- Figure 19: South America US Residential Smart Meters Market Revenue (million), by Type 2025 & 2033
- Figure 20: South America US Residential Smart Meters Market Volume (Million), by Type 2025 & 2033
- Figure 21: South America US Residential Smart Meters Market Revenue Share (%), by Type 2025 & 2033
- Figure 22: South America US Residential Smart Meters Market Volume Share (%), by Type 2025 & 2033
- Figure 23: South America US Residential Smart Meters Market Revenue (million), by Technology 2025 & 2033
- Figure 24: South America US Residential Smart Meters Market Volume (Million), by Technology 2025 & 2033
- Figure 25: South America US Residential Smart Meters Market Revenue Share (%), by Technology 2025 & 2033
- Figure 26: South America US Residential Smart Meters Market Volume Share (%), by Technology 2025 & 2033
- Figure 27: South America US Residential Smart Meters Market Revenue (million), by Application 2025 & 2033
- Figure 28: South America US Residential Smart Meters Market Volume (Million), by Application 2025 & 2033
- Figure 29: South America US Residential Smart Meters Market Revenue Share (%), by Application 2025 & 2033
- Figure 30: South America US Residential Smart Meters Market Volume Share (%), by Application 2025 & 2033
- Figure 31: South America US Residential Smart Meters Market Revenue (million), by Country 2025 & 2033
- Figure 32: South America US Residential Smart Meters Market Volume (Million), by Country 2025 & 2033
- Figure 33: South America US Residential Smart Meters Market Revenue Share (%), by Country 2025 & 2033
- Figure 34: South America US Residential Smart Meters Market Volume Share (%), by Country 2025 & 2033
- Figure 35: Europe US Residential Smart Meters Market Revenue (million), by Type 2025 & 2033
- Figure 36: Europe US Residential Smart Meters Market Volume (Million), by Type 2025 & 2033
- Figure 37: Europe US Residential Smart Meters Market Revenue Share (%), by Type 2025 & 2033
- Figure 38: Europe US Residential Smart Meters Market Volume Share (%), by Type 2025 & 2033
- Figure 39: Europe US Residential Smart Meters Market Revenue (million), by Technology 2025 & 2033
- Figure 40: Europe US Residential Smart Meters Market Volume (Million), by Technology 2025 & 2033
- Figure 41: Europe US Residential Smart Meters Market Revenue Share (%), by Technology 2025 & 2033
- Figure 42: Europe US Residential Smart Meters Market Volume Share (%), by Technology 2025 & 2033
- Figure 43: Europe US Residential Smart Meters Market Revenue (million), by Application 2025 & 2033
- Figure 44: Europe US Residential Smart Meters Market Volume (Million), by Application 2025 & 2033
- Figure 45: Europe US Residential Smart Meters Market Revenue Share (%), by Application 2025 & 2033
- Figure 46: Europe US Residential Smart Meters Market Volume Share (%), by Application 2025 & 2033
- Figure 47: Europe US Residential Smart Meters Market Revenue (million), by Country 2025 & 2033
- Figure 48: Europe US Residential Smart Meters Market Volume (Million), by Country 2025 & 2033
- Figure 49: Europe US Residential Smart Meters Market Revenue Share (%), by Country 2025 & 2033
- Figure 50: Europe US Residential Smart Meters Market Volume Share (%), by Country 2025 & 2033
- Figure 51: Middle East & Africa US Residential Smart Meters Market Revenue (million), by Type 2025 & 2033
- Figure 52: Middle East & Africa US Residential Smart Meters Market Volume (Million), by Type 2025 & 2033
- Figure 53: Middle East & Africa US Residential Smart Meters Market Revenue Share (%), by Type 2025 & 2033
- Figure 54: Middle East & Africa US Residential Smart Meters Market Volume Share (%), by Type 2025 & 2033
- Figure 55: Middle East & Africa US Residential Smart Meters Market Revenue (million), by Technology 2025 & 2033
- Figure 56: Middle East & Africa US Residential Smart Meters Market Volume (Million), by Technology 2025 & 2033
- Figure 57: Middle East & Africa US Residential Smart Meters Market Revenue Share (%), by Technology 2025 & 2033
- Figure 58: Middle East & Africa US Residential Smart Meters Market Volume Share (%), by Technology 2025 & 2033
- Figure 59: Middle East & Africa US Residential Smart Meters Market Revenue (million), by Application 2025 & 2033
- Figure 60: Middle East & Africa US Residential Smart Meters Market Volume (Million), by Application 2025 & 2033
- Figure 61: Middle East & Africa US Residential Smart Meters Market Revenue Share (%), by Application 2025 & 2033
- Figure 62: Middle East & Africa US Residential Smart Meters Market Volume Share (%), by Application 2025 & 2033
- Figure 63: Middle East & Africa US Residential Smart Meters Market Revenue (million), by Country 2025 & 2033
- Figure 64: Middle East & Africa US Residential Smart Meters Market Volume (Million), by Country 2025 & 2033
- Figure 65: Middle East & Africa US Residential Smart Meters Market Revenue Share (%), by Country 2025 & 2033
- Figure 66: Middle East & Africa US Residential Smart Meters Market Volume Share (%), by Country 2025 & 2033
- Figure 67: Asia Pacific US Residential Smart Meters Market Revenue (million), by Type 2025 & 2033
- Figure 68: Asia Pacific US Residential Smart Meters Market Volume (Million), by Type 2025 & 2033
- Figure 69: Asia Pacific US Residential Smart Meters Market Revenue Share (%), by Type 2025 & 2033
- Figure 70: Asia Pacific US Residential Smart Meters Market Volume Share (%), by Type 2025 & 2033
- Figure 71: Asia Pacific US Residential Smart Meters Market Revenue (million), by Technology 2025 & 2033
- Figure 72: Asia Pacific US Residential Smart Meters Market Volume (Million), by Technology 2025 & 2033
- Figure 73: Asia Pacific US Residential Smart Meters Market Revenue Share (%), by Technology 2025 & 2033
- Figure 74: Asia Pacific US Residential Smart Meters Market Volume Share (%), by Technology 2025 & 2033
- Figure 75: Asia Pacific US Residential Smart Meters Market Revenue (million), by Application 2025 & 2033
- Figure 76: Asia Pacific US Residential Smart Meters Market Volume (Million), by Application 2025 & 2033
- Figure 77: Asia Pacific US Residential Smart Meters Market Revenue Share (%), by Application 2025 & 2033
- Figure 78: Asia Pacific US Residential Smart Meters Market Volume Share (%), by Application 2025 & 2033
- Figure 79: Asia Pacific US Residential Smart Meters Market Revenue (million), by Country 2025 & 2033
- Figure 80: Asia Pacific US Residential Smart Meters Market Volume (Million), by Country 2025 & 2033
- Figure 81: Asia Pacific US Residential Smart Meters Market Revenue Share (%), by Country 2025 & 2033
- Figure 82: Asia Pacific US Residential Smart Meters Market Volume Share (%), by Country 2025 & 2033
List of Tables
- Table 1: Global US Residential Smart Meters Market Revenue million Forecast, by Type 2020 & 2033
- Table 2: Global US Residential Smart Meters Market Volume Million Forecast, by Type 2020 & 2033
- Table 3: Global US Residential Smart Meters Market Revenue million Forecast, by Technology 2020 & 2033
- Table 4: Global US Residential Smart Meters Market Volume Million Forecast, by Technology 2020 & 2033
- Table 5: Global US Residential Smart Meters Market Revenue million Forecast, by Application 2020 & 2033
- Table 6: Global US Residential Smart Meters Market Volume Million Forecast, by Application 2020 & 2033
- Table 7: Global US Residential Smart Meters Market Revenue million Forecast, by Region 2020 & 2033
- Table 8: Global US Residential Smart Meters Market Volume Million Forecast, by Region 2020 & 2033
- Table 9: Global US Residential Smart Meters Market Revenue million Forecast, by Type 2020 & 2033
- Table 10: Global US Residential Smart Meters Market Volume Million Forecast, by Type 2020 & 2033
- Table 11: Global US Residential Smart Meters Market Revenue million Forecast, by Technology 2020 & 2033
- Table 12: Global US Residential Smart Meters Market Volume Million Forecast, by Technology 2020 & 2033
- Table 13: Global US Residential Smart Meters Market Revenue million Forecast, by Application 2020 & 2033
- Table 14: Global US Residential Smart Meters Market Volume Million Forecast, by Application 2020 & 2033
- Table 15: Global US Residential Smart Meters Market Revenue million Forecast, by Country 2020 & 2033
- Table 16: Global US Residential Smart Meters Market Volume Million Forecast, by Country 2020 & 2033
- Table 17: United States US Residential Smart Meters Market Revenue (million) Forecast, by Application 2020 & 2033
- Table 18: United States US Residential Smart Meters Market Volume (Million) Forecast, by Application 2020 & 2033
- Table 19: Canada US Residential Smart Meters Market Revenue (million) Forecast, by Application 2020 & 2033
- Table 20: Canada US Residential Smart Meters Market Volume (Million) Forecast, by Application 2020 & 2033
- Table 21: Mexico US Residential Smart Meters Market Revenue (million) Forecast, by Application 2020 & 2033
- Table 22: Mexico US Residential Smart Meters Market Volume (Million) Forecast, by Application 2020 & 2033
- Table 23: Global US Residential Smart Meters Market Revenue million Forecast, by Type 2020 & 2033
- Table 24: Global US Residential Smart Meters Market Volume Million Forecast, by Type 2020 & 2033
- Table 25: Global US Residential Smart Meters Market Revenue million Forecast, by Technology 2020 & 2033
- Table 26: Global US Residential Smart Meters Market Volume Million Forecast, by Technology 2020 & 2033
- Table 27: Global US Residential Smart Meters Market Revenue million Forecast, by Application 2020 & 2033
- Table 28: Global US Residential Smart Meters Market Volume Million Forecast, by Application 2020 & 2033
- Table 29: Global US Residential Smart Meters Market Revenue million Forecast, by Country 2020 & 2033
- Table 30: Global US Residential Smart Meters Market Volume Million Forecast, by Country 2020 & 2033
- Table 31: Brazil US Residential Smart Meters Market Revenue (million) Forecast, by Application 2020 & 2033
- Table 32: Brazil US Residential Smart Meters Market Volume (Million) Forecast, by Application 2020 & 2033
- Table 33: Argentina US Residential Smart Meters Market Revenue (million) Forecast, by Application 2020 & 2033
- Table 34: Argentina US Residential Smart Meters Market Volume (Million) Forecast, by Application 2020 & 2033
- Table 35: Rest of South America US Residential Smart Meters Market Revenue (million) Forecast, by Application 2020 & 2033
- Table 36: Rest of South America US Residential Smart Meters Market Volume (Million) Forecast, by Application 2020 & 2033
- Table 37: Global US Residential Smart Meters Market Revenue million Forecast, by Type 2020 & 2033
- Table 38: Global US Residential Smart Meters Market Volume Million Forecast, by Type 2020 & 2033
- Table 39: Global US Residential Smart Meters Market Revenue million Forecast, by Technology 2020 & 2033
- Table 40: Global US Residential Smart Meters Market Volume Million Forecast, by Technology 2020 & 2033
- Table 41: Global US Residential Smart Meters Market Revenue million Forecast, by Application 2020 & 2033
- Table 42: Global US Residential Smart Meters Market Volume Million Forecast, by Application 2020 & 2033
- Table 43: Global US Residential Smart Meters Market Revenue million Forecast, by Country 2020 & 2033
- Table 44: Global US Residential Smart Meters Market Volume Million Forecast, by Country 2020 & 2033
- Table 45: United Kingdom US Residential Smart Meters Market Revenue (million) Forecast, by Application 2020 & 2033
- Table 46: United Kingdom US Residential Smart Meters Market Volume (Million) Forecast, by Application 2020 & 2033
- Table 47: Germany US Residential Smart Meters Market Revenue (million) Forecast, by Application 2020 & 2033
- Table 48: Germany US Residential Smart Meters Market Volume (Million) Forecast, by Application 2020 & 2033
- Table 49: France US Residential Smart Meters Market Revenue (million) Forecast, by Application 2020 & 2033
- Table 50: France US Residential Smart Meters Market Volume (Million) Forecast, by Application 2020 & 2033
- Table 51: Italy US Residential Smart Meters Market Revenue (million) Forecast, by Application 2020 & 2033
- Table 52: Italy US Residential Smart Meters Market Volume (Million) Forecast, by Application 2020 & 2033
- Table 53: Spain US Residential Smart Meters Market Revenue (million) Forecast, by Application 2020 & 2033
- Table 54: Spain US Residential Smart Meters Market Volume (Million) Forecast, by Application 2020 & 2033
- Table 55: Russia US Residential Smart Meters Market Revenue (million) Forecast, by Application 2020 & 2033
- Table 56: Russia US Residential Smart Meters Market Volume (Million) Forecast, by Application 2020 & 2033
- Table 57: Benelux US Residential Smart Meters Market Revenue (million) Forecast, by Application 2020 & 2033
- Table 58: Benelux US Residential Smart Meters Market Volume (Million) Forecast, by Application 2020 & 2033
- Table 59: Nordics US Residential Smart Meters Market Revenue (million) Forecast, by Application 2020 & 2033
- Table 60: Nordics US Residential Smart Meters Market Volume (Million) Forecast, by Application 2020 & 2033
- Table 61: Rest of Europe US Residential Smart Meters Market Revenue (million) Forecast, by Application 2020 & 2033
- Table 62: Rest of Europe US Residential Smart Meters Market Volume (Million) Forecast, by Application 2020 & 2033
- Table 63: Global US Residential Smart Meters Market Revenue million Forecast, by Type 2020 & 2033
- Table 64: Global US Residential Smart Meters Market Volume Million Forecast, by Type 2020 & 2033
- Table 65: Global US Residential Smart Meters Market Revenue million Forecast, by Technology 2020 & 2033
- Table 66: Global US Residential Smart Meters Market Volume Million Forecast, by Technology 2020 & 2033
- Table 67: Global US Residential Smart Meters Market Revenue million Forecast, by Application 2020 & 2033
- Table 68: Global US Residential Smart Meters Market Volume Million Forecast, by Application 2020 & 2033
- Table 69: Global US Residential Smart Meters Market Revenue million Forecast, by Country 2020 & 2033
- Table 70: Global US Residential Smart Meters Market Volume Million Forecast, by Country 2020 & 2033
- Table 71: Turkey US Residential Smart Meters Market Revenue (million) Forecast, by Application 2020 & 2033
- Table 72: Turkey US Residential Smart Meters Market Volume (Million) Forecast, by Application 2020 & 2033
- Table 73: Israel US Residential Smart Meters Market Revenue (million) Forecast, by Application 2020 & 2033
- Table 74: Israel US Residential Smart Meters Market Volume (Million) Forecast, by Application 2020 & 2033
- Table 75: GCC US Residential Smart Meters Market Revenue (million) Forecast, by Application 2020 & 2033
- Table 76: GCC US Residential Smart Meters Market Volume (Million) Forecast, by Application 2020 & 2033
- Table 77: North Africa US Residential Smart Meters Market Revenue (million) Forecast, by Application 2020 & 2033
- Table 78: North Africa US Residential Smart Meters Market Volume (Million) Forecast, by Application 2020 & 2033
- Table 79: South Africa US Residential Smart Meters Market Revenue (million) Forecast, by Application 2020 & 2033
- Table 80: South Africa US Residential Smart Meters Market Volume (Million) Forecast, by Application 2020 & 2033
- Table 81: Rest of Middle East & Africa US Residential Smart Meters Market Revenue (million) Forecast, by Application 2020 & 2033
- Table 82: Rest of Middle East & Africa US Residential Smart Meters Market Volume (Million) Forecast, by Application 2020 & 2033
- Table 83: Global US Residential Smart Meters Market Revenue million Forecast, by Type 2020 & 2033
- Table 84: Global US Residential Smart Meters Market Volume Million Forecast, by Type 2020 & 2033
- Table 85: Global US Residential Smart Meters Market Revenue million Forecast, by Technology 2020 & 2033
- Table 86: Global US Residential Smart Meters Market Volume Million Forecast, by Technology 2020 & 2033
- Table 87: Global US Residential Smart Meters Market Revenue million Forecast, by Application 2020 & 2033
- Table 88: Global US Residential Smart Meters Market Volume Million Forecast, by Application 2020 & 2033
- Table 89: Global US Residential Smart Meters Market Revenue million Forecast, by Country 2020 & 2033
- Table 90: Global US Residential Smart Meters Market Volume Million Forecast, by Country 2020 & 2033
- Table 91: China US Residential Smart Meters Market Revenue (million) Forecast, by Application 2020 & 2033
- Table 92: China US Residential Smart Meters Market Volume (Million) Forecast, by Application 2020 & 2033
- Table 93: India US Residential Smart Meters Market Revenue (million) Forecast, by Application 2020 & 2033
- Table 94: India US Residential Smart Meters Market Volume (Million) Forecast, by Application 2020 & 2033
- Table 95: Japan US Residential Smart Meters Market Revenue (million) Forecast, by Application 2020 & 2033
- Table 96: Japan US Residential Smart Meters Market Volume (Million) Forecast, by Application 2020 & 2033
- Table 97: South Korea US Residential Smart Meters Market Revenue (million) Forecast, by Application 2020 & 2033
- Table 98: South Korea US Residential Smart Meters Market Volume (Million) Forecast, by Application 2020 & 2033
- Table 99: ASEAN US Residential Smart Meters Market Revenue (million) Forecast, by Application 2020 & 2033
- Table 100: ASEAN US Residential Smart Meters Market Volume (Million) Forecast, by Application 2020 & 2033
- Table 101: Oceania US Residential Smart Meters Market Revenue (million) Forecast, by Application 2020 & 2033
- Table 102: Oceania US Residential Smart Meters Market Volume (Million) Forecast, by Application 2020 & 2033
- Table 103: Rest of Asia Pacific US Residential Smart Meters Market Revenue (million) Forecast, by Application 2020 & 2033
- Table 104: Rest of Asia Pacific US Residential Smart Meters Market Volume (Million) Forecast, by Application 2020 & 2033
Frequently Asked Questions
1. What is the projected Compound Annual Growth Rate (CAGR) of the US Residential Smart Meters Market?
The projected CAGR is approximately 6.32%.
2. Which companies are prominent players in the US Residential Smart Meters Market?
Key companies in the market include Itron Inc, Badger Meter Inc, Elster Group GmbH (Honeywell International Inc), Wasion Holdings Limited, Kamstrup A/S, Neptune Technology Group Inc, Sensus USA Inc (Xylem Inc ), Aclara Technologies Inc (Hubbel Inc ), Landis+GYR Group AG, General Electric Company, Diehl Metering U S, Mueller Systems LLC.
3. What are the main segments of the US Residential Smart Meters Market?
The market segments include Type, Technology, Application.
4. Can you provide details about the market size?
The market size is estimated to be USD 98.93 million as of 2022.
5. What are some drivers contributing to market growth?
Increased Investments in Smart Grid Projects; Growth in Smart City Deployment.
6. What are the notable trends driving market growth?
Increased Investments in Smart Grid Projects to Drive the Market.
7. Are there any restraints impacting market growth?
High Installation Cost and Longer ROI Period; Longer Replacement Cycle of Water Meters.
8. Can you provide examples of recent developments in the market?
September 2023 - Southwestern Electric Power Co., an American Electric Power company, announced that it would begin installing advanced digital meters, more commonly known as smart meters, in Louisiana. Smart meters use secure wireless technology to provide timely and accurate meter reading data, which customers can use to better understand and manage energy usage at a home or business. In addition, smart meters also allow for real-time outage notifications to SWEPCO for more seamless power restoration. Installations to approximately 234,000 Louisiana customers will begin in the Shreveport-Bossier City area in October before moving south to Hornbeck and other parts of SWEPCO’s Louisiana service territory. Deployment of smart meters will continue across the state through 2025.
9. What pricing options are available for accessing the report?
Pricing options include single-user, multi-user, and enterprise licenses priced at USD 3800, USD 4500, and USD 5800 respectively.
10. Is the market size provided in terms of value or volume?
The market size is provided in terms of value, measured in million and volume, measured in Million.
11. Are there any specific market keywords associated with the report?
Yes, the market keyword associated with the report is "US Residential Smart Meters Market," which aids in identifying and referencing the specific market segment covered.
12. How do I determine which pricing option suits my needs best?
The pricing options vary based on user requirements and access needs. Individual users may opt for single-user licenses, while businesses requiring broader access may choose multi-user or enterprise licenses for cost-effective access to the report.
13. Are there any additional resources or data provided in the US Residential Smart Meters Market report?
While the report offers comprehensive insights, it's advisable to review the specific contents or supplementary materials provided to ascertain if additional resources or data are available.
14. How can I stay updated on further developments or reports in the US Residential Smart Meters Market?
To stay informed about further developments, trends, and reports in the US Residential Smart Meters Market, consider subscribing to industry newsletters, following relevant companies and organizations, or regularly checking reputable industry news sources and publications.
Methodology
Step 1 - Identification of Relevant Samples Size from Population Database


Step 2 - Approaches for Defining Global Market Size (Value, Volume* & Price*)

Note*: In applicable scenarios
Step 3 - Data Sources
Primary Research
- Web Analytics
- Survey Reports
- Research Institute
- Latest Research Reports
- Opinion Leaders
Secondary Research
- Annual Reports
- White Paper
- Latest Press Release
- Industry Association
- Paid Database
- Investor Presentations

Step 4 - Data Triangulation
Involves using different sources of information in order to increase the validity of a study
These sources are likely to be stakeholders in a program - participants, other researchers, program staff, other community members, and so on.
Then we put all data in single framework & apply various statistical tools to find out the dynamic on the market.
During the analysis stage, feedback from the stakeholder groups would be compared to determine areas of agreement as well as areas of divergence