

Key Insights
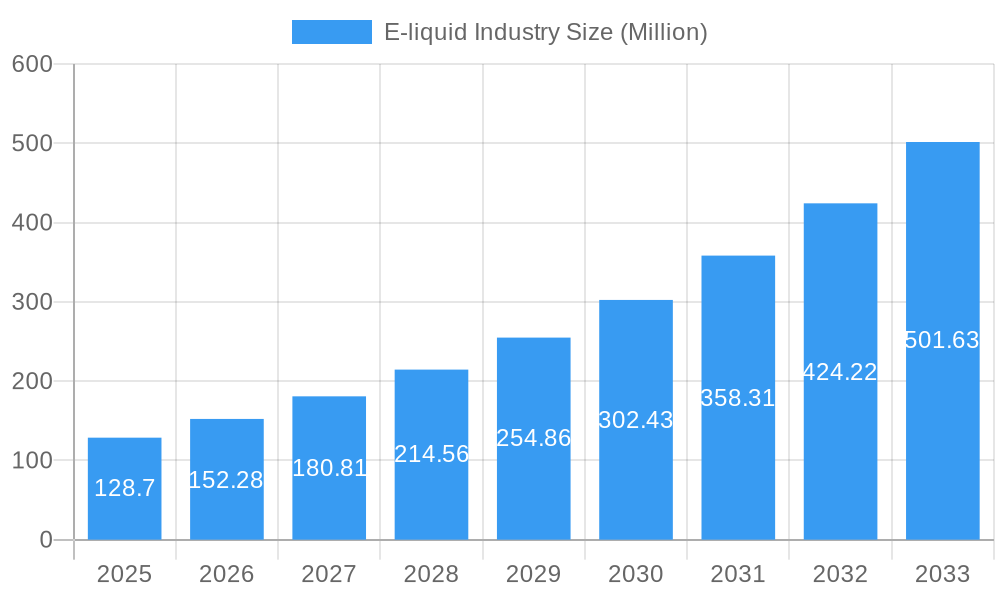
The e-liquid market, valued at $128.70 million in 2025, is projected to experience robust growth, driven by the increasing popularity of vaping and e-cigarettes as alternatives to traditional tobacco products. A Compound Annual Growth Rate (CAGR) of 18.20% from 2025 to 2033 signifies substantial market expansion. Key growth drivers include the rising prevalence of nicotine addiction and the perception of vaping as a less harmful alternative to smoking, although this perception is debated. Furthermore, the diverse range of e-liquid flavors and nicotine strengths caters to a broad consumer base, fueling demand. The market is segmented by product type (e-cigarette devices and e-liquid) and distribution channels (offline and online), with online channels gaining significant traction due to convenience and wider product availability. Major players like RITCHY GROUP, Innokin Technology, and Philip Morris International are strategically investing in research and development, product innovation, and brand marketing to consolidate their market positions. However, stringent regulations concerning e-cigarette sales and usage, particularly regarding nicotine content and advertising, pose significant challenges to market growth. Consumer health concerns and potential long-term effects associated with vaping are also acting as restraints. The geographical distribution is widespread, with North America, Europe, and Asia Pacific representing significant markets, driven by varying levels of vaping adoption and regulatory landscapes.
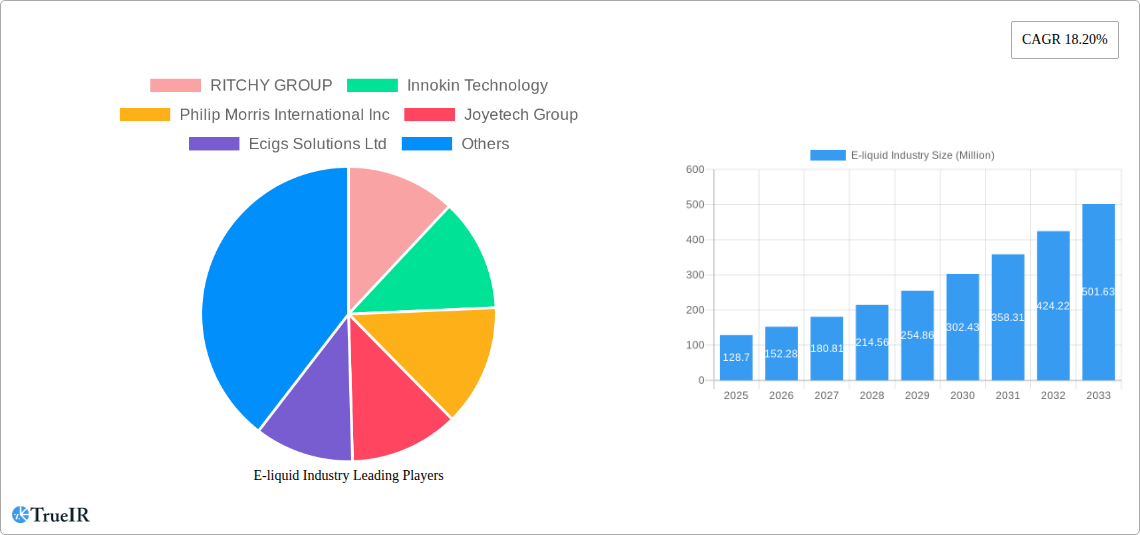
E-liquid Industry Market Size (In Million)
The forecast period (2025-2033) anticipates continued expansion, but the growth trajectory will likely be influenced by evolving regulatory environments and public health initiatives. The market's success hinges on addressing concerns regarding long-term health effects while capitalizing on the growing demand for alternative nicotine delivery systems. Technological advancements leading to safer and more innovative e-liquid products, coupled with targeted marketing strategies emphasizing responsible vaping, will be crucial in shaping the future of the e-liquid market. Competition among established players and emerging brands will intensify, demanding ongoing product diversification and strategic partnerships to secure market share.
E-liquid Industry Company Market Share
This comprehensive report provides a detailed analysis of the global e-liquid industry, covering market size, trends, competitive landscape, and future outlook from 2019 to 2033. Leveraging extensive data and insights, this report is an invaluable resource for industry stakeholders, investors, and researchers seeking to understand this dynamic market. The report projects a market valued at over $XX Million by 2033, offering a detailed breakdown by product type, distribution channel, and geographic region.
E-liquid Industry Market Structure & Competitive Landscape
The global e-liquid market presents a dynamic and evolving landscape, characterized by a moderately concentrated structure where established key players command significant market share. However, this concentration is increasingly challenged by a surge of new entrants, particularly those leveraging the expansive reach of online retail channels. Innovation stands as a pivotal force, continuously driving advancements in vaping device technology, the creation of diverse and sophisticated flavor profiles, and the development of more efficient nicotine delivery systems. Regulatory frameworks exhibit considerable regional variability, directly influencing market access, growth trajectories, and the overall operational environment for businesses. Competition is further shaped by the presence of product substitutes, including traditional combustible cigarettes and various nicotine replacement therapies, which exert persistent pressure on market share. End-user segmentation is largely dictated by demographic factors, established smoking habits, and individual preferences for distinct device types and a wide spectrum of e-liquid flavors. While mergers and acquisitions (M&A) activity has historically been moderate, the industry anticipates a discernible increase in strategic acquisitions in the coming years, driven by a convergence of consolidation strategies and ambitions for market expansion.
- Market Concentration: In 2025, the top 5 players are estimated to hold approximately XX% of the global e-liquid market revenue. This level of concentration is projected to deepen further throughout the forecast period as consolidation efforts intensify.
- Innovation Drivers: The relentless pursuit of innovation is fueled by advancements in battery efficiency, sophisticated coil designs for optimal vapor production, and pioneering flavor creation techniques that cater to evolving consumer tastes.
- Regulatory Impacts: The fragmented nature of regulatory landscapes across different countries introduces both significant challenges and unique opportunities. This variability can lead to market segmentation, uneven growth patterns, and necessitates adaptive business strategies.
- Product Substitutes: Traditional cigarettes remain a primary substitute, alongside nicotine replacement therapy (NRT) products, which continue to pose a competitive threat by offering alternative cessation or harm reduction pathways.
- End-User Segmentation: Key segmentation criteria include age demographics, disposable income levels, and individual smoking histories, all of which influence purchasing decisions and product preferences.
- M&A Trends: The e-liquid industry witnessed an average of XX M&A deals annually between 2019 and 2024. Projections indicate a notable increase, with an estimated XX deals per year anticipated between 2025 and 2033, signaling a period of heightened industry consolidation.
E-liquid Industry Market Trends & Opportunities
The global e-liquid market is experiencing robust growth, driven by several factors including the increasing popularity of vaping as a smoking cessation tool and the diversification of product offerings. The market is witnessing a shift towards more sophisticated devices with advanced features, reflecting changing consumer preferences. Technological advancements, such as improved battery technology and innovative flavor profiles, are shaping the market landscape. The competitive dynamics are characterized by intense rivalry among established players and emerging brands, leading to aggressive pricing strategies and product innovation. The market size is projected to grow at a Compound Annual Growth Rate (CAGR) of XX% during the forecast period (2025-2033), reaching an estimated market value of $XX Million by 2033. Market penetration rates, while varying geographically, show significant potential for growth in developing economies. The increasing demand for customized and premium e-liquids also presents a significant opportunity for niche players. The overall trend indicates continuous market expansion, with ongoing diversification in product types, flavors, and distribution channels.
Dominant Markets & Segments in E-liquid Industry
The e-liquid market exhibits varied growth across different regions and segments. The North American market is currently dominant, but Asia Pacific is projected to show the highest growth rate in the forecast period.
By Product Type:
- E-cigarette Devices: This segment is expected to maintain its dominance due to the increasing popularity of vaping.
- E-liquid Devices: Growth in this segment is driven by the introduction of novel devices offering diverse functionalities and flavor options.
By Distribution Channel:
- Online Channel: The online channel is experiencing rapid growth due to the convenience and accessibility it provides to consumers.
- Offline Channel: While facing competition from the online channel, the offline channel continues to be significant, particularly in areas with limited online penetration.
Key Growth Drivers:
- Developed Infrastructure: Robust infrastructure for distribution and supply chain supports market expansion.
- Favorable Government Policies: Countries with less restrictive regulations are experiencing faster growth.
E-liquid Industry Product Analysis
The e-liquid industry is characterized by continuous product innovation, with a focus on enhancing user experience and safety. Advancements in flavor technology, nicotine delivery systems, and device design are crucial in maintaining market competitiveness. Technological advancements like temperature control, variable wattage, and improved coil designs are attracting discerning consumers. The market fit is determined by factors such as price, safety, convenience, and user satisfaction. The successful products generally offer a combination of appealing flavor profiles, user-friendly designs, and reliable performance.
Key Drivers, Barriers & Challenges in E-liquid Industry
Key Drivers:
The e-liquid industry is propelled by several key drivers. Chief among these are the continuous technological advancements in both vaping devices and e-liquid formulations, which significantly enhance the user experience and attract a broader consumer base, including those transitioning from traditional smoking. Economic factors, such as rising disposable income levels in key markets, play a crucial role in stimulating consumer spending on premium and novel e-liquid products. Furthermore, the implementation of favorable government policies and the evolving perception of vaping as a less harmful alternative in certain regions are actively fostering conducive environments for market expansion and growth.
Challenges and Restraints:
Despite the growth drivers, the industry faces considerable challenges and restraints. Stringent and often evolving regulations, coupled with outright bans in numerous countries, present significant hurdles to market access and product distribution. Disruptions within the global supply chain, encompassing issues with the sourcing of raw materials and logistical complexities, can impact product availability and lead to price volatility. The intensely competitive nature of the market, marked by the presence of both well-established corporations and agile new entrants, exerts considerable pressure on profit margins. Negative public perception, often fueled by ongoing health debates and concerns regarding youth uptake, continues to dampen consumer demand in many regions. Moreover, the proliferation of counterfeit e-liquids poses a serious threat to brand integrity, consumer safety, and overall market stability.
Growth Drivers in the E-liquid Industry Market
The e-liquid industry's growth is primarily fueled by technological innovation, specifically advancements in device technology, flavor creation, and nicotine delivery systems. Economic factors, such as rising disposable incomes in developing countries, further contribute to market expansion. Moreover, in regions with less restrictive regulations, a favorable policy environment fuels market growth.
Challenges Impacting E-liquid Industry Growth
The growth trajectory of the e-liquid industry is significantly impacted by a confluence of formidable challenges. Foremost among these are regulatory hurdles, which manifest as outright bans in various jurisdictions and the imposition of increasingly stringent regulations governing product safety, marketing, and sale, thereby creating a complex and fragmented operating environment. Supply chain vulnerabilities, stemming from difficulties in consistently sourcing high-quality raw materials and navigating intricate distribution networks, can lead to operational disruptions and affect product availability. The intense competition from both established industry giants and a rapidly emerging cohort of innovative players results in aggressive price wars and can erode profitability. Compounding these issues is the growing negative public perception surrounding vaping and persistent health concerns, which collectively dampen consumer demand and necessitate robust public health communication strategies.
Key Players Shaping the E-liquid Industry Market
- RITCHY GROUP
- Innokin Technology (Innokin Technology)
- Philip Morris International Inc (Philip Morris International Inc)
- Joyetech Group
- Ecigs Solutions Ltd
- Intellicig Inc
- Aspire
- KangerTech
- British American Tobacco (British American Tobacco)
- VIP Electronic Cigarettes
Significant E-liquid Industry Milestones
- September 2019: The Emirates Government introduced new regulations for electronic cigarettes in Dubai, legalizing sales under specific conditions.
- November 2019: Dubai's Department of Economic Development introduced 'Electronic cigarettes & accessories trading' as a legal activity.
- April 2022: Egyptian authorities legalized the import and commercialization of e-cigarette products, opening up a new market for RELX International and other companies.
Future Outlook for E-liquid Industry Market
The e-liquid market is poised for continued growth, driven by innovation, evolving consumer preferences, and expansion into new markets. Strategic opportunities exist in developing innovative products, expanding into untapped regions, and engaging in strategic partnerships. The market's future potential is substantial, particularly in regions with growing acceptance of vaping and less stringent regulations. The focus will remain on product safety, responsible marketing, and addressing public health concerns to maintain sustainable market growth.
E-liquid Industry Segmentation
-
1. Product Type
- 1.1. E-cigarette Devices
- 1.2. E-liquid Devices
-
2. Distribution Channel
- 2.1. Offline Channel
- 2.2. Online Channel
-
3. Geography
- 3.1. South Africa
- 3.2. Nigeria
- 3.3. Kenya
- 3.4. Ghana
- 3.5. United Arab Emirates
- 3.6. Egypt
- 3.7. Rest of Middle East & Africa
E-liquid Industry Segmentation By Geography
- 1. South Africa
- 2. Nigeria
- 3. Kenya
- 4. Ghana
- 5. United Arab Emirates
- 6. Egypt
- 7. Rest of Middle East
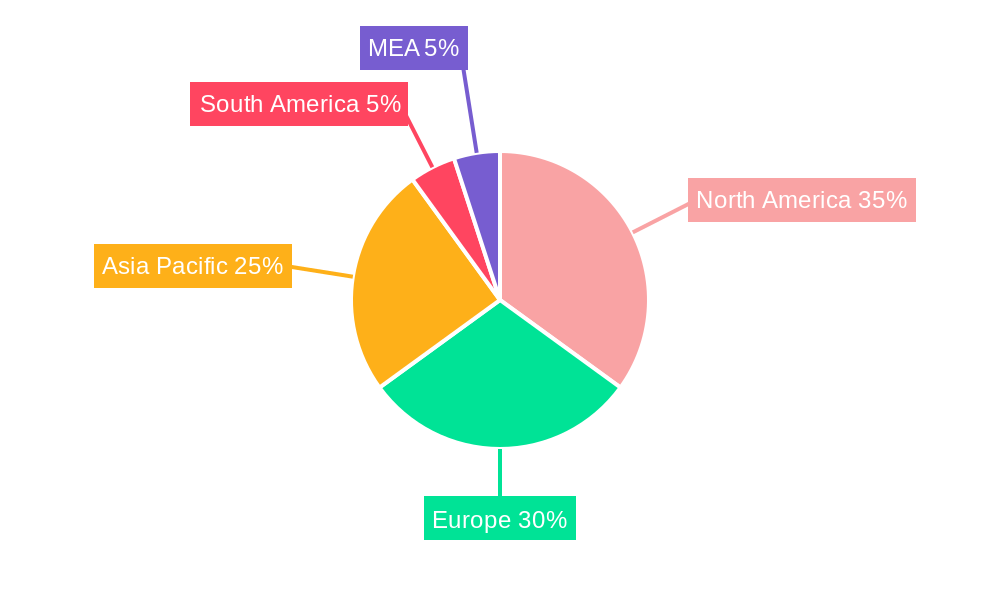
E-liquid Industry Regional Market Share
Geographic Coverage of E-liquid Industry
E-liquid Industry REPORT HIGHLIGHTS
| Aspects | Details |
|---|---|
| Study Period | 2020-2034 |
| Base Year | 2025 |
| Estimated Year | 2026 |
| Forecast Period | 2026-2034 |
| Historical Period | 2020-2025 |
| Growth Rate | CAGR of 18.20% from 2020-2034 |
| Segmentation |
|
Table of Contents
- 1. Introduction
- 1.1. Research Scope
- 1.2. Market Segmentation
- 1.3. Research Objective
- 1.4. Definitions and Assumptions
- 2. Executive Summary
- 2.1. Market Snapshot
- 3. Market Dynamics
- 3.1. Market Drivers
- 3.2. Market Restrains
- 3.3. Market Trends
- 3.4. Market Opportunities
- 4. Market Factor Analysis
- 4.1. Porters Five Forces
- 4.1.1. Bargaining Power of Suppliers
- 4.1.2. Bargaining Power of Buyers
- 4.1.3. Threat of New Entrants
- 4.1.4. Threat of Substitutes
- 4.1.5. Competitive Rivalry
- 4.2. PESTEL analysis
- 4.3. BCG Analysis
- 4.3.1. Stars (High Growth, High Market Share)
- 4.3.2. Cash Cows (Low Growth, High Market Share)
- 4.3.3. Question Mark (High Growth, Low Market Share)
- 4.3.4. Dogs (Low Growth, Low Market Share)
- 4.4. Ansoff Matrix Analysis
- 4.5. Supply Chain Analysis
- 4.6. Regulatory Landscape
- 4.7. Current Market Potential and Opportunity Assessment (TAM–SAM–SOM Framework)
- 4.8. TIR Analyst Note
- 4.1. Porters Five Forces
- 5. Market Analysis, Insights and Forecast 2021-2033
- 5.1. Market Analysis, Insights and Forecast - by Product Type
- 5.1.1. E-cigarette Devices
- 5.1.2. E-liquid Devices
- 5.2. Market Analysis, Insights and Forecast - by Distribution Channel
- 5.2.1. Offline Channel
- 5.2.2. Online Channel
- 5.3. Market Analysis, Insights and Forecast - by Geography
- 5.3.1. South Africa
- 5.3.2. Nigeria
- 5.3.3. Kenya
- 5.3.4. Ghana
- 5.3.5. United Arab Emirates
- 5.3.6. Egypt
- 5.3.7. Rest of Middle East & Africa
- 5.4. Market Analysis, Insights and Forecast - by Region
- 5.4.1. South Africa
- 5.4.2. Nigeria
- 5.4.3. Kenya
- 5.4.4. Ghana
- 5.4.5. United Arab Emirates
- 5.4.6. Egypt
- 5.4.7. Rest of Middle East
- 5.1. Market Analysis, Insights and Forecast - by Product Type
- 6. Global E-liquid Industry Analysis, Insights and Forecast, 2021-2033
- 6.1. Market Analysis, Insights and Forecast - by Product Type
- 6.1.1. E-cigarette Devices
- 6.1.2. E-liquid Devices
- 6.2. Market Analysis, Insights and Forecast - by Distribution Channel
- 6.2.1. Offline Channel
- 6.2.2. Online Channel
- 6.3. Market Analysis, Insights and Forecast - by Geography
- 6.3.1. South Africa
- 6.3.2. Nigeria
- 6.3.3. Kenya
- 6.3.4. Ghana
- 6.3.5. United Arab Emirates
- 6.3.6. Egypt
- 6.3.7. Rest of Middle East & Africa
- 6.1. Market Analysis, Insights and Forecast - by Product Type
- 7. South Africa E-liquid Industry Analysis, Insights and Forecast, 2020-2032
- 7.1. Market Analysis, Insights and Forecast - by Product Type
- 7.1.1. E-cigarette Devices
- 7.1.2. E-liquid Devices
- 7.2. Market Analysis, Insights and Forecast - by Distribution Channel
- 7.2.1. Offline Channel
- 7.2.2. Online Channel
- 7.3. Market Analysis, Insights and Forecast - by Geography
- 7.3.1. South Africa
- 7.3.2. Nigeria
- 7.3.3. Kenya
- 7.3.4. Ghana
- 7.3.5. United Arab Emirates
- 7.3.6. Egypt
- 7.3.7. Rest of Middle East & Africa
- 7.1. Market Analysis, Insights and Forecast - by Product Type
- 8. Nigeria E-liquid Industry Analysis, Insights and Forecast, 2020-2032
- 8.1. Market Analysis, Insights and Forecast - by Product Type
- 8.1.1. E-cigarette Devices
- 8.1.2. E-liquid Devices
- 8.2. Market Analysis, Insights and Forecast - by Distribution Channel
- 8.2.1. Offline Channel
- 8.2.2. Online Channel
- 8.3. Market Analysis, Insights and Forecast - by Geography
- 8.3.1. South Africa
- 8.3.2. Nigeria
- 8.3.3. Kenya
- 8.3.4. Ghana
- 8.3.5. United Arab Emirates
- 8.3.6. Egypt
- 8.3.7. Rest of Middle East & Africa
- 8.1. Market Analysis, Insights and Forecast - by Product Type
- 9. Kenya E-liquid Industry Analysis, Insights and Forecast, 2020-2032
- 9.1. Market Analysis, Insights and Forecast - by Product Type
- 9.1.1. E-cigarette Devices
- 9.1.2. E-liquid Devices
- 9.2. Market Analysis, Insights and Forecast - by Distribution Channel
- 9.2.1. Offline Channel
- 9.2.2. Online Channel
- 9.3. Market Analysis, Insights and Forecast - by Geography
- 9.3.1. South Africa
- 9.3.2. Nigeria
- 9.3.3. Kenya
- 9.3.4. Ghana
- 9.3.5. United Arab Emirates
- 9.3.6. Egypt
- 9.3.7. Rest of Middle East & Africa
- 9.1. Market Analysis, Insights and Forecast - by Product Type
- 10. Ghana E-liquid Industry Analysis, Insights and Forecast, 2020-2032
- 10.1. Market Analysis, Insights and Forecast - by Product Type
- 10.1.1. E-cigarette Devices
- 10.1.2. E-liquid Devices
- 10.2. Market Analysis, Insights and Forecast - by Distribution Channel
- 10.2.1. Offline Channel
- 10.2.2. Online Channel
- 10.3. Market Analysis, Insights and Forecast - by Geography
- 10.3.1. South Africa
- 10.3.2. Nigeria
- 10.3.3. Kenya
- 10.3.4. Ghana
- 10.3.5. United Arab Emirates
- 10.3.6. Egypt
- 10.3.7. Rest of Middle East & Africa
- 10.1. Market Analysis, Insights and Forecast - by Product Type
- 11. United Arab Emirates E-liquid Industry Analysis, Insights and Forecast, 2020-2032
- 11.1. Market Analysis, Insights and Forecast - by Product Type
- 11.1.1. E-cigarette Devices
- 11.1.2. E-liquid Devices
- 11.2. Market Analysis, Insights and Forecast - by Distribution Channel
- 11.2.1. Offline Channel
- 11.2.2. Online Channel
- 11.3. Market Analysis, Insights and Forecast - by Geography
- 11.3.1. South Africa
- 11.3.2. Nigeria
- 11.3.3. Kenya
- 11.3.4. Ghana
- 11.3.5. United Arab Emirates
- 11.3.6. Egypt
- 11.3.7. Rest of Middle East & Africa
- 11.1. Market Analysis, Insights and Forecast - by Product Type
- 12. Egypt E-liquid Industry Analysis, Insights and Forecast, 2020-2032
- 12.1. Market Analysis, Insights and Forecast - by Product Type
- 12.1.1. E-cigarette Devices
- 12.1.2. E-liquid Devices
- 12.2. Market Analysis, Insights and Forecast - by Distribution Channel
- 12.2.1. Offline Channel
- 12.2.2. Online Channel
- 12.3. Market Analysis, Insights and Forecast - by Geography
- 12.3.1. South Africa
- 12.3.2. Nigeria
- 12.3.3. Kenya
- 12.3.4. Ghana
- 12.3.5. United Arab Emirates
- 12.3.6. Egypt
- 12.3.7. Rest of Middle East & Africa
- 12.1. Market Analysis, Insights and Forecast - by Product Type
- 13. Rest of Middle East E-liquid Industry Analysis, Insights and Forecast, 2020-2032
- 13.1. Market Analysis, Insights and Forecast - by Product Type
- 13.1.1. E-cigarette Devices
- 13.1.2. E-liquid Devices
- 13.2. Market Analysis, Insights and Forecast - by Distribution Channel
- 13.2.1. Offline Channel
- 13.2.2. Online Channel
- 13.3. Market Analysis, Insights and Forecast - by Geography
- 13.3.1. South Africa
- 13.3.2. Nigeria
- 13.3.3. Kenya
- 13.3.4. Ghana
- 13.3.5. United Arab Emirates
- 13.3.6. Egypt
- 13.3.7. Rest of Middle East & Africa
- 13.1. Market Analysis, Insights and Forecast - by Product Type
- 14. Competitive Analysis
- 14.1. Company Profiles
- 14.1.1 RITCHY GROUP
- 14.1.1.1. Company Overview
- 14.1.1.2. Products
- 14.1.1.3. Company Financials
- 14.1.1.4. SWOT Analysis
- 14.1.2 Innokin Technology
- 14.1.2.1. Company Overview
- 14.1.2.2. Products
- 14.1.2.3. Company Financials
- 14.1.2.4. SWOT Analysis
- 14.1.3 Philip Morris International Inc
- 14.1.3.1. Company Overview
- 14.1.3.2. Products
- 14.1.3.3. Company Financials
- 14.1.3.4. SWOT Analysis
- 14.1.4 Joyetech Group
- 14.1.4.1. Company Overview
- 14.1.4.2. Products
- 14.1.4.3. Company Financials
- 14.1.4.4. SWOT Analysis
- 14.1.5 Ecigs Solutions Ltd
- 14.1.5.1. Company Overview
- 14.1.5.2. Products
- 14.1.5.3. Company Financials
- 14.1.5.4. SWOT Analysis
- 14.1.6 Intellicig Inc
- 14.1.6.1. Company Overview
- 14.1.6.2. Products
- 14.1.6.3. Company Financials
- 14.1.6.4. SWOT Analysis
- 14.1.7 Aspire
- 14.1.7.1. Company Overview
- 14.1.7.2. Products
- 14.1.7.3. Company Financials
- 14.1.7.4. SWOT Analysis
- 14.1.8 KangerTech
- 14.1.8.1. Company Overview
- 14.1.8.2. Products
- 14.1.8.3. Company Financials
- 14.1.8.4. SWOT Analysis
- 14.1.9 British American Tobacco
- 14.1.9.1. Company Overview
- 14.1.9.2. Products
- 14.1.9.3. Company Financials
- 14.1.9.4. SWOT Analysis
- 14.1.10 VIP Electronic Cigarettes
- 14.1.10.1. Company Overview
- 14.1.10.2. Products
- 14.1.10.3. Company Financials
- 14.1.10.4. SWOT Analysis
- 14.1.1 RITCHY GROUP
- 14.2. Market Entropy
- 14.2.1 Company's Key Areas Served
- 14.2.2 Recent Developments
- 14.3. Company Market Share Analysis 2025
- 14.3.1 Top 5 Companies Market Share Analysis
- 14.3.2 Top 3 Companies Market Share Analysis
- 14.4. List of Potential Customers
- 15. Research Methodology
List of Figures
- Figure 1: Global E-liquid Industry Revenue Breakdown (Million, %) by Region 2025 & 2033
- Figure 2: South Africa E-liquid Industry Revenue (Million), by Product Type 2025 & 2033
- Figure 3: South Africa E-liquid Industry Revenue Share (%), by Product Type 2025 & 2033
- Figure 4: South Africa E-liquid Industry Revenue (Million), by Distribution Channel 2025 & 2033
- Figure 5: South Africa E-liquid Industry Revenue Share (%), by Distribution Channel 2025 & 2033
- Figure 6: South Africa E-liquid Industry Revenue (Million), by Geography 2025 & 2033
- Figure 7: South Africa E-liquid Industry Revenue Share (%), by Geography 2025 & 2033
- Figure 8: South Africa E-liquid Industry Revenue (Million), by Country 2025 & 2033
- Figure 9: South Africa E-liquid Industry Revenue Share (%), by Country 2025 & 2033
- Figure 10: Nigeria E-liquid Industry Revenue (Million), by Product Type 2025 & 2033
- Figure 11: Nigeria E-liquid Industry Revenue Share (%), by Product Type 2025 & 2033
- Figure 12: Nigeria E-liquid Industry Revenue (Million), by Distribution Channel 2025 & 2033
- Figure 13: Nigeria E-liquid Industry Revenue Share (%), by Distribution Channel 2025 & 2033
- Figure 14: Nigeria E-liquid Industry Revenue (Million), by Geography 2025 & 2033
- Figure 15: Nigeria E-liquid Industry Revenue Share (%), by Geography 2025 & 2033
- Figure 16: Nigeria E-liquid Industry Revenue (Million), by Country 2025 & 2033
- Figure 17: Nigeria E-liquid Industry Revenue Share (%), by Country 2025 & 2033
- Figure 18: Kenya E-liquid Industry Revenue (Million), by Product Type 2025 & 2033
- Figure 19: Kenya E-liquid Industry Revenue Share (%), by Product Type 2025 & 2033
- Figure 20: Kenya E-liquid Industry Revenue (Million), by Distribution Channel 2025 & 2033
- Figure 21: Kenya E-liquid Industry Revenue Share (%), by Distribution Channel 2025 & 2033
- Figure 22: Kenya E-liquid Industry Revenue (Million), by Geography 2025 & 2033
- Figure 23: Kenya E-liquid Industry Revenue Share (%), by Geography 2025 & 2033
- Figure 24: Kenya E-liquid Industry Revenue (Million), by Country 2025 & 2033
- Figure 25: Kenya E-liquid Industry Revenue Share (%), by Country 2025 & 2033
- Figure 26: Ghana E-liquid Industry Revenue (Million), by Product Type 2025 & 2033
- Figure 27: Ghana E-liquid Industry Revenue Share (%), by Product Type 2025 & 2033
- Figure 28: Ghana E-liquid Industry Revenue (Million), by Distribution Channel 2025 & 2033
- Figure 29: Ghana E-liquid Industry Revenue Share (%), by Distribution Channel 2025 & 2033
- Figure 30: Ghana E-liquid Industry Revenue (Million), by Geography 2025 & 2033
- Figure 31: Ghana E-liquid Industry Revenue Share (%), by Geography 2025 & 2033
- Figure 32: Ghana E-liquid Industry Revenue (Million), by Country 2025 & 2033
- Figure 33: Ghana E-liquid Industry Revenue Share (%), by Country 2025 & 2033
- Figure 34: United Arab Emirates E-liquid Industry Revenue (Million), by Product Type 2025 & 2033
- Figure 35: United Arab Emirates E-liquid Industry Revenue Share (%), by Product Type 2025 & 2033
- Figure 36: United Arab Emirates E-liquid Industry Revenue (Million), by Distribution Channel 2025 & 2033
- Figure 37: United Arab Emirates E-liquid Industry Revenue Share (%), by Distribution Channel 2025 & 2033
- Figure 38: United Arab Emirates E-liquid Industry Revenue (Million), by Geography 2025 & 2033
- Figure 39: United Arab Emirates E-liquid Industry Revenue Share (%), by Geography 2025 & 2033
- Figure 40: United Arab Emirates E-liquid Industry Revenue (Million), by Country 2025 & 2033
- Figure 41: United Arab Emirates E-liquid Industry Revenue Share (%), by Country 2025 & 2033
- Figure 42: Egypt E-liquid Industry Revenue (Million), by Product Type 2025 & 2033
- Figure 43: Egypt E-liquid Industry Revenue Share (%), by Product Type 2025 & 2033
- Figure 44: Egypt E-liquid Industry Revenue (Million), by Distribution Channel 2025 & 2033
- Figure 45: Egypt E-liquid Industry Revenue Share (%), by Distribution Channel 2025 & 2033
- Figure 46: Egypt E-liquid Industry Revenue (Million), by Geography 2025 & 2033
- Figure 47: Egypt E-liquid Industry Revenue Share (%), by Geography 2025 & 2033
- Figure 48: Egypt E-liquid Industry Revenue (Million), by Country 2025 & 2033
- Figure 49: Egypt E-liquid Industry Revenue Share (%), by Country 2025 & 2033
- Figure 50: Rest of Middle East E-liquid Industry Revenue (Million), by Product Type 2025 & 2033
- Figure 51: Rest of Middle East E-liquid Industry Revenue Share (%), by Product Type 2025 & 2033
- Figure 52: Rest of Middle East E-liquid Industry Revenue (Million), by Distribution Channel 2025 & 2033
- Figure 53: Rest of Middle East E-liquid Industry Revenue Share (%), by Distribution Channel 2025 & 2033
- Figure 54: Rest of Middle East E-liquid Industry Revenue (Million), by Geography 2025 & 2033
- Figure 55: Rest of Middle East E-liquid Industry Revenue Share (%), by Geography 2025 & 2033
- Figure 56: Rest of Middle East E-liquid Industry Revenue (Million), by Country 2025 & 2033
- Figure 57: Rest of Middle East E-liquid Industry Revenue Share (%), by Country 2025 & 2033
List of Tables
- Table 1: Global E-liquid Industry Revenue Million Forecast, by Product Type 2020 & 2033
- Table 2: Global E-liquid Industry Revenue Million Forecast, by Distribution Channel 2020 & 2033
- Table 3: Global E-liquid Industry Revenue Million Forecast, by Geography 2020 & 2033
- Table 4: Global E-liquid Industry Revenue Million Forecast, by Region 2020 & 2033
- Table 5: Global E-liquid Industry Revenue Million Forecast, by Product Type 2020 & 2033
- Table 6: Global E-liquid Industry Revenue Million Forecast, by Distribution Channel 2020 & 2033
- Table 7: Global E-liquid Industry Revenue Million Forecast, by Geography 2020 & 2033
- Table 8: Global E-liquid Industry Revenue Million Forecast, by Country 2020 & 2033
- Table 9: Global E-liquid Industry Revenue Million Forecast, by Product Type 2020 & 2033
- Table 10: Global E-liquid Industry Revenue Million Forecast, by Distribution Channel 2020 & 2033
- Table 11: Global E-liquid Industry Revenue Million Forecast, by Geography 2020 & 2033
- Table 12: Global E-liquid Industry Revenue Million Forecast, by Country 2020 & 2033
- Table 13: Global E-liquid Industry Revenue Million Forecast, by Product Type 2020 & 2033
- Table 14: Global E-liquid Industry Revenue Million Forecast, by Distribution Channel 2020 & 2033
- Table 15: Global E-liquid Industry Revenue Million Forecast, by Geography 2020 & 2033
- Table 16: Global E-liquid Industry Revenue Million Forecast, by Country 2020 & 2033
- Table 17: Global E-liquid Industry Revenue Million Forecast, by Product Type 2020 & 2033
- Table 18: Global E-liquid Industry Revenue Million Forecast, by Distribution Channel 2020 & 2033
- Table 19: Global E-liquid Industry Revenue Million Forecast, by Geography 2020 & 2033
- Table 20: Global E-liquid Industry Revenue Million Forecast, by Country 2020 & 2033
- Table 21: Global E-liquid Industry Revenue Million Forecast, by Product Type 2020 & 2033
- Table 22: Global E-liquid Industry Revenue Million Forecast, by Distribution Channel 2020 & 2033
- Table 23: Global E-liquid Industry Revenue Million Forecast, by Geography 2020 & 2033
- Table 24: Global E-liquid Industry Revenue Million Forecast, by Country 2020 & 2033
- Table 25: Global E-liquid Industry Revenue Million Forecast, by Product Type 2020 & 2033
- Table 26: Global E-liquid Industry Revenue Million Forecast, by Distribution Channel 2020 & 2033
- Table 27: Global E-liquid Industry Revenue Million Forecast, by Geography 2020 & 2033
- Table 28: Global E-liquid Industry Revenue Million Forecast, by Country 2020 & 2033
- Table 29: Global E-liquid Industry Revenue Million Forecast, by Product Type 2020 & 2033
- Table 30: Global E-liquid Industry Revenue Million Forecast, by Distribution Channel 2020 & 2033
- Table 31: Global E-liquid Industry Revenue Million Forecast, by Geography 2020 & 2033
- Table 32: Global E-liquid Industry Revenue Million Forecast, by Country 2020 & 2033
Frequently Asked Questions
1. What is the projected Compound Annual Growth Rate (CAGR) of the E-liquid Industry?
The projected CAGR is approximately 18.20%.
2. Which companies are prominent players in the E-liquid Industry?
Key companies in the market include RITCHY GROUP, Innokin Technology, Philip Morris International Inc, Joyetech Group, Ecigs Solutions Ltd, Intellicig Inc, Aspire, KangerTech, British American Tobacco, VIP Electronic Cigarettes.
3. What are the main segments of the E-liquid Industry?
The market segments include Product Type, Distribution Channel, Geography.
4. Can you provide details about the market size?
The market size is estimated to be USD 128.70 Million as of 2022.
5. What are some drivers contributing to market growth?
Aggressive Social Media Marketing; Lower-risk Factor Associated with the Use of E-Cigarettes Compared to Conventional/Combustible Cigarettes.
6. What are the notable trends driving market growth?
Penetration of E-cigarettes in Organized Retail.
7. Are there any restraints impacting market growth?
Government Initiatives to Ban Disposable E-Cigarettes.
8. Can you provide examples of recent developments in the market?
In April 2022, RELX International, a multinational electronic cigarettes company, lauds the recent decision by Egyptian authorities to allow the legal import and commercialization of e-cigarette products in the country. The lifting of the ban highlights the Egyptian authorities' progressive approach to e-cigarettes. It sets the stage for creating a regulated market rich with business opportunities by serving the demand for easily accessible, quality products by legal age (adult) consumers across the country.
9. What pricing options are available for accessing the report?
Pricing options include single-user, multi-user, and enterprise licenses priced at USD 4750, USD 5250, and USD 8750 respectively.
10. Is the market size provided in terms of value or volume?
The market size is provided in terms of value, measured in Million.
11. Are there any specific market keywords associated with the report?
Yes, the market keyword associated with the report is "E-liquid Industry," which aids in identifying and referencing the specific market segment covered.
12. How do I determine which pricing option suits my needs best?
The pricing options vary based on user requirements and access needs. Individual users may opt for single-user licenses, while businesses requiring broader access may choose multi-user or enterprise licenses for cost-effective access to the report.
13. Are there any additional resources or data provided in the E-liquid Industry report?
While the report offers comprehensive insights, it's advisable to review the specific contents or supplementary materials provided to ascertain if additional resources or data are available.
14. How can I stay updated on further developments or reports in the E-liquid Industry?
To stay informed about further developments, trends, and reports in the E-liquid Industry, consider subscribing to industry newsletters, following relevant companies and organizations, or regularly checking reputable industry news sources and publications.
Methodology
Step 1 - Identification of Relevant Samples Size from Population Database


Step 2 - Approaches for Defining Global Market Size (Value, Volume* & Price*)

Note*: In applicable scenarios
Step 3 - Data Sources
Primary Research
- Web Analytics
- Survey Reports
- Research Institute
- Latest Research Reports
- Opinion Leaders
Secondary Research
- Annual Reports
- White Paper
- Latest Press Release
- Industry Association
- Paid Database
- Investor Presentations

Step 4 - Data Triangulation
Involves using different sources of information in order to increase the validity of a study
These sources are likely to be stakeholders in a program - participants, other researchers, program staff, other community members, and so on.
Then we put all data in single framework & apply various statistical tools to find out the dynamic on the market.
During the analysis stage, feedback from the stakeholder groups would be compared to determine areas of agreement as well as areas of divergence