

Key Insights
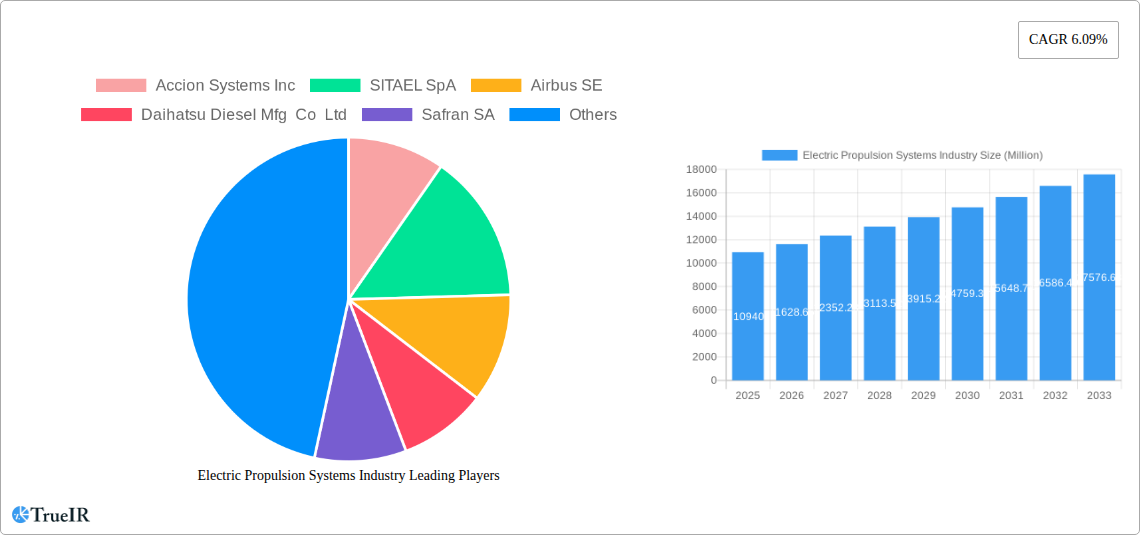
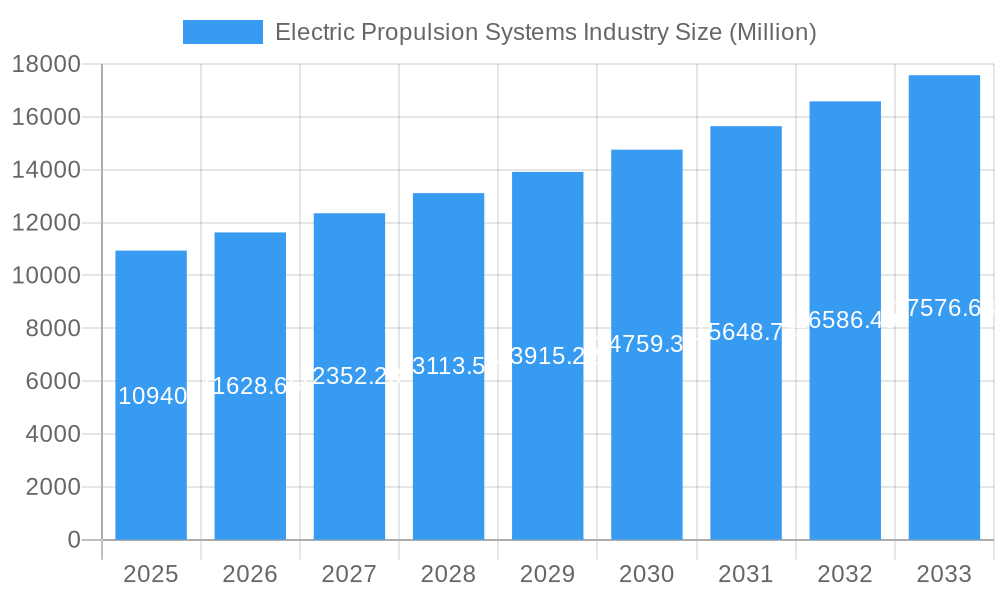
The Electric Propulsion Systems (EPS) market is experiencing robust growth, projected to reach \$10.94 billion in 2025 and expand at a Compound Annual Growth Rate (CAGR) of 6.09% from 2025 to 2033. This expansion is fueled by several key drivers. The increasing demand for fuel-efficient and environmentally friendly transportation solutions across various sectors – aerospace, marine, and terrestrial – is a major catalyst. Government regulations aimed at reducing carbon emissions are further incentivizing the adoption of EPS. Technological advancements, including improvements in battery technology, power electronics, and motor design, are also contributing to enhanced performance and cost-effectiveness, making EPS more attractive. The market is segmented by type (hybrid and full-electric) and application (airborne, terrestrial, marine, and space). The full-electric segment is expected to witness faster growth due to its superior environmental benefits and potential for increased efficiency in specific applications like electric aircraft. The airborne segment currently holds a significant market share, driven by the ongoing development of electric vertical takeoff and landing (eVTOL) aircraft and the electrification of smaller aircraft. However, the terrestrial and marine segments are poised for considerable growth, driven by the increasing adoption of electric vehicles and electric ships, respectively. Competition among major players like Airbus SE, Safran SA, and others is intense, fostering innovation and driving down costs.
Electric Propulsion Systems Industry Market Size (In Billion)
The geographical distribution of the market reveals a diverse landscape. North America, particularly the United States, is a significant market due to its advanced aerospace industry and substantial investments in electric vehicle technology. Europe also holds a substantial share, driven by strong government support for green initiatives and a focus on sustainable transportation. The Asia-Pacific region, with its large and rapidly developing economies, is projected to demonstrate significant growth potential in the coming years, driven by the increasing demand for electric vehicles and electric propulsion systems in various applications. While challenges remain, such as the high initial cost of EPS and the need for improved infrastructure for charging and maintenance, the long-term prospects for this market remain exceptionally positive. The ongoing research and development efforts focused on improving battery life, reducing weight, and increasing power density are expected to further accelerate market growth in the coming years.
Electric Propulsion Systems Industry Company Market Share
Electric Propulsion Systems Industry: A Comprehensive Market Report (2019-2033)
This dynamic report provides a detailed analysis of the Electric Propulsion Systems industry, offering invaluable insights for stakeholders seeking to navigate this rapidly evolving market. The study period covers 2019-2033, with a base year of 2025 and a forecast period spanning 2025-2033. We project a xx Million market value in 2025, exhibiting a robust CAGR of xx% during the forecast period. This report leverages extensive primary and secondary research, incorporating quantitative data and qualitative analysis to deliver actionable intelligence.
Electric Propulsion Systems Industry Market Structure & Competitive Landscape
The Electric Propulsion Systems market exhibits a moderately concentrated structure, with a few major players holding significant market share. The Herfindahl-Hirschman Index (HHI) is estimated at xx in 2025, indicating a moderately competitive landscape. Key innovation drivers include advancements in battery technology, power electronics, and motor design. Stringent environmental regulations, particularly concerning emissions, are significantly shaping market dynamics. Product substitutes, such as traditional combustion engines, are facing increasing pressure due to cost and environmental concerns.
The market is segmented by end-user applications, including airborne, terrestrial, marine, and space, each with specific requirements driving innovation. Mergers and acquisitions (M&A) activity has been significant in recent years, with xx Million in deal value recorded between 2019 and 2024, reflecting consolidation and strategic expansion within the industry.
- Market Concentration: HHI estimated at xx in 2025.
- Innovation Drivers: Advancements in battery technology, power electronics, and motor design.
- Regulatory Impacts: Stringent environmental regulations are driving market growth.
- Product Substitutes: Traditional combustion engines face increasing competition.
- End-User Segmentation: Airborne, terrestrial, marine, and space applications.
- M&A Trends: xx Million in M&A deal value (2019-2024).
Electric Propulsion Systems Industry Market Trends & Opportunities
The Electric Propulsion Systems market is experiencing substantial growth, fueled by increasing demand for energy-efficient and environmentally friendly transportation and power solutions. Technological advancements are leading to improved system efficiency, reduced costs, and enhanced performance. Consumer preferences are shifting towards electric propulsion systems, driven by environmental concerns and government incentives. The competitive landscape is dynamic, with ongoing innovation and strategic partnerships shaping market share. The market size is projected to reach xx Million by 2033, driven by a substantial increase in electric vehicle adoption and the growing demand for electric propulsion systems in various applications. Market penetration rates for electric propulsion systems are expected to increase significantly across different segments during the forecast period.
Dominant Markets & Segments in Electric Propulsion Systems Industry
The airborne segment currently holds the largest market share within the Electric Propulsion Systems industry, driven by the increasing adoption of electric and hybrid-electric aircraft. The terrestrial segment is also experiencing significant growth, particularly in the electric vehicle market. Within the type segment, full-electric systems are witnessing faster growth compared to hybrid systems, owing to advancements in battery technology and charging infrastructure.
- Leading Region/Country: North America currently holds a leading position due to strong government support and a robust automotive industry.
- Dominant Segment (By Type): Full-electric systems are witnessing rapid growth due to technological advancements.
- Dominant Segment (By Application): The airborne segment is currently the largest, driven by the rise of electric and hybrid-electric aircraft.
Key Growth Drivers:
- Government Regulations and Incentives: Stringent emission regulations and subsidies are driving market growth.
- Technological Advancements: Improvements in battery technology, power electronics, and motor design are enhancing efficiency and performance.
- Rising Demand for Sustainable Transportation: Increasing environmental concerns are boosting demand for electric propulsion systems.
- Development of Charging Infrastructure: The expansion of charging infrastructure is facilitating wider adoption of electric vehicles and other applications.
Electric Propulsion Systems Industry Product Analysis
Electric propulsion systems are undergoing rapid technological advancements, leading to improved efficiency, reduced size, and increased power density. Innovations in motor design, power electronics, and battery technology are crucial drivers. The market offers a wide range of products catering to diverse applications, each optimized for specific requirements. Competitive advantages stem from factors like superior efficiency, lower cost, enhanced reliability, and advanced features.
Key Drivers, Barriers & Challenges in Electric Propulsion Systems Industry
Key Drivers:
- Technological advancements in battery technology, motor design, and power electronics.
- Stringent environmental regulations globally pushing for reduced emissions.
- Growing demand for electric vehicles and hybrid-electric aircraft.
- Increasing investments in research and development.
Challenges:
- High initial cost of electric propulsion systems compared to traditional alternatives.
- Limited charging infrastructure, especially in certain regions.
- Potential supply chain disruptions impacting availability of critical components.
- Regulatory uncertainties and varying standards across different countries.
Growth Drivers in the Electric Propulsion Systems Industry Market
The market is driven by a confluence of factors. Technological advancements leading to higher efficiency and lower costs are a primary driver. Government policies promoting clean energy and stricter emission standards are creating a favorable regulatory environment. The rising demand for electric vehicles and other sustainable transportation solutions is boosting adoption rates.
Challenges Impacting Electric Propulsion Systems Industry Growth
Significant challenges include high upfront costs and the limited availability of charging infrastructure. Supply chain vulnerabilities and inconsistent regulatory landscapes across different markets also pose hurdles. Furthermore, competition from traditional propulsion systems remains a significant factor.
Key Players Shaping the Electric Propulsion Systems Industry Market
- Accion Systems Inc
- SITAEL SpA
- Airbus SE
- Daihatsu Diesel Mfg Co Ltd
- Safran SA
- Aerojet Rocketdyne Holdings Inc
- Orbital ATK (Northrop Grumman Corporation)
- Efficient Drivetrains Inc (Cummins Inc)
- Collins Aerospace (RTX Corporation)
- Busek Co Inc
- Thales Alenia Space
- General Electric Company
- The Boeing Company
Significant Electric Propulsion Systems Industry Milestones
- 2020: Significant investment in R&D by several key players.
- 2021: Launch of several new electric propulsion systems targeting different applications.
- 2022: Successful completion of several flight tests of electric aircraft.
- 2023: Several major partnerships formed for technology development and market expansion.
- 2024: Introduction of new regulatory frameworks focused on sustainable transportation.
Future Outlook for Electric Propulsion Systems Industry Market
The future outlook for the Electric Propulsion Systems industry is extremely positive, driven by continued technological innovation, supportive government policies, and the increasing global demand for sustainable transportation. Strategic partnerships and M&A activity will play a key role in shaping the market landscape in the coming years. The market's growth potential is substantial, presenting significant opportunities for companies operating within this sector.
Electric Propulsion Systems Industry Segmentation
- 1. Production Analysis
- 2. Consumption Analysis
- 3. Import Market Analysis (Value & Volume)
- 4. Export Market Analysis (Value & Volume)
- 5. Price Trend Analysis
Electric Propulsion Systems Industry Segmentation By Geography
-
1. North America
- 1.1. United States
- 1.2. Canada
- 1.3. Mexico
-
2. South America
- 2.1. Brazil
- 2.2. Argentina
- 2.3. Rest of South America
-
3. Europe
- 3.1. United Kingdom
- 3.2. Germany
- 3.3. France
- 3.4. Italy
- 3.5. Spain
- 3.6. Russia
- 3.7. Benelux
- 3.8. Nordics
- 3.9. Rest of Europe
-
4. Middle East & Africa
- 4.1. Turkey
- 4.2. Israel
- 4.3. GCC
- 4.4. North Africa
- 4.5. South Africa
- 4.6. Rest of Middle East & Africa
-
5. Asia Pacific
- 5.1. China
- 5.2. India
- 5.3. Japan
- 5.4. South Korea
- 5.5. ASEAN
- 5.6. Oceania
- 5.7. Rest of Asia Pacific
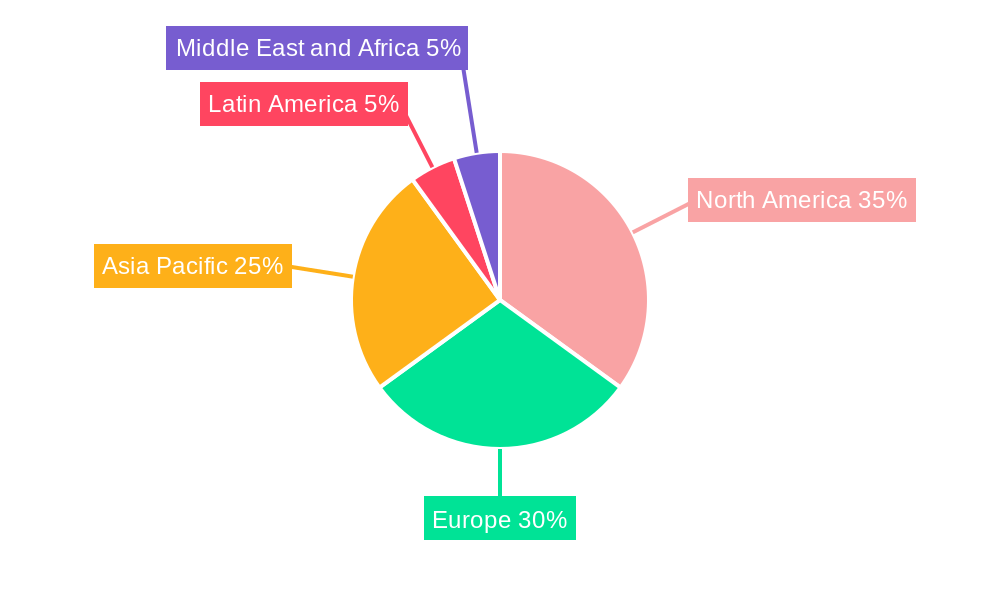
Electric Propulsion Systems Industry Regional Market Share
Geographic Coverage of Electric Propulsion Systems Industry
Electric Propulsion Systems Industry REPORT HIGHLIGHTS
| Aspects | Details |
|---|---|
| Study Period | 2020-2034 |
| Base Year | 2025 |
| Estimated Year | 2026 |
| Forecast Period | 2026-2034 |
| Historical Period | 2020-2025 |
| Growth Rate | CAGR of 6.09% from 2020-2034 |
| Segmentation |
|
Table of Contents
- 1. Introduction
- 1.1. Research Scope
- 1.2. Market Segmentation
- 1.3. Research Objective
- 1.4. Definitions and Assumptions
- 2. Executive Summary
- 2.1. Market Snapshot
- 3. Market Dynamics
- 3.1. Market Drivers
- 3.2. Market Restrains
- 3.3. Market Trends
- 3.4. Market Opportunities
- 4. Market Factor Analysis
- 4.1. Porters Five Forces
- 4.1.1. Bargaining Power of Suppliers
- 4.1.2. Bargaining Power of Buyers
- 4.1.3. Threat of New Entrants
- 4.1.4. Threat of Substitutes
- 4.1.5. Competitive Rivalry
- 4.2. PESTEL analysis
- 4.3. BCG Analysis
- 4.3.1. Stars (High Growth, High Market Share)
- 4.3.2. Cash Cows (Low Growth, High Market Share)
- 4.3.3. Question Mark (High Growth, Low Market Share)
- 4.3.4. Dogs (Low Growth, Low Market Share)
- 4.4. Ansoff Matrix Analysis
- 4.5. Supply Chain Analysis
- 4.6. Regulatory Landscape
- 4.7. Current Market Potential and Opportunity Assessment (TAM–SAM–SOM Framework)
- 4.8. TIR Analyst Note
- 4.1. Porters Five Forces
- 5. Market Analysis, Insights and Forecast 2021-2033
- 5.1. Market Analysis, Insights and Forecast - by Production Analysis
- 5.2. Market Analysis, Insights and Forecast - by Consumption Analysis
- 5.3. Market Analysis, Insights and Forecast - by Import Market Analysis (Value & Volume)
- 5.4. Market Analysis, Insights and Forecast - by Export Market Analysis (Value & Volume)
- 5.5. Market Analysis, Insights and Forecast - by Price Trend Analysis
- 5.6. Market Analysis, Insights and Forecast - by Region
- 5.6.1. North America
- 5.6.2. South America
- 5.6.3. Europe
- 5.6.4. Middle East & Africa
- 5.6.5. Asia Pacific
- 6. Global Electric Propulsion Systems Industry Analysis, Insights and Forecast, 2021-2033
- 6.1. Market Analysis, Insights and Forecast - by Production Analysis
- 6.2. Market Analysis, Insights and Forecast - by Consumption Analysis
- 6.3. Market Analysis, Insights and Forecast - by Import Market Analysis (Value & Volume)
- 6.4. Market Analysis, Insights and Forecast - by Export Market Analysis (Value & Volume)
- 6.5. Market Analysis, Insights and Forecast - by Price Trend Analysis
- 7. North America Electric Propulsion Systems Industry Analysis, Insights and Forecast, 2020-2032
- 7.1. Market Analysis, Insights and Forecast - by Production Analysis
- 7.2. Market Analysis, Insights and Forecast - by Consumption Analysis
- 7.3. Market Analysis, Insights and Forecast - by Import Market Analysis (Value & Volume)
- 7.4. Market Analysis, Insights and Forecast - by Export Market Analysis (Value & Volume)
- 7.5. Market Analysis, Insights and Forecast - by Price Trend Analysis
- 8. South America Electric Propulsion Systems Industry Analysis, Insights and Forecast, 2020-2032
- 8.1. Market Analysis, Insights and Forecast - by Production Analysis
- 8.2. Market Analysis, Insights and Forecast - by Consumption Analysis
- 8.3. Market Analysis, Insights and Forecast - by Import Market Analysis (Value & Volume)
- 8.4. Market Analysis, Insights and Forecast - by Export Market Analysis (Value & Volume)
- 8.5. Market Analysis, Insights and Forecast - by Price Trend Analysis
- 9. Europe Electric Propulsion Systems Industry Analysis, Insights and Forecast, 2020-2032
- 9.1. Market Analysis, Insights and Forecast - by Production Analysis
- 9.2. Market Analysis, Insights and Forecast - by Consumption Analysis
- 9.3. Market Analysis, Insights and Forecast - by Import Market Analysis (Value & Volume)
- 9.4. Market Analysis, Insights and Forecast - by Export Market Analysis (Value & Volume)
- 9.5. Market Analysis, Insights and Forecast - by Price Trend Analysis
- 10. Middle East & Africa Electric Propulsion Systems Industry Analysis, Insights and Forecast, 2020-2032
- 10.1. Market Analysis, Insights and Forecast - by Production Analysis
- 10.2. Market Analysis, Insights and Forecast - by Consumption Analysis
- 10.3. Market Analysis, Insights and Forecast - by Import Market Analysis (Value & Volume)
- 10.4. Market Analysis, Insights and Forecast - by Export Market Analysis (Value & Volume)
- 10.5. Market Analysis, Insights and Forecast - by Price Trend Analysis
- 11. Asia Pacific Electric Propulsion Systems Industry Analysis, Insights and Forecast, 2020-2032
- 11.1. Market Analysis, Insights and Forecast - by Production Analysis
- 11.2. Market Analysis, Insights and Forecast - by Consumption Analysis
- 11.3. Market Analysis, Insights and Forecast - by Import Market Analysis (Value & Volume)
- 11.4. Market Analysis, Insights and Forecast - by Export Market Analysis (Value & Volume)
- 11.5. Market Analysis, Insights and Forecast - by Price Trend Analysis
- 12. Competitive Analysis
- 12.1. Company Profiles
- 12.1.1 Accion Systems Inc
- 12.1.1.1. Company Overview
- 12.1.1.2. Products
- 12.1.1.3. Company Financials
- 12.1.1.4. SWOT Analysis
- 12.1.2 SITAEL SpA
- 12.1.2.1. Company Overview
- 12.1.2.2. Products
- 12.1.2.3. Company Financials
- 12.1.2.4. SWOT Analysis
- 12.1.3 Airbus SE
- 12.1.3.1. Company Overview
- 12.1.3.2. Products
- 12.1.3.3. Company Financials
- 12.1.3.4. SWOT Analysis
- 12.1.4 Daihatsu Diesel Mfg Co Ltd
- 12.1.4.1. Company Overview
- 12.1.4.2. Products
- 12.1.4.3. Company Financials
- 12.1.4.4. SWOT Analysis
- 12.1.5 Safran SA
- 12.1.5.1. Company Overview
- 12.1.5.2. Products
- 12.1.5.3. Company Financials
- 12.1.5.4. SWOT Analysis
- 12.1.6 Aerojet Rocketdyne Holdings Inc
- 12.1.6.1. Company Overview
- 12.1.6.2. Products
- 12.1.6.3. Company Financials
- 12.1.6.4. SWOT Analysis
- 12.1.7 Orbital ATK (Northrop Grumman Corporation)
- 12.1.7.1. Company Overview
- 12.1.7.2. Products
- 12.1.7.3. Company Financials
- 12.1.7.4. SWOT Analysis
- 12.1.8 Efficient Drivetrains Inc (Cummins Inc )
- 12.1.8.1. Company Overview
- 12.1.8.2. Products
- 12.1.8.3. Company Financials
- 12.1.8.4. SWOT Analysis
- 12.1.9 Collins Aerospace (RTX Corporation
- 12.1.9.1. Company Overview
- 12.1.9.2. Products
- 12.1.9.3. Company Financials
- 12.1.9.4. SWOT Analysis
- 12.1.10 Busek Co Inc
- 12.1.10.1. Company Overview
- 12.1.10.2. Products
- 12.1.10.3. Company Financials
- 12.1.10.4. SWOT Analysis
- 12.1.11 Thales Alenia Space
- 12.1.11.1. Company Overview
- 12.1.11.2. Products
- 12.1.11.3. Company Financials
- 12.1.11.4. SWOT Analysis
- 12.1.12 General Electric Company
- 12.1.12.1. Company Overview
- 12.1.12.2. Products
- 12.1.12.3. Company Financials
- 12.1.12.4. SWOT Analysis
- 12.1.13 The Boeing Company
- 12.1.13.1. Company Overview
- 12.1.13.2. Products
- 12.1.13.3. Company Financials
- 12.1.13.4. SWOT Analysis
- 12.1.1 Accion Systems Inc
- 12.2. Market Entropy
- 12.2.1 Company's Key Areas Served
- 12.2.2 Recent Developments
- 12.3. Company Market Share Analysis 2025
- 12.3.1 Top 5 Companies Market Share Analysis
- 12.3.2 Top 3 Companies Market Share Analysis
- 12.4. List of Potential Customers
- 13. Research Methodology
List of Figures
- Figure 1: Global Electric Propulsion Systems Industry Revenue Breakdown (Million, %) by Region 2025 & 2033
- Figure 2: North America Electric Propulsion Systems Industry Revenue (Million), by Production Analysis 2025 & 2033
- Figure 3: North America Electric Propulsion Systems Industry Revenue Share (%), by Production Analysis 2025 & 2033
- Figure 4: North America Electric Propulsion Systems Industry Revenue (Million), by Consumption Analysis 2025 & 2033
- Figure 5: North America Electric Propulsion Systems Industry Revenue Share (%), by Consumption Analysis 2025 & 2033
- Figure 6: North America Electric Propulsion Systems Industry Revenue (Million), by Import Market Analysis (Value & Volume) 2025 & 2033
- Figure 7: North America Electric Propulsion Systems Industry Revenue Share (%), by Import Market Analysis (Value & Volume) 2025 & 2033
- Figure 8: North America Electric Propulsion Systems Industry Revenue (Million), by Export Market Analysis (Value & Volume) 2025 & 2033
- Figure 9: North America Electric Propulsion Systems Industry Revenue Share (%), by Export Market Analysis (Value & Volume) 2025 & 2033
- Figure 10: North America Electric Propulsion Systems Industry Revenue (Million), by Price Trend Analysis 2025 & 2033
- Figure 11: North America Electric Propulsion Systems Industry Revenue Share (%), by Price Trend Analysis 2025 & 2033
- Figure 12: North America Electric Propulsion Systems Industry Revenue (Million), by Country 2025 & 2033
- Figure 13: North America Electric Propulsion Systems Industry Revenue Share (%), by Country 2025 & 2033
- Figure 14: South America Electric Propulsion Systems Industry Revenue (Million), by Production Analysis 2025 & 2033
- Figure 15: South America Electric Propulsion Systems Industry Revenue Share (%), by Production Analysis 2025 & 2033
- Figure 16: South America Electric Propulsion Systems Industry Revenue (Million), by Consumption Analysis 2025 & 2033
- Figure 17: South America Electric Propulsion Systems Industry Revenue Share (%), by Consumption Analysis 2025 & 2033
- Figure 18: South America Electric Propulsion Systems Industry Revenue (Million), by Import Market Analysis (Value & Volume) 2025 & 2033
- Figure 19: South America Electric Propulsion Systems Industry Revenue Share (%), by Import Market Analysis (Value & Volume) 2025 & 2033
- Figure 20: South America Electric Propulsion Systems Industry Revenue (Million), by Export Market Analysis (Value & Volume) 2025 & 2033
- Figure 21: South America Electric Propulsion Systems Industry Revenue Share (%), by Export Market Analysis (Value & Volume) 2025 & 2033
- Figure 22: South America Electric Propulsion Systems Industry Revenue (Million), by Price Trend Analysis 2025 & 2033
- Figure 23: South America Electric Propulsion Systems Industry Revenue Share (%), by Price Trend Analysis 2025 & 2033
- Figure 24: South America Electric Propulsion Systems Industry Revenue (Million), by Country 2025 & 2033
- Figure 25: South America Electric Propulsion Systems Industry Revenue Share (%), by Country 2025 & 2033
- Figure 26: Europe Electric Propulsion Systems Industry Revenue (Million), by Production Analysis 2025 & 2033
- Figure 27: Europe Electric Propulsion Systems Industry Revenue Share (%), by Production Analysis 2025 & 2033
- Figure 28: Europe Electric Propulsion Systems Industry Revenue (Million), by Consumption Analysis 2025 & 2033
- Figure 29: Europe Electric Propulsion Systems Industry Revenue Share (%), by Consumption Analysis 2025 & 2033
- Figure 30: Europe Electric Propulsion Systems Industry Revenue (Million), by Import Market Analysis (Value & Volume) 2025 & 2033
- Figure 31: Europe Electric Propulsion Systems Industry Revenue Share (%), by Import Market Analysis (Value & Volume) 2025 & 2033
- Figure 32: Europe Electric Propulsion Systems Industry Revenue (Million), by Export Market Analysis (Value & Volume) 2025 & 2033
- Figure 33: Europe Electric Propulsion Systems Industry Revenue Share (%), by Export Market Analysis (Value & Volume) 2025 & 2033
- Figure 34: Europe Electric Propulsion Systems Industry Revenue (Million), by Price Trend Analysis 2025 & 2033
- Figure 35: Europe Electric Propulsion Systems Industry Revenue Share (%), by Price Trend Analysis 2025 & 2033
- Figure 36: Europe Electric Propulsion Systems Industry Revenue (Million), by Country 2025 & 2033
- Figure 37: Europe Electric Propulsion Systems Industry Revenue Share (%), by Country 2025 & 2033
- Figure 38: Middle East & Africa Electric Propulsion Systems Industry Revenue (Million), by Production Analysis 2025 & 2033
- Figure 39: Middle East & Africa Electric Propulsion Systems Industry Revenue Share (%), by Production Analysis 2025 & 2033
- Figure 40: Middle East & Africa Electric Propulsion Systems Industry Revenue (Million), by Consumption Analysis 2025 & 2033
- Figure 41: Middle East & Africa Electric Propulsion Systems Industry Revenue Share (%), by Consumption Analysis 2025 & 2033
- Figure 42: Middle East & Africa Electric Propulsion Systems Industry Revenue (Million), by Import Market Analysis (Value & Volume) 2025 & 2033
- Figure 43: Middle East & Africa Electric Propulsion Systems Industry Revenue Share (%), by Import Market Analysis (Value & Volume) 2025 & 2033
- Figure 44: Middle East & Africa Electric Propulsion Systems Industry Revenue (Million), by Export Market Analysis (Value & Volume) 2025 & 2033
- Figure 45: Middle East & Africa Electric Propulsion Systems Industry Revenue Share (%), by Export Market Analysis (Value & Volume) 2025 & 2033
- Figure 46: Middle East & Africa Electric Propulsion Systems Industry Revenue (Million), by Price Trend Analysis 2025 & 2033
- Figure 47: Middle East & Africa Electric Propulsion Systems Industry Revenue Share (%), by Price Trend Analysis 2025 & 2033
- Figure 48: Middle East & Africa Electric Propulsion Systems Industry Revenue (Million), by Country 2025 & 2033
- Figure 49: Middle East & Africa Electric Propulsion Systems Industry Revenue Share (%), by Country 2025 & 2033
- Figure 50: Asia Pacific Electric Propulsion Systems Industry Revenue (Million), by Production Analysis 2025 & 2033
- Figure 51: Asia Pacific Electric Propulsion Systems Industry Revenue Share (%), by Production Analysis 2025 & 2033
- Figure 52: Asia Pacific Electric Propulsion Systems Industry Revenue (Million), by Consumption Analysis 2025 & 2033
- Figure 53: Asia Pacific Electric Propulsion Systems Industry Revenue Share (%), by Consumption Analysis 2025 & 2033
- Figure 54: Asia Pacific Electric Propulsion Systems Industry Revenue (Million), by Import Market Analysis (Value & Volume) 2025 & 2033
- Figure 55: Asia Pacific Electric Propulsion Systems Industry Revenue Share (%), by Import Market Analysis (Value & Volume) 2025 & 2033
- Figure 56: Asia Pacific Electric Propulsion Systems Industry Revenue (Million), by Export Market Analysis (Value & Volume) 2025 & 2033
- Figure 57: Asia Pacific Electric Propulsion Systems Industry Revenue Share (%), by Export Market Analysis (Value & Volume) 2025 & 2033
- Figure 58: Asia Pacific Electric Propulsion Systems Industry Revenue (Million), by Price Trend Analysis 2025 & 2033
- Figure 59: Asia Pacific Electric Propulsion Systems Industry Revenue Share (%), by Price Trend Analysis 2025 & 2033
- Figure 60: Asia Pacific Electric Propulsion Systems Industry Revenue (Million), by Country 2025 & 2033
- Figure 61: Asia Pacific Electric Propulsion Systems Industry Revenue Share (%), by Country 2025 & 2033
List of Tables
- Table 1: Global Electric Propulsion Systems Industry Revenue Million Forecast, by Production Analysis 2020 & 2033
- Table 2: Global Electric Propulsion Systems Industry Revenue Million Forecast, by Consumption Analysis 2020 & 2033
- Table 3: Global Electric Propulsion Systems Industry Revenue Million Forecast, by Import Market Analysis (Value & Volume) 2020 & 2033
- Table 4: Global Electric Propulsion Systems Industry Revenue Million Forecast, by Export Market Analysis (Value & Volume) 2020 & 2033
- Table 5: Global Electric Propulsion Systems Industry Revenue Million Forecast, by Price Trend Analysis 2020 & 2033
- Table 6: Global Electric Propulsion Systems Industry Revenue Million Forecast, by Region 2020 & 2033
- Table 7: Global Electric Propulsion Systems Industry Revenue Million Forecast, by Production Analysis 2020 & 2033
- Table 8: Global Electric Propulsion Systems Industry Revenue Million Forecast, by Consumption Analysis 2020 & 2033
- Table 9: Global Electric Propulsion Systems Industry Revenue Million Forecast, by Import Market Analysis (Value & Volume) 2020 & 2033
- Table 10: Global Electric Propulsion Systems Industry Revenue Million Forecast, by Export Market Analysis (Value & Volume) 2020 & 2033
- Table 11: Global Electric Propulsion Systems Industry Revenue Million Forecast, by Price Trend Analysis 2020 & 2033
- Table 12: Global Electric Propulsion Systems Industry Revenue Million Forecast, by Country 2020 & 2033
- Table 13: United States Electric Propulsion Systems Industry Revenue (Million) Forecast, by Application 2020 & 2033
- Table 14: Canada Electric Propulsion Systems Industry Revenue (Million) Forecast, by Application 2020 & 2033
- Table 15: Mexico Electric Propulsion Systems Industry Revenue (Million) Forecast, by Application 2020 & 2033
- Table 16: Global Electric Propulsion Systems Industry Revenue Million Forecast, by Production Analysis 2020 & 2033
- Table 17: Global Electric Propulsion Systems Industry Revenue Million Forecast, by Consumption Analysis 2020 & 2033
- Table 18: Global Electric Propulsion Systems Industry Revenue Million Forecast, by Import Market Analysis (Value & Volume) 2020 & 2033
- Table 19: Global Electric Propulsion Systems Industry Revenue Million Forecast, by Export Market Analysis (Value & Volume) 2020 & 2033
- Table 20: Global Electric Propulsion Systems Industry Revenue Million Forecast, by Price Trend Analysis 2020 & 2033
- Table 21: Global Electric Propulsion Systems Industry Revenue Million Forecast, by Country 2020 & 2033
- Table 22: Brazil Electric Propulsion Systems Industry Revenue (Million) Forecast, by Application 2020 & 2033
- Table 23: Argentina Electric Propulsion Systems Industry Revenue (Million) Forecast, by Application 2020 & 2033
- Table 24: Rest of South America Electric Propulsion Systems Industry Revenue (Million) Forecast, by Application 2020 & 2033
- Table 25: Global Electric Propulsion Systems Industry Revenue Million Forecast, by Production Analysis 2020 & 2033
- Table 26: Global Electric Propulsion Systems Industry Revenue Million Forecast, by Consumption Analysis 2020 & 2033
- Table 27: Global Electric Propulsion Systems Industry Revenue Million Forecast, by Import Market Analysis (Value & Volume) 2020 & 2033
- Table 28: Global Electric Propulsion Systems Industry Revenue Million Forecast, by Export Market Analysis (Value & Volume) 2020 & 2033
- Table 29: Global Electric Propulsion Systems Industry Revenue Million Forecast, by Price Trend Analysis 2020 & 2033
- Table 30: Global Electric Propulsion Systems Industry Revenue Million Forecast, by Country 2020 & 2033
- Table 31: United Kingdom Electric Propulsion Systems Industry Revenue (Million) Forecast, by Application 2020 & 2033
- Table 32: Germany Electric Propulsion Systems Industry Revenue (Million) Forecast, by Application 2020 & 2033
- Table 33: France Electric Propulsion Systems Industry Revenue (Million) Forecast, by Application 2020 & 2033
- Table 34: Italy Electric Propulsion Systems Industry Revenue (Million) Forecast, by Application 2020 & 2033
- Table 35: Spain Electric Propulsion Systems Industry Revenue (Million) Forecast, by Application 2020 & 2033
- Table 36: Russia Electric Propulsion Systems Industry Revenue (Million) Forecast, by Application 2020 & 2033
- Table 37: Benelux Electric Propulsion Systems Industry Revenue (Million) Forecast, by Application 2020 & 2033
- Table 38: Nordics Electric Propulsion Systems Industry Revenue (Million) Forecast, by Application 2020 & 2033
- Table 39: Rest of Europe Electric Propulsion Systems Industry Revenue (Million) Forecast, by Application 2020 & 2033
- Table 40: Global Electric Propulsion Systems Industry Revenue Million Forecast, by Production Analysis 2020 & 2033
- Table 41: Global Electric Propulsion Systems Industry Revenue Million Forecast, by Consumption Analysis 2020 & 2033
- Table 42: Global Electric Propulsion Systems Industry Revenue Million Forecast, by Import Market Analysis (Value & Volume) 2020 & 2033
- Table 43: Global Electric Propulsion Systems Industry Revenue Million Forecast, by Export Market Analysis (Value & Volume) 2020 & 2033
- Table 44: Global Electric Propulsion Systems Industry Revenue Million Forecast, by Price Trend Analysis 2020 & 2033
- Table 45: Global Electric Propulsion Systems Industry Revenue Million Forecast, by Country 2020 & 2033
- Table 46: Turkey Electric Propulsion Systems Industry Revenue (Million) Forecast, by Application 2020 & 2033
- Table 47: Israel Electric Propulsion Systems Industry Revenue (Million) Forecast, by Application 2020 & 2033
- Table 48: GCC Electric Propulsion Systems Industry Revenue (Million) Forecast, by Application 2020 & 2033
- Table 49: North Africa Electric Propulsion Systems Industry Revenue (Million) Forecast, by Application 2020 & 2033
- Table 50: South Africa Electric Propulsion Systems Industry Revenue (Million) Forecast, by Application 2020 & 2033
- Table 51: Rest of Middle East & Africa Electric Propulsion Systems Industry Revenue (Million) Forecast, by Application 2020 & 2033
- Table 52: Global Electric Propulsion Systems Industry Revenue Million Forecast, by Production Analysis 2020 & 2033
- Table 53: Global Electric Propulsion Systems Industry Revenue Million Forecast, by Consumption Analysis 2020 & 2033
- Table 54: Global Electric Propulsion Systems Industry Revenue Million Forecast, by Import Market Analysis (Value & Volume) 2020 & 2033
- Table 55: Global Electric Propulsion Systems Industry Revenue Million Forecast, by Export Market Analysis (Value & Volume) 2020 & 2033
- Table 56: Global Electric Propulsion Systems Industry Revenue Million Forecast, by Price Trend Analysis 2020 & 2033
- Table 57: Global Electric Propulsion Systems Industry Revenue Million Forecast, by Country 2020 & 2033
- Table 58: China Electric Propulsion Systems Industry Revenue (Million) Forecast, by Application 2020 & 2033
- Table 59: India Electric Propulsion Systems Industry Revenue (Million) Forecast, by Application 2020 & 2033
- Table 60: Japan Electric Propulsion Systems Industry Revenue (Million) Forecast, by Application 2020 & 2033
- Table 61: South Korea Electric Propulsion Systems Industry Revenue (Million) Forecast, by Application 2020 & 2033
- Table 62: ASEAN Electric Propulsion Systems Industry Revenue (Million) Forecast, by Application 2020 & 2033
- Table 63: Oceania Electric Propulsion Systems Industry Revenue (Million) Forecast, by Application 2020 & 2033
- Table 64: Rest of Asia Pacific Electric Propulsion Systems Industry Revenue (Million) Forecast, by Application 2020 & 2033
Frequently Asked Questions
1. What is the projected Compound Annual Growth Rate (CAGR) of the Electric Propulsion Systems Industry?
The projected CAGR is approximately 6.09%.
2. Which companies are prominent players in the Electric Propulsion Systems Industry?
Key companies in the market include Accion Systems Inc, SITAEL SpA, Airbus SE, Daihatsu Diesel Mfg Co Ltd, Safran SA, Aerojet Rocketdyne Holdings Inc, Orbital ATK (Northrop Grumman Corporation), Efficient Drivetrains Inc (Cummins Inc ), Collins Aerospace (RTX Corporation, Busek Co Inc, Thales Alenia Space, General Electric Company, The Boeing Company.
3. What are the main segments of the Electric Propulsion Systems Industry?
The market segments include Production Analysis, Consumption Analysis, Import Market Analysis (Value & Volume), Export Market Analysis (Value & Volume), Price Trend Analysis.
4. Can you provide details about the market size?
The market size is estimated to be USD 10.94 Million as of 2022.
5. What are some drivers contributing to market growth?
; Increased Seaborne Threats And Ambiguous Maritime Security Policies; Increasing Adoption Of Security Technologies In Bric Countries.
6. What are the notable trends driving market growth?
Space Segment Envisioned to Experience Highest Growth During the Forecast Period.
7. Are there any restraints impacting market growth?
; High Risk Rate In Ungoverned Zones; Unstructured Security Standards And Technologies.
8. Can you provide examples of recent developments in the market?
N/A
9. What pricing options are available for accessing the report?
Pricing options include single-user, multi-user, and enterprise licenses priced at USD 4750, USD 5250, and USD 8750 respectively.
10. Is the market size provided in terms of value or volume?
The market size is provided in terms of value, measured in Million.
11. Are there any specific market keywords associated with the report?
Yes, the market keyword associated with the report is "Electric Propulsion Systems Industry," which aids in identifying and referencing the specific market segment covered.
12. How do I determine which pricing option suits my needs best?
The pricing options vary based on user requirements and access needs. Individual users may opt for single-user licenses, while businesses requiring broader access may choose multi-user or enterprise licenses for cost-effective access to the report.
13. Are there any additional resources or data provided in the Electric Propulsion Systems Industry report?
While the report offers comprehensive insights, it's advisable to review the specific contents or supplementary materials provided to ascertain if additional resources or data are available.
14. How can I stay updated on further developments or reports in the Electric Propulsion Systems Industry?
To stay informed about further developments, trends, and reports in the Electric Propulsion Systems Industry, consider subscribing to industry newsletters, following relevant companies and organizations, or regularly checking reputable industry news sources and publications.
Methodology
Step 1 - Identification of Relevant Samples Size from Population Database


Step 2 - Approaches for Defining Global Market Size (Value, Volume* & Price*)

Note*: In applicable scenarios
Step 3 - Data Sources
Primary Research
- Web Analytics
- Survey Reports
- Research Institute
- Latest Research Reports
- Opinion Leaders
Secondary Research
- Annual Reports
- White Paper
- Latest Press Release
- Industry Association
- Paid Database
- Investor Presentations

Step 4 - Data Triangulation
Involves using different sources of information in order to increase the validity of a study
These sources are likely to be stakeholders in a program - participants, other researchers, program staff, other community members, and so on.
Then we put all data in single framework & apply various statistical tools to find out the dynamic on the market.
During the analysis stage, feedback from the stakeholder groups would be compared to determine areas of agreement as well as areas of divergence