

Key Insights
The global gems market, valued at $12.7 billion in 2025, is poised for substantial expansion, projected to grow at a Compound Annual Growth Rate (CAGR) of 6.3% from 2025 to 2033. This growth is propelled by rising disposable incomes, particularly in developing economies, and an increasing consumer appetite for luxury and personalized jewelry. Key product categories, including rings, necklaces, earrings, and bracelets, are expected to drive market demand. The surge in online retail, facilitated by widespread internet access and sophisticated e-commerce platforms, offers unparalleled convenience and access to diverse offerings. Major industry players such as The Swatch Group AG, Pandora, and LVMH are capitalizing on their brand equity and extensive distribution networks. Emerging brands are carving out market share by focusing on specialized segments and pioneering innovative designs. Geographic expansion is expected to be led by North America and Asia Pacific, fueled by mature consumer bases and the burgeoning middle class in countries like China and India. However, potential market restraints include evolving regulatory landscapes concerning ethical sourcing and environmental considerations in mining operations.
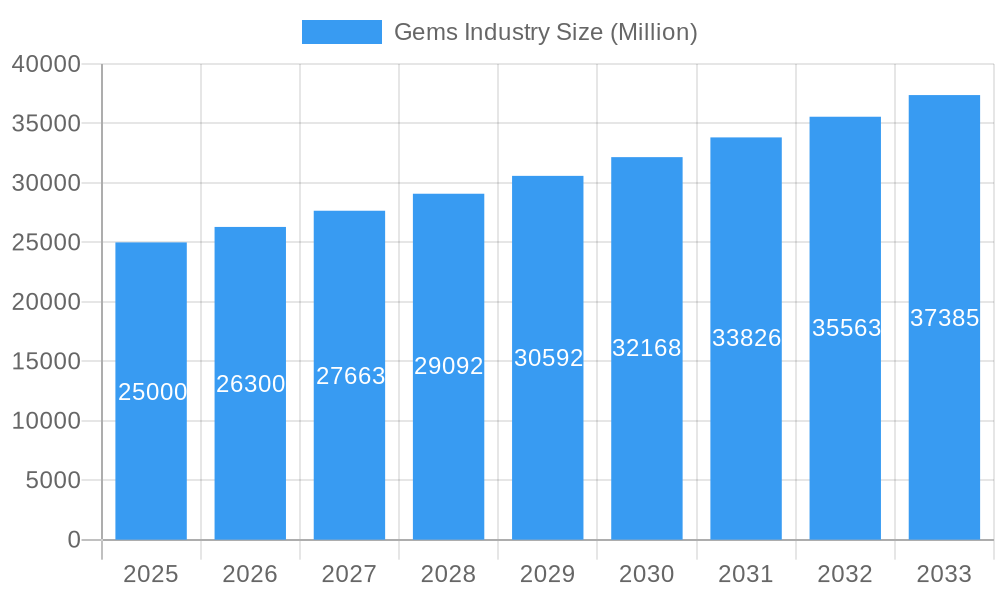
Gems Industry Market Size (In Billion)
The segmentation within the gems industry presents significant investment prospects. The escalating prominence of online retail underscores a fundamental shift in consumer purchasing habits towards convenience and access to a broader product spectrum. The forecast period (2025-2033) anticipates further diversification in product offerings, with a strong emphasis on customization and unique designs tailored to individual preferences. Sustained economic development in key regions will bolster demand for luxury gemstones, while ethical sourcing practices are set to become a critical factor influencing consumer decisions and industry standards. Increased competition between established and emerging brands will spur innovation across design, marketing, and distribution channels. The long-term outlook for the gems industry remains robust, supported by persistent consumer demand and the intrinsic value of precious gemstones.
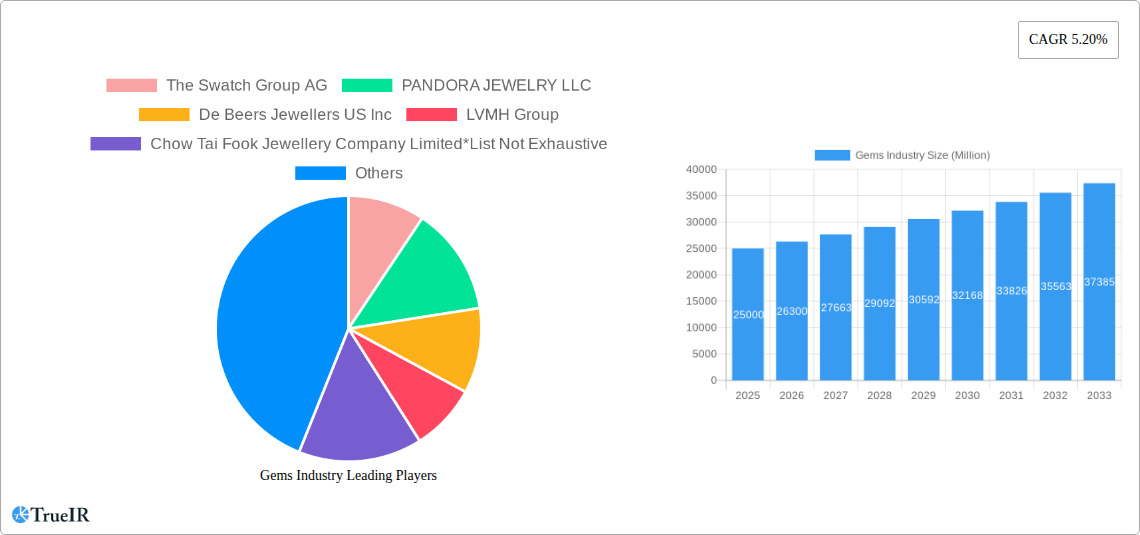
Gems Industry Company Market Share
Gems Industry Market Report: 2019-2033 Forecast
This comprehensive report provides a detailed analysis of the global gems industry, projecting robust growth from 2025 to 2033. With a focus on market structure, competitive dynamics, key players, and future trends, this report is an invaluable resource for industry professionals, investors, and researchers. The report analyzes a market valued at $xx Million in 2025, poised for significant expansion throughout the forecast period.
Gems Industry Market Structure & Competitive Landscape
The gems industry exhibits a moderately concentrated market structure, with several large players controlling a significant share. The Herfindahl-Hirschman Index (HHI) is estimated at xx, indicating a moderately consolidated market. Key innovation drivers include advancements in gemstone treatments, design innovations, and the emergence of lab-grown diamonds. Regulatory impacts, particularly those related to ethical sourcing and environmental sustainability, are increasingly significant. Product substitutes, such as lab-grown gemstones and alternative materials, are gaining traction, impacting the market share of naturally mined gemstones. The industry witnesses consistent mergers and acquisitions (M&A) activity, with an estimated $xx Million in M&A volume during 2019-2024. End-user segmentation is driven by diverse consumer preferences, including age, income, and lifestyle factors.
- Market Concentration: Moderately concentrated, HHI estimated at xx.
- Innovation Drivers: Gemstone treatments, design innovations, lab-grown diamonds.
- Regulatory Impacts: Ethical sourcing, environmental sustainability.
- Product Substitutes: Lab-grown gemstones, alternative materials.
- M&A Activity: Estimated $xx Million in M&A volume (2019-2024).
- End-User Segmentation: Age, income, lifestyle.
Gems Industry Market Trends & Opportunities
The global gems industry is experiencing robust growth, with a Compound Annual Growth Rate (CAGR) projected at xx% from 2025 to 2033. This growth is fueled by several factors, including rising disposable incomes in emerging economies, increasing demand for luxury goods, and the growing popularity of online retail channels. Technological advancements, such as 3D printing and augmented reality, are transforming product design and customer experience. Consumer preferences are shifting towards sustainable and ethically sourced gemstones, creating opportunities for companies embracing responsible sourcing practices. The market penetration rate of online retail channels is steadily increasing, signifying a significant shift in consumer purchasing behavior. Competitive dynamics are characterized by intense rivalry among established players and the emergence of new entrants offering innovative products and services.
Dominant Markets & Segments in Gems Industry
The Asia-Pacific region dominates the global gems market, driven by strong consumer demand in countries like China and India. Within product types, rings and necklaces represent the largest segments, accounting for approximately xx% of the total market. Offline retail stores continue to dominate the distribution channel, though online channels are experiencing significant growth.
- Key Growth Drivers (Asia-Pacific): Rising disposable incomes, expanding middle class, strong cultural affinity for jewelry.
- Dominant Product Types: Rings, necklaces (xx% market share).
- Distribution Channel: Offline retail stores (dominant), increasing online penetration.
Gems Industry Product Analysis
Recent product innovations focus on utilizing sustainable materials, incorporating technology into design processes, and offering personalized experiences. The emergence of lab-grown diamonds presents both a challenge and an opportunity, offering a more sustainable and affordable alternative while simultaneously driving innovation within natural diamond production and marketing. These advancements aim to cater to evolving consumer preferences and strengthen competitive advantages.
Key Drivers, Barriers & Challenges in Gems Industry
Key Drivers: Rising disposable incomes globally, increasing demand for luxury goods, technological advancements in design and production, and the growing adoption of e-commerce.
Challenges: Fluctuations in raw material prices, supply chain disruptions, stringent environmental regulations, and intense competition. An estimated xx% decrease in sales was observed in Q3 2024 due to supply chain bottlenecks.
Growth Drivers in the Gems Industry Market
The gems industry's growth is propelled by escalating consumer spending on luxury goods, particularly in emerging markets. Technological advancements enhance design capabilities, while sustainability concerns drive demand for ethically sourced gems and lab-grown alternatives. Favorable government regulations in key markets facilitate industry expansion.
Challenges Impacting Gems Industry Growth
Major challenges include volatile raw material costs, ethical sourcing complexities, and intensifying competition from both established and emerging players. Supply chain disruptions significantly impacted the industry in 2024, leading to production delays and price hikes.
Key Players Shaping the Gems Industry Market
- The Swatch Group AG
- PANDORA JEWELRY LLC
- De Beers Jewellers US Inc
- LVMH Group
- Chow Tai Fook Jewellery Company Limited
- Richemont SA
- Swarovski Crystal Online AG
- Chow Tai Fook Jewelry Company Limited
- Tata Sons Private Ltd
- Signet Jewelers
Significant Gems Industry Industry Milestones
- September 2022: Tanishq launches "The Chola" collection, inspired by the Chola Dynasty.
- August 2022: Louis Vuitton launches the Empreinte Fine Jewelry collection.
- August 2022: Pandora introduces the "Pandora Brilliance" line of lab-grown diamonds.
Future Outlook for Gems Industry Market
The gems industry's future is bright, driven by consistent growth in consumer spending and continuous innovations in product design and production. Strategic partnerships, expansion into new markets, and a focus on sustainability will play a crucial role in shaping the industry's future trajectory. The market is expected to reach $xx Million by 2033.
Gems Industry Segmentation
-
1. Product Type
- 1.1. Rings
- 1.2. Necklaces
- 1.3. Earrings
- 1.4. Bracelets
- 1.5. Chains and Pendants
- 1.6. Other Product Types
-
2. Distribution Channel
- 2.1. Offline Retail Stores
- 2.2. Online Retail Stores
Gems Industry Segmentation By Geography
-
1. North America
- 1.1. United States
- 1.2. Canada
- 1.3. Mexico
- 1.4. Rest of North America
-
2. Europe
- 2.1. Spain
- 2.2. United Kingdom
- 2.3. France
- 2.4. Germany
- 2.5. Russia
- 2.6. Italy
- 2.7. Rest of Europe
-
3. Asia Pacific
- 3.1. China
- 3.2. Japan
- 3.3. India
- 3.4. Australia
- 3.5. Rest of Asia Pacific
-
4. South America
- 4.1. Brazil
- 4.2. Argentina
- 4.3. Rest of South America
-
5. Middle East and Africa
- 5.1. South Africa
- 5.2. United Arab Emirates
- 5.3. Rest of Middle East and Africa
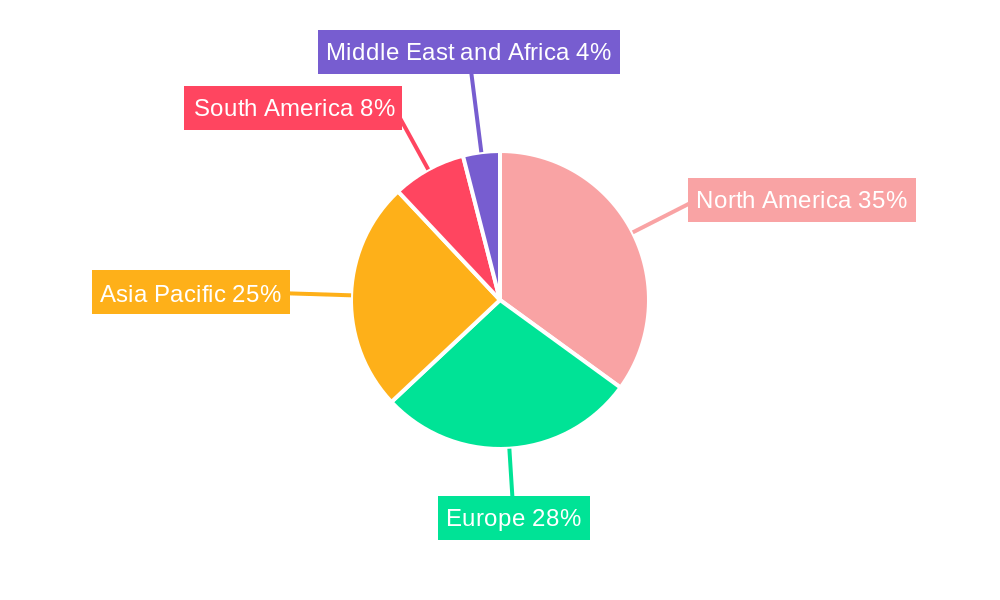
Gems Industry Regional Market Share
Geographic Coverage of Gems Industry
Gems Industry REPORT HIGHLIGHTS
| Aspects | Details |
|---|---|
| Study Period | 2020-2034 |
| Base Year | 2025 |
| Estimated Year | 2026 |
| Forecast Period | 2026-2034 |
| Historical Period | 2020-2025 |
| Growth Rate | CAGR of 6.3% from 2020-2034 |
| Segmentation |
|
Table of Contents
- 1. Introduction
- 1.1. Research Scope
- 1.2. Market Segmentation
- 1.3. Research Objective
- 1.4. Definitions and Assumptions
- 2. Executive Summary
- 2.1. Market Snapshot
- 3. Market Dynamics
- 3.1. Market Drivers
- 3.2. Market Restrains
- 3.3. Market Trends
- 3.4. Market Opportunities
- 4. Market Factor Analysis
- 4.1. Porters Five Forces
- 4.1.1. Bargaining Power of Suppliers
- 4.1.2. Bargaining Power of Buyers
- 4.1.3. Threat of New Entrants
- 4.1.4. Threat of Substitutes
- 4.1.5. Competitive Rivalry
- 4.2. PESTEL analysis
- 4.3. BCG Analysis
- 4.3.1. Stars (High Growth, High Market Share)
- 4.3.2. Cash Cows (Low Growth, High Market Share)
- 4.3.3. Question Mark (High Growth, Low Market Share)
- 4.3.4. Dogs (Low Growth, Low Market Share)
- 4.4. Ansoff Matrix Analysis
- 4.5. Supply Chain Analysis
- 4.6. Regulatory Landscape
- 4.7. Current Market Potential and Opportunity Assessment (TAM–SAM–SOM Framework)
- 4.8. TIR Analyst Note
- 4.1. Porters Five Forces
- 5. Market Analysis, Insights and Forecast 2021-2033
- 5.1. Market Analysis, Insights and Forecast - by Product Type
- 5.1.1. Rings
- 5.1.2. Necklaces
- 5.1.3. Earrings
- 5.1.4. Bracelets
- 5.1.5. Chains and Pendants
- 5.1.6. Other Product Types
- 5.2. Market Analysis, Insights and Forecast - by Distribution Channel
- 5.2.1. Offline Retail Stores
- 5.2.2. Online Retail Stores
- 5.3. Market Analysis, Insights and Forecast - by Region
- 5.3.1. North America
- 5.3.2. Europe
- 5.3.3. Asia Pacific
- 5.3.4. South America
- 5.3.5. Middle East and Africa
- 5.1. Market Analysis, Insights and Forecast - by Product Type
- 6. Global Gems Industry Analysis, Insights and Forecast, 2021-2033
- 6.1. Market Analysis, Insights and Forecast - by Product Type
- 6.1.1. Rings
- 6.1.2. Necklaces
- 6.1.3. Earrings
- 6.1.4. Bracelets
- 6.1.5. Chains and Pendants
- 6.1.6. Other Product Types
- 6.2. Market Analysis, Insights and Forecast - by Distribution Channel
- 6.2.1. Offline Retail Stores
- 6.2.2. Online Retail Stores
- 6.1. Market Analysis, Insights and Forecast - by Product Type
- 7. North America Gems Industry Analysis, Insights and Forecast, 2020-2032
- 7.1. Market Analysis, Insights and Forecast - by Product Type
- 7.1.1. Rings
- 7.1.2. Necklaces
- 7.1.3. Earrings
- 7.1.4. Bracelets
- 7.1.5. Chains and Pendants
- 7.1.6. Other Product Types
- 7.2. Market Analysis, Insights and Forecast - by Distribution Channel
- 7.2.1. Offline Retail Stores
- 7.2.2. Online Retail Stores
- 7.1. Market Analysis, Insights and Forecast - by Product Type
- 8. Europe Gems Industry Analysis, Insights and Forecast, 2020-2032
- 8.1. Market Analysis, Insights and Forecast - by Product Type
- 8.1.1. Rings
- 8.1.2. Necklaces
- 8.1.3. Earrings
- 8.1.4. Bracelets
- 8.1.5. Chains and Pendants
- 8.1.6. Other Product Types
- 8.2. Market Analysis, Insights and Forecast - by Distribution Channel
- 8.2.1. Offline Retail Stores
- 8.2.2. Online Retail Stores
- 8.1. Market Analysis, Insights and Forecast - by Product Type
- 9. Asia Pacific Gems Industry Analysis, Insights and Forecast, 2020-2032
- 9.1. Market Analysis, Insights and Forecast - by Product Type
- 9.1.1. Rings
- 9.1.2. Necklaces
- 9.1.3. Earrings
- 9.1.4. Bracelets
- 9.1.5. Chains and Pendants
- 9.1.6. Other Product Types
- 9.2. Market Analysis, Insights and Forecast - by Distribution Channel
- 9.2.1. Offline Retail Stores
- 9.2.2. Online Retail Stores
- 9.1. Market Analysis, Insights and Forecast - by Product Type
- 10. South America Gems Industry Analysis, Insights and Forecast, 2020-2032
- 10.1. Market Analysis, Insights and Forecast - by Product Type
- 10.1.1. Rings
- 10.1.2. Necklaces
- 10.1.3. Earrings
- 10.1.4. Bracelets
- 10.1.5. Chains and Pendants
- 10.1.6. Other Product Types
- 10.2. Market Analysis, Insights and Forecast - by Distribution Channel
- 10.2.1. Offline Retail Stores
- 10.2.2. Online Retail Stores
- 10.1. Market Analysis, Insights and Forecast - by Product Type
- 11. Middle East and Africa Gems Industry Analysis, Insights and Forecast, 2020-2032
- 11.1. Market Analysis, Insights and Forecast - by Product Type
- 11.1.1. Rings
- 11.1.2. Necklaces
- 11.1.3. Earrings
- 11.1.4. Bracelets
- 11.1.5. Chains and Pendants
- 11.1.6. Other Product Types
- 11.2. Market Analysis, Insights and Forecast - by Distribution Channel
- 11.2.1. Offline Retail Stores
- 11.2.2. Online Retail Stores
- 11.1. Market Analysis, Insights and Forecast - by Product Type
- 12. Competitive Analysis
- 12.1. Company Profiles
- 12.1.1 The Swatch Group AG
- 12.1.1.1. Company Overview
- 12.1.1.2. Products
- 12.1.1.3. Company Financials
- 12.1.1.4. SWOT Analysis
- 12.1.2 PANDORA JEWELRY LLC
- 12.1.2.1. Company Overview
- 12.1.2.2. Products
- 12.1.2.3. Company Financials
- 12.1.2.4. SWOT Analysis
- 12.1.3 De Beers Jewellers US Inc
- 12.1.3.1. Company Overview
- 12.1.3.2. Products
- 12.1.3.3. Company Financials
- 12.1.3.4. SWOT Analysis
- 12.1.4 LVMH Group
- 12.1.4.1. Company Overview
- 12.1.4.2. Products
- 12.1.4.3. Company Financials
- 12.1.4.4. SWOT Analysis
- 12.1.5 Chow Tai Fook Jewellery Company Limited*List Not Exhaustive
- 12.1.5.1. Company Overview
- 12.1.5.2. Products
- 12.1.5.3. Company Financials
- 12.1.5.4. SWOT Analysis
- 12.1.6 Richemont SA
- 12.1.6.1. Company Overview
- 12.1.6.2. Products
- 12.1.6.3. Company Financials
- 12.1.6.4. SWOT Analysis
- 12.1.7 Swarovski Crystal Online AG
- 12.1.7.1. Company Overview
- 12.1.7.2. Products
- 12.1.7.3. Company Financials
- 12.1.7.4. SWOT Analysis
- 12.1.8 Chow Tai Fook Jewelry Company Limited
- 12.1.8.1. Company Overview
- 12.1.8.2. Products
- 12.1.8.3. Company Financials
- 12.1.8.4. SWOT Analysis
- 12.1.9 Tata Sons Private Ltd
- 12.1.9.1. Company Overview
- 12.1.9.2. Products
- 12.1.9.3. Company Financials
- 12.1.9.4. SWOT Analysis
- 12.1.10 Signet Jewelers
- 12.1.10.1. Company Overview
- 12.1.10.2. Products
- 12.1.10.3. Company Financials
- 12.1.10.4. SWOT Analysis
- 12.1.1 The Swatch Group AG
- 12.2. Market Entropy
- 12.2.1 Company's Key Areas Served
- 12.2.2 Recent Developments
- 12.3. Company Market Share Analysis 2025
- 12.3.1 Top 5 Companies Market Share Analysis
- 12.3.2 Top 3 Companies Market Share Analysis
- 12.4. List of Potential Customers
- 13. Research Methodology
List of Figures
- Figure 1: Global Gems Industry Revenue Breakdown (billion, %) by Region 2025 & 2033
- Figure 2: North America Gems Industry Revenue (billion), by Product Type 2025 & 2033
- Figure 3: North America Gems Industry Revenue Share (%), by Product Type 2025 & 2033
- Figure 4: North America Gems Industry Revenue (billion), by Distribution Channel 2025 & 2033
- Figure 5: North America Gems Industry Revenue Share (%), by Distribution Channel 2025 & 2033
- Figure 6: North America Gems Industry Revenue (billion), by Country 2025 & 2033
- Figure 7: North America Gems Industry Revenue Share (%), by Country 2025 & 2033
- Figure 8: Europe Gems Industry Revenue (billion), by Product Type 2025 & 2033
- Figure 9: Europe Gems Industry Revenue Share (%), by Product Type 2025 & 2033
- Figure 10: Europe Gems Industry Revenue (billion), by Distribution Channel 2025 & 2033
- Figure 11: Europe Gems Industry Revenue Share (%), by Distribution Channel 2025 & 2033
- Figure 12: Europe Gems Industry Revenue (billion), by Country 2025 & 2033
- Figure 13: Europe Gems Industry Revenue Share (%), by Country 2025 & 2033
- Figure 14: Asia Pacific Gems Industry Revenue (billion), by Product Type 2025 & 2033
- Figure 15: Asia Pacific Gems Industry Revenue Share (%), by Product Type 2025 & 2033
- Figure 16: Asia Pacific Gems Industry Revenue (billion), by Distribution Channel 2025 & 2033
- Figure 17: Asia Pacific Gems Industry Revenue Share (%), by Distribution Channel 2025 & 2033
- Figure 18: Asia Pacific Gems Industry Revenue (billion), by Country 2025 & 2033
- Figure 19: Asia Pacific Gems Industry Revenue Share (%), by Country 2025 & 2033
- Figure 20: South America Gems Industry Revenue (billion), by Product Type 2025 & 2033
- Figure 21: South America Gems Industry Revenue Share (%), by Product Type 2025 & 2033
- Figure 22: South America Gems Industry Revenue (billion), by Distribution Channel 2025 & 2033
- Figure 23: South America Gems Industry Revenue Share (%), by Distribution Channel 2025 & 2033
- Figure 24: South America Gems Industry Revenue (billion), by Country 2025 & 2033
- Figure 25: South America Gems Industry Revenue Share (%), by Country 2025 & 2033
- Figure 26: Middle East and Africa Gems Industry Revenue (billion), by Product Type 2025 & 2033
- Figure 27: Middle East and Africa Gems Industry Revenue Share (%), by Product Type 2025 & 2033
- Figure 28: Middle East and Africa Gems Industry Revenue (billion), by Distribution Channel 2025 & 2033
- Figure 29: Middle East and Africa Gems Industry Revenue Share (%), by Distribution Channel 2025 & 2033
- Figure 30: Middle East and Africa Gems Industry Revenue (billion), by Country 2025 & 2033
- Figure 31: Middle East and Africa Gems Industry Revenue Share (%), by Country 2025 & 2033
List of Tables
- Table 1: Global Gems Industry Revenue billion Forecast, by Product Type 2020 & 2033
- Table 2: Global Gems Industry Revenue billion Forecast, by Distribution Channel 2020 & 2033
- Table 3: Global Gems Industry Revenue billion Forecast, by Region 2020 & 2033
- Table 4: Global Gems Industry Revenue billion Forecast, by Product Type 2020 & 2033
- Table 5: Global Gems Industry Revenue billion Forecast, by Distribution Channel 2020 & 2033
- Table 6: Global Gems Industry Revenue billion Forecast, by Country 2020 & 2033
- Table 7: United States Gems Industry Revenue (billion) Forecast, by Application 2020 & 2033
- Table 8: Canada Gems Industry Revenue (billion) Forecast, by Application 2020 & 2033
- Table 9: Mexico Gems Industry Revenue (billion) Forecast, by Application 2020 & 2033
- Table 10: Rest of North America Gems Industry Revenue (billion) Forecast, by Application 2020 & 2033
- Table 11: Global Gems Industry Revenue billion Forecast, by Product Type 2020 & 2033
- Table 12: Global Gems Industry Revenue billion Forecast, by Distribution Channel 2020 & 2033
- Table 13: Global Gems Industry Revenue billion Forecast, by Country 2020 & 2033
- Table 14: Spain Gems Industry Revenue (billion) Forecast, by Application 2020 & 2033
- Table 15: United Kingdom Gems Industry Revenue (billion) Forecast, by Application 2020 & 2033
- Table 16: France Gems Industry Revenue (billion) Forecast, by Application 2020 & 2033
- Table 17: Germany Gems Industry Revenue (billion) Forecast, by Application 2020 & 2033
- Table 18: Russia Gems Industry Revenue (billion) Forecast, by Application 2020 & 2033
- Table 19: Italy Gems Industry Revenue (billion) Forecast, by Application 2020 & 2033
- Table 20: Rest of Europe Gems Industry Revenue (billion) Forecast, by Application 2020 & 2033
- Table 21: Global Gems Industry Revenue billion Forecast, by Product Type 2020 & 2033
- Table 22: Global Gems Industry Revenue billion Forecast, by Distribution Channel 2020 & 2033
- Table 23: Global Gems Industry Revenue billion Forecast, by Country 2020 & 2033
- Table 24: China Gems Industry Revenue (billion) Forecast, by Application 2020 & 2033
- Table 25: Japan Gems Industry Revenue (billion) Forecast, by Application 2020 & 2033
- Table 26: India Gems Industry Revenue (billion) Forecast, by Application 2020 & 2033
- Table 27: Australia Gems Industry Revenue (billion) Forecast, by Application 2020 & 2033
- Table 28: Rest of Asia Pacific Gems Industry Revenue (billion) Forecast, by Application 2020 & 2033
- Table 29: Global Gems Industry Revenue billion Forecast, by Product Type 2020 & 2033
- Table 30: Global Gems Industry Revenue billion Forecast, by Distribution Channel 2020 & 2033
- Table 31: Global Gems Industry Revenue billion Forecast, by Country 2020 & 2033
- Table 32: Brazil Gems Industry Revenue (billion) Forecast, by Application 2020 & 2033
- Table 33: Argentina Gems Industry Revenue (billion) Forecast, by Application 2020 & 2033
- Table 34: Rest of South America Gems Industry Revenue (billion) Forecast, by Application 2020 & 2033
- Table 35: Global Gems Industry Revenue billion Forecast, by Product Type 2020 & 2033
- Table 36: Global Gems Industry Revenue billion Forecast, by Distribution Channel 2020 & 2033
- Table 37: Global Gems Industry Revenue billion Forecast, by Country 2020 & 2033
- Table 38: South Africa Gems Industry Revenue (billion) Forecast, by Application 2020 & 2033
- Table 39: United Arab Emirates Gems Industry Revenue (billion) Forecast, by Application 2020 & 2033
- Table 40: Rest of Middle East and Africa Gems Industry Revenue (billion) Forecast, by Application 2020 & 2033
Frequently Asked Questions
1. What is the projected Compound Annual Growth Rate (CAGR) of the Gems Industry?
The projected CAGR is approximately 6.3%.
2. Which companies are prominent players in the Gems Industry?
Key companies in the market include The Swatch Group AG, PANDORA JEWELRY LLC, De Beers Jewellers US Inc, LVMH Group, Chow Tai Fook Jewellery Company Limited*List Not Exhaustive, Richemont SA, Swarovski Crystal Online AG, Chow Tai Fook Jewelry Company Limited, Tata Sons Private Ltd, Signet Jewelers.
3. What are the main segments of the Gems Industry?
The market segments include Product Type, Distribution Channel.
4. Can you provide details about the market size?
The market size is estimated to be USD 12.7 billion as of 2022.
5. What are some drivers contributing to market growth?
Product Innovations to Drive Demand for Watches; Rising Demand for Premium Fashion Items.
6. What are the notable trends driving market growth?
Rising Demand for Gems & Jewellery Owing to the Emerging Middle Class.
7. Are there any restraints impacting market growth?
Presence of Counterfeit Products.
8. Can you provide examples of recent developments in the market?
September 2022: As an ode to the Chola Dynasty, which is considered a golden age of Indian history, Tanishq launched its new exclusive collection The Chola, which is an ode to the dynasty.
9. What pricing options are available for accessing the report?
Pricing options include single-user, multi-user, and enterprise licenses priced at USD 4750, USD 5250, and USD 8750 respectively.
10. Is the market size provided in terms of value or volume?
The market size is provided in terms of value, measured in billion.
11. Are there any specific market keywords associated with the report?
Yes, the market keyword associated with the report is "Gems Industry," which aids in identifying and referencing the specific market segment covered.
12. How do I determine which pricing option suits my needs best?
The pricing options vary based on user requirements and access needs. Individual users may opt for single-user licenses, while businesses requiring broader access may choose multi-user or enterprise licenses for cost-effective access to the report.
13. Are there any additional resources or data provided in the Gems Industry report?
While the report offers comprehensive insights, it's advisable to review the specific contents or supplementary materials provided to ascertain if additional resources or data are available.
14. How can I stay updated on further developments or reports in the Gems Industry?
To stay informed about further developments, trends, and reports in the Gems Industry, consider subscribing to industry newsletters, following relevant companies and organizations, or regularly checking reputable industry news sources and publications.
Methodology
Step 1 - Identification of Relevant Samples Size from Population Database


Step 2 - Approaches for Defining Global Market Size (Value, Volume* & Price*)

Note*: In applicable scenarios
Step 3 - Data Sources
Primary Research
- Web Analytics
- Survey Reports
- Research Institute
- Latest Research Reports
- Opinion Leaders
Secondary Research
- Annual Reports
- White Paper
- Latest Press Release
- Industry Association
- Paid Database
- Investor Presentations

Step 4 - Data Triangulation
Involves using different sources of information in order to increase the validity of a study
These sources are likely to be stakeholders in a program - participants, other researchers, program staff, other community members, and so on.
Then we put all data in single framework & apply various statistical tools to find out the dynamic on the market.
During the analysis stage, feedback from the stakeholder groups would be compared to determine areas of agreement as well as areas of divergence