

Key Insights
The global hockey market, including equipment such as sticks, balls, footwear, and protective gear, is projected for steady expansion. The market size is estimated at $9.5 billion in the base year 2025, with a projected Compound Annual Growth Rate (CAGR) of 7.5%. This growth is propelled by increasing participation in both ice and field hockey, particularly among youth and amateur athletes. Key market drivers include the rising popularity of these sports, amplified by extensive media coverage, major televised events, and robust grassroots development programs. Technological innovations in equipment, such as the development of lighter, more durable sticks and advanced protective gear, are further enhancing player performance and attracting a broader player base. However, the market confronts challenges, including the high cost of equipment, which can be a barrier to entry for new participants, especially in emerging economies. Segmentation analysis indicates a continued preference for offline retail, though online sales are experiencing robust growth, supported by increasing e-commerce adoption and direct-to-consumer strategies from leading brands.
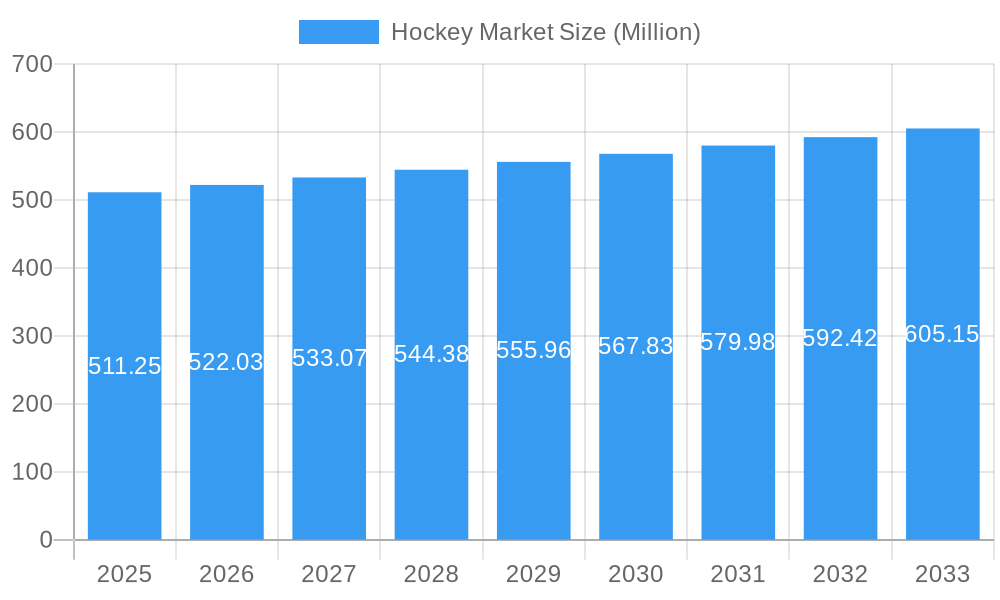
Hockey Market Market Size (In Billion)
Geographically, North America and Europe remain dominant markets, with substantial growth potential identified in the Asia-Pacific region and other developing economies. The competitive environment features a blend of established global sportswear giants and niche specialized manufacturers, each serving distinct market segments and price tiers. The forecast period (2025-2033) anticipates sustained, moderate growth, influenced by rising disposable incomes in developing regions, ongoing investment in sports infrastructure, and continuous product innovation within the hockey equipment sector. A deep understanding of these market dynamics is essential for brands seeking to effectively engage target demographics and leverage emerging opportunities in this dynamic sector.
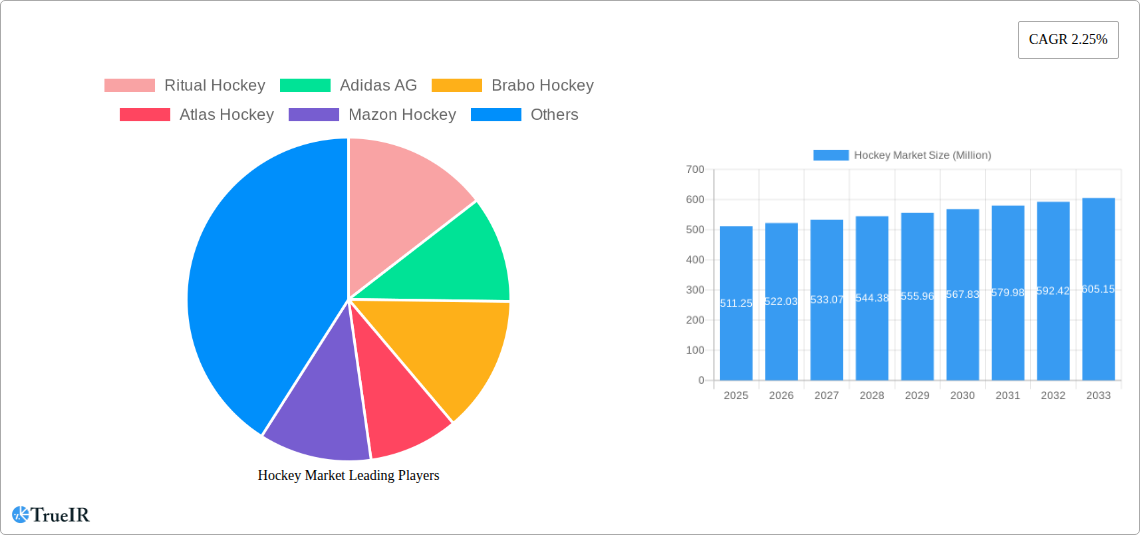
Hockey Market Company Market Share
Hockey Market Report: A Comprehensive Analysis (2019-2033)
This dynamic report provides a comprehensive analysis of the Hockey Market, covering the period 2019-2033, with a focus on market size, segmentation, competitive landscape, and future growth prospects. Leveraging extensive research and data analysis, this report offers invaluable insights for stakeholders across the hockey industry, from manufacturers and distributors to investors and market analysts. The report utilizes a robust methodology, incorporating both qualitative and quantitative data to provide a holistic view of the market's evolution and future trajectory. The base year for this analysis is 2025, with estimations provided for 2025 and forecasts extending to 2033.
Hockey Market Structure & Competitive Landscape
The global hockey market exhibits a moderately concentrated structure, with several key players holding significant market share. The industry is characterized by intense competition, driven by continuous product innovation, strategic partnerships, and mergers & acquisitions (M&A). Concentration ratios reveal a Herfindahl-Hirschman Index (HHI) of xx, indicating a moderately consolidated market.
Innovation Drivers: Key drivers of innovation include the development of lightweight and high-performance materials in hockey sticks and protective gear, along with advancements in stick technology aimed at enhancing shot power and accuracy.
Regulatory Impacts: Regulations concerning product safety and environmental standards significantly influence market dynamics. Compliance costs and restrictions on certain materials can impact the cost and availability of products.
Product Substitutes: While limited, substitutes exist in the form of alternative sports equipment or recreational activities.
End-User Segmentation: The market is segmented primarily by product type (sticks, balls, shoes, protective gear), distribution channel (offline, online), and geographic region. Youth and adult segments each display unique demand patterns.
M&A Trends: The hockey market has witnessed a moderate level of M&A activity in recent years, primarily focused on expanding market reach and product portfolios. The estimated volume of M&A deals in the past five years is xx Million. These transactions have largely been driven by the desire to consolidate market share and leverage synergies between companies.
Hockey Market Trends & Opportunities
The global hockey market is projected to experience robust growth, with an estimated CAGR of xx% during the forecast period (2025-2033). This growth is driven by several key factors: rising participation rates, especially in youth hockey and emerging markets, increasing consumer spending on sporting goods, and the rising popularity of online retail channels.
Technological advancements, such as the use of advanced materials and data analytics to improve product design and performance, are also contributing to market expansion. Consumer preferences are shifting towards personalized equipment and a focus on enhanced safety and comfort features. The increasing influence of social media and influencer marketing strategies further enhances the market's growth trajectory. The market penetration rate for online sales is estimated to reach xx% by 2033, reflecting the growing adoption of e-commerce channels. Competitive dynamics are intensified by continuous product innovation, strategic partnerships, and aggressive marketing campaigns.
Dominant Markets & Segments in Hockey Market
The North American region currently dominates the global hockey market, followed by Europe. Within these regions, specific countries such as the USA, Canada, and Germany display particularly strong market potential due to established hockey cultures and robust participation rates.
Key Growth Drivers:
- Well-established sporting culture: High participation rates in hockey contribute to high market demand.
- Robust infrastructure: Investment in hockey infrastructure, such as playing fields and training facilities, supports market growth.
- Government support and sponsorship: Governmental support for sports development and sponsorship initiatives stimulate growth.
- Increasing disposable income: Rising disposable incomes contribute to increased consumer spending on hockey equipment.
Product Type:
- Hockey Sticks and Balls: This segment continues to be the largest contributor to market revenue, driven by ongoing technological advancements and the demand for high-performance equipment.
- Field Hockey Shoes: This segment shows steady growth, fuelled by improvements in shoe design, comfort, and performance characteristics.
- Protective Gear and Accessories: Growth in this segment is driven by the increasing focus on player safety and the availability of advanced protective gear.
Distribution Channel:
- Offline Retail Stores: While online sales are growing, offline retail stores remain the primary distribution channel, offering consumers the opportunity to physically examine and try equipment.
- Online Retail Stores: The online segment is experiencing rapid growth, driven by convenience, competitive pricing, and increased online accessibility.
Hockey Market Product Analysis
The hockey market showcases a dynamic product landscape, characterized by continuous innovation in materials, design, and technology. High-performance composites, advanced manufacturing techniques, and ergonomic designs are key features of modern hockey sticks, enhancing power, accuracy, and control. Protective gear increasingly incorporates advanced materials and technologies to optimize protection while minimizing weight and enhancing comfort. These innovations cater to the evolving demands of players, seeking equipment that optimizes performance, safety, and comfort.
Key Drivers, Barriers & Challenges in Hockey Market
Key Drivers:
- Rising participation rates: Increased participation in hockey at all levels fuels market demand.
- Technological advancements: Innovations in materials and design enhance product performance, driving sales.
- Growing consumer spending: Increased disposable incomes translate to higher spending on sports equipment.
Key Challenges:
- Supply chain disruptions: Global supply chain issues can impact production and distribution, potentially causing shortages and price increases. The impact of these disruptions is estimated to have reduced market growth by xx Million in 2022.
- Increased competition: Intense competition among manufacturers necessitates ongoing innovation and aggressive marketing strategies.
- Economic downturns: Recessions can lead to reduced consumer spending on discretionary items, such as sports equipment.
Growth Drivers in the Hockey Market Market
Several key factors contribute to the growth of the hockey market. These include the rising participation rates in youth and adult hockey leagues, technological advancements leading to improved equipment performance, and increasing consumer spending on recreational activities. Government initiatives to promote sports participation and investment in sports infrastructure further propel market growth.
Challenges Impacting Hockey Market Growth
Challenges confronting the hockey market include supply chain disruptions, leading to production bottlenecks and price fluctuations. The rising costs of raw materials also pose a significant constraint. Intense competition and fluctuating economic conditions add further complexities, potentially affecting market growth.
Key Players Shaping the Hockey Market Market
- Ritual Hockey
- Adidas AG
- Brabo Hockey
- Atlas Hockey
- Mazon Hockey
- Dita Hockey
- Grays of Cambridge (International) Ltd
- Osaka World
- Gryphon Hockey Ltd
- STX*List Not Exhaustive
- OBO
- Princess Sportsgear
Significant Hockey Market Industry Milestones
- June 2021: USA Field Hockey launched an online equipment store, increasing accessibility to the sport.
- May 2021: Ritual Hockey partnered with Clubhouse Hockey to expand market reach.
- June 2020: Ritual Hockey introduced a new Plus + hockey stick head shape, increasing surface area by 20%.
Future Outlook for Hockey Market Market
The hockey market is poised for continued growth, driven by rising participation rates, technological advancements, and increasing consumer spending. Strategic partnerships, product diversification, and expansion into new markets present significant opportunities for market players. The market is expected to witness further consolidation through M&A activities, leading to a more concentrated landscape. The long-term outlook remains positive, with substantial potential for market expansion.
Hockey Market Segmentation
-
1. Product Type
- 1.1. Hockey Sticks and Balls
- 1.2. Field Hockey Shoes
-
1.3. Protective Gear and Accessories
- 1.3.1. Pads
- 1.3.2. Helmets
- 1.3.3. Other Protective Gears and Accessories
-
2. Distribution Channel
- 2.1. Offline Retail Stores
- 2.2. Online Retail Stores
Hockey Market Segmentation By Geography
-
1. North America
- 1.1. United States
- 1.2. Canada
- 1.3. Mexico
- 1.4. Rest of North America
-
2. Europe
- 2.1. Spain
- 2.2. United Kingdom
- 2.3. Germany
- 2.4. France
- 2.5. Italy
- 2.6. Russia
- 2.7. Rest of Europe
-
3. Asia Pacific
- 3.1. China
- 3.2. Japan
- 3.3. India
- 3.4. Australia
- 3.5. Rest of Asia Pacific
-
4. South America
- 4.1. Brazil
- 4.2. Argentina
- 4.3. Rest of South America
-
5. Middle East and Africa
- 5.1. South Africa
- 5.2. United Arab Emirates
- 5.3. Rest of Middle East and Africa
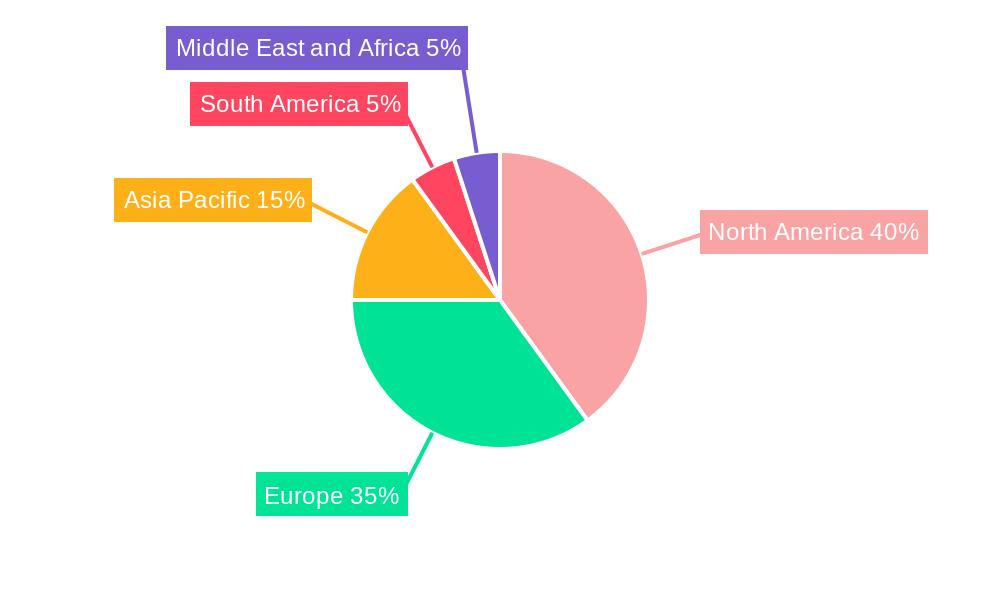
Hockey Market Regional Market Share
Geographic Coverage of Hockey Market
Hockey Market REPORT HIGHLIGHTS
| Aspects | Details |
|---|---|
| Study Period | 2020-2034 |
| Base Year | 2025 |
| Estimated Year | 2026 |
| Forecast Period | 2026-2034 |
| Historical Period | 2020-2025 |
| Growth Rate | CAGR of 7.5% from 2020-2034 |
| Segmentation |
|
Table of Contents
- 1. Introduction
- 1.1. Research Scope
- 1.2. Market Segmentation
- 1.3. Research Objective
- 1.4. Definitions and Assumptions
- 2. Executive Summary
- 2.1. Market Snapshot
- 3. Market Dynamics
- 3.1. Market Drivers
- 3.2. Market Restrains
- 3.3. Market Trends
- 3.4. Market Opportunities
- 4. Market Factor Analysis
- 4.1. Porters Five Forces
- 4.1.1. Bargaining Power of Suppliers
- 4.1.2. Bargaining Power of Buyers
- 4.1.3. Threat of New Entrants
- 4.1.4. Threat of Substitutes
- 4.1.5. Competitive Rivalry
- 4.2. PESTEL analysis
- 4.3. BCG Analysis
- 4.3.1. Stars (High Growth, High Market Share)
- 4.3.2. Cash Cows (Low Growth, High Market Share)
- 4.3.3. Question Mark (High Growth, Low Market Share)
- 4.3.4. Dogs (Low Growth, Low Market Share)
- 4.4. Ansoff Matrix Analysis
- 4.5. Supply Chain Analysis
- 4.6. Regulatory Landscape
- 4.7. Current Market Potential and Opportunity Assessment (TAM–SAM–SOM Framework)
- 4.8. TIR Analyst Note
- 4.1. Porters Five Forces
- 5. Market Analysis, Insights and Forecast 2021-2033
- 5.1. Market Analysis, Insights and Forecast - by Product Type
- 5.1.1. Hockey Sticks and Balls
- 5.1.2. Field Hockey Shoes
- 5.1.3. Protective Gear and Accessories
- 5.1.3.1. Pads
- 5.1.3.2. Helmets
- 5.1.3.3. Other Protective Gears and Accessories
- 5.2. Market Analysis, Insights and Forecast - by Distribution Channel
- 5.2.1. Offline Retail Stores
- 5.2.2. Online Retail Stores
- 5.3. Market Analysis, Insights and Forecast - by Region
- 5.3.1. North America
- 5.3.2. Europe
- 5.3.3. Asia Pacific
- 5.3.4. South America
- 5.3.5. Middle East and Africa
- 5.1. Market Analysis, Insights and Forecast - by Product Type
- 6. Global Hockey Market Analysis, Insights and Forecast, 2021-2033
- 6.1. Market Analysis, Insights and Forecast - by Product Type
- 6.1.1. Hockey Sticks and Balls
- 6.1.2. Field Hockey Shoes
- 6.1.3. Protective Gear and Accessories
- 6.1.3.1. Pads
- 6.1.3.2. Helmets
- 6.1.3.3. Other Protective Gears and Accessories
- 6.2. Market Analysis, Insights and Forecast - by Distribution Channel
- 6.2.1. Offline Retail Stores
- 6.2.2. Online Retail Stores
- 6.1. Market Analysis, Insights and Forecast - by Product Type
- 7. North America Hockey Market Analysis, Insights and Forecast, 2020-2032
- 7.1. Market Analysis, Insights and Forecast - by Product Type
- 7.1.1. Hockey Sticks and Balls
- 7.1.2. Field Hockey Shoes
- 7.1.3. Protective Gear and Accessories
- 7.1.3.1. Pads
- 7.1.3.2. Helmets
- 7.1.3.3. Other Protective Gears and Accessories
- 7.2. Market Analysis, Insights and Forecast - by Distribution Channel
- 7.2.1. Offline Retail Stores
- 7.2.2. Online Retail Stores
- 7.1. Market Analysis, Insights and Forecast - by Product Type
- 8. Europe Hockey Market Analysis, Insights and Forecast, 2020-2032
- 8.1. Market Analysis, Insights and Forecast - by Product Type
- 8.1.1. Hockey Sticks and Balls
- 8.1.2. Field Hockey Shoes
- 8.1.3. Protective Gear and Accessories
- 8.1.3.1. Pads
- 8.1.3.2. Helmets
- 8.1.3.3. Other Protective Gears and Accessories
- 8.2. Market Analysis, Insights and Forecast - by Distribution Channel
- 8.2.1. Offline Retail Stores
- 8.2.2. Online Retail Stores
- 8.1. Market Analysis, Insights and Forecast - by Product Type
- 9. Asia Pacific Hockey Market Analysis, Insights and Forecast, 2020-2032
- 9.1. Market Analysis, Insights and Forecast - by Product Type
- 9.1.1. Hockey Sticks and Balls
- 9.1.2. Field Hockey Shoes
- 9.1.3. Protective Gear and Accessories
- 9.1.3.1. Pads
- 9.1.3.2. Helmets
- 9.1.3.3. Other Protective Gears and Accessories
- 9.2. Market Analysis, Insights and Forecast - by Distribution Channel
- 9.2.1. Offline Retail Stores
- 9.2.2. Online Retail Stores
- 9.1. Market Analysis, Insights and Forecast - by Product Type
- 10. South America Hockey Market Analysis, Insights and Forecast, 2020-2032
- 10.1. Market Analysis, Insights and Forecast - by Product Type
- 10.1.1. Hockey Sticks and Balls
- 10.1.2. Field Hockey Shoes
- 10.1.3. Protective Gear and Accessories
- 10.1.3.1. Pads
- 10.1.3.2. Helmets
- 10.1.3.3. Other Protective Gears and Accessories
- 10.2. Market Analysis, Insights and Forecast - by Distribution Channel
- 10.2.1. Offline Retail Stores
- 10.2.2. Online Retail Stores
- 10.1. Market Analysis, Insights and Forecast - by Product Type
- 11. Middle East and Africa Hockey Market Analysis, Insights and Forecast, 2020-2032
- 11.1. Market Analysis, Insights and Forecast - by Product Type
- 11.1.1. Hockey Sticks and Balls
- 11.1.2. Field Hockey Shoes
- 11.1.3. Protective Gear and Accessories
- 11.1.3.1. Pads
- 11.1.3.2. Helmets
- 11.1.3.3. Other Protective Gears and Accessories
- 11.2. Market Analysis, Insights and Forecast - by Distribution Channel
- 11.2.1. Offline Retail Stores
- 11.2.2. Online Retail Stores
- 11.1. Market Analysis, Insights and Forecast - by Product Type
- 12. Competitive Analysis
- 12.1. Company Profiles
- 12.1.1 Ritual Hockey
- 12.1.1.1. Company Overview
- 12.1.1.2. Products
- 12.1.1.3. Company Financials
- 12.1.1.4. SWOT Analysis
- 12.1.2 Adidas AG
- 12.1.2.1. Company Overview
- 12.1.2.2. Products
- 12.1.2.3. Company Financials
- 12.1.2.4. SWOT Analysis
- 12.1.3 Brabo Hockey
- 12.1.3.1. Company Overview
- 12.1.3.2. Products
- 12.1.3.3. Company Financials
- 12.1.3.4. SWOT Analysis
- 12.1.4 Atlas Hockey
- 12.1.4.1. Company Overview
- 12.1.4.2. Products
- 12.1.4.3. Company Financials
- 12.1.4.4. SWOT Analysis
- 12.1.5 Mazon Hockey
- 12.1.5.1. Company Overview
- 12.1.5.2. Products
- 12.1.5.3. Company Financials
- 12.1.5.4. SWOT Analysis
- 12.1.6 Dita Hockey
- 12.1.6.1. Company Overview
- 12.1.6.2. Products
- 12.1.6.3. Company Financials
- 12.1.6.4. SWOT Analysis
- 12.1.7 Grays of Cambridge (International) Ltd
- 12.1.7.1. Company Overview
- 12.1.7.2. Products
- 12.1.7.3. Company Financials
- 12.1.7.4. SWOT Analysis
- 12.1.8 Osaka World
- 12.1.8.1. Company Overview
- 12.1.8.2. Products
- 12.1.8.3. Company Financials
- 12.1.8.4. SWOT Analysis
- 12.1.9 Gryphon Hockey Ltd
- 12.1.9.1. Company Overview
- 12.1.9.2. Products
- 12.1.9.3. Company Financials
- 12.1.9.4. SWOT Analysis
- 12.1.10 STX*List Not Exhaustive
- 12.1.10.1. Company Overview
- 12.1.10.2. Products
- 12.1.10.3. Company Financials
- 12.1.10.4. SWOT Analysis
- 12.1.11 OBO
- 12.1.11.1. Company Overview
- 12.1.11.2. Products
- 12.1.11.3. Company Financials
- 12.1.11.4. SWOT Analysis
- 12.1.12 Princess Sportsgear
- 12.1.12.1. Company Overview
- 12.1.12.2. Products
- 12.1.12.3. Company Financials
- 12.1.12.4. SWOT Analysis
- 12.1.1 Ritual Hockey
- 12.2. Market Entropy
- 12.2.1 Company's Key Areas Served
- 12.2.2 Recent Developments
- 12.3. Company Market Share Analysis 2025
- 12.3.1 Top 5 Companies Market Share Analysis
- 12.3.2 Top 3 Companies Market Share Analysis
- 12.4. List of Potential Customers
- 13. Research Methodology
List of Figures
- Figure 1: Global Hockey Market Revenue Breakdown (billion, %) by Region 2025 & 2033
- Figure 2: North America Hockey Market Revenue (billion), by Product Type 2025 & 2033
- Figure 3: North America Hockey Market Revenue Share (%), by Product Type 2025 & 2033
- Figure 4: North America Hockey Market Revenue (billion), by Distribution Channel 2025 & 2033
- Figure 5: North America Hockey Market Revenue Share (%), by Distribution Channel 2025 & 2033
- Figure 6: North America Hockey Market Revenue (billion), by Country 2025 & 2033
- Figure 7: North America Hockey Market Revenue Share (%), by Country 2025 & 2033
- Figure 8: Europe Hockey Market Revenue (billion), by Product Type 2025 & 2033
- Figure 9: Europe Hockey Market Revenue Share (%), by Product Type 2025 & 2033
- Figure 10: Europe Hockey Market Revenue (billion), by Distribution Channel 2025 & 2033
- Figure 11: Europe Hockey Market Revenue Share (%), by Distribution Channel 2025 & 2033
- Figure 12: Europe Hockey Market Revenue (billion), by Country 2025 & 2033
- Figure 13: Europe Hockey Market Revenue Share (%), by Country 2025 & 2033
- Figure 14: Asia Pacific Hockey Market Revenue (billion), by Product Type 2025 & 2033
- Figure 15: Asia Pacific Hockey Market Revenue Share (%), by Product Type 2025 & 2033
- Figure 16: Asia Pacific Hockey Market Revenue (billion), by Distribution Channel 2025 & 2033
- Figure 17: Asia Pacific Hockey Market Revenue Share (%), by Distribution Channel 2025 & 2033
- Figure 18: Asia Pacific Hockey Market Revenue (billion), by Country 2025 & 2033
- Figure 19: Asia Pacific Hockey Market Revenue Share (%), by Country 2025 & 2033
- Figure 20: South America Hockey Market Revenue (billion), by Product Type 2025 & 2033
- Figure 21: South America Hockey Market Revenue Share (%), by Product Type 2025 & 2033
- Figure 22: South America Hockey Market Revenue (billion), by Distribution Channel 2025 & 2033
- Figure 23: South America Hockey Market Revenue Share (%), by Distribution Channel 2025 & 2033
- Figure 24: South America Hockey Market Revenue (billion), by Country 2025 & 2033
- Figure 25: South America Hockey Market Revenue Share (%), by Country 2025 & 2033
- Figure 26: Middle East and Africa Hockey Market Revenue (billion), by Product Type 2025 & 2033
- Figure 27: Middle East and Africa Hockey Market Revenue Share (%), by Product Type 2025 & 2033
- Figure 28: Middle East and Africa Hockey Market Revenue (billion), by Distribution Channel 2025 & 2033
- Figure 29: Middle East and Africa Hockey Market Revenue Share (%), by Distribution Channel 2025 & 2033
- Figure 30: Middle East and Africa Hockey Market Revenue (billion), by Country 2025 & 2033
- Figure 31: Middle East and Africa Hockey Market Revenue Share (%), by Country 2025 & 2033
List of Tables
- Table 1: Global Hockey Market Revenue billion Forecast, by Product Type 2020 & 2033
- Table 2: Global Hockey Market Revenue billion Forecast, by Distribution Channel 2020 & 2033
- Table 3: Global Hockey Market Revenue billion Forecast, by Region 2020 & 2033
- Table 4: Global Hockey Market Revenue billion Forecast, by Product Type 2020 & 2033
- Table 5: Global Hockey Market Revenue billion Forecast, by Distribution Channel 2020 & 2033
- Table 6: Global Hockey Market Revenue billion Forecast, by Country 2020 & 2033
- Table 7: United States Hockey Market Revenue (billion) Forecast, by Application 2020 & 2033
- Table 8: Canada Hockey Market Revenue (billion) Forecast, by Application 2020 & 2033
- Table 9: Mexico Hockey Market Revenue (billion) Forecast, by Application 2020 & 2033
- Table 10: Rest of North America Hockey Market Revenue (billion) Forecast, by Application 2020 & 2033
- Table 11: Global Hockey Market Revenue billion Forecast, by Product Type 2020 & 2033
- Table 12: Global Hockey Market Revenue billion Forecast, by Distribution Channel 2020 & 2033
- Table 13: Global Hockey Market Revenue billion Forecast, by Country 2020 & 2033
- Table 14: Spain Hockey Market Revenue (billion) Forecast, by Application 2020 & 2033
- Table 15: United Kingdom Hockey Market Revenue (billion) Forecast, by Application 2020 & 2033
- Table 16: Germany Hockey Market Revenue (billion) Forecast, by Application 2020 & 2033
- Table 17: France Hockey Market Revenue (billion) Forecast, by Application 2020 & 2033
- Table 18: Italy Hockey Market Revenue (billion) Forecast, by Application 2020 & 2033
- Table 19: Russia Hockey Market Revenue (billion) Forecast, by Application 2020 & 2033
- Table 20: Rest of Europe Hockey Market Revenue (billion) Forecast, by Application 2020 & 2033
- Table 21: Global Hockey Market Revenue billion Forecast, by Product Type 2020 & 2033
- Table 22: Global Hockey Market Revenue billion Forecast, by Distribution Channel 2020 & 2033
- Table 23: Global Hockey Market Revenue billion Forecast, by Country 2020 & 2033
- Table 24: China Hockey Market Revenue (billion) Forecast, by Application 2020 & 2033
- Table 25: Japan Hockey Market Revenue (billion) Forecast, by Application 2020 & 2033
- Table 26: India Hockey Market Revenue (billion) Forecast, by Application 2020 & 2033
- Table 27: Australia Hockey Market Revenue (billion) Forecast, by Application 2020 & 2033
- Table 28: Rest of Asia Pacific Hockey Market Revenue (billion) Forecast, by Application 2020 & 2033
- Table 29: Global Hockey Market Revenue billion Forecast, by Product Type 2020 & 2033
- Table 30: Global Hockey Market Revenue billion Forecast, by Distribution Channel 2020 & 2033
- Table 31: Global Hockey Market Revenue billion Forecast, by Country 2020 & 2033
- Table 32: Brazil Hockey Market Revenue (billion) Forecast, by Application 2020 & 2033
- Table 33: Argentina Hockey Market Revenue (billion) Forecast, by Application 2020 & 2033
- Table 34: Rest of South America Hockey Market Revenue (billion) Forecast, by Application 2020 & 2033
- Table 35: Global Hockey Market Revenue billion Forecast, by Product Type 2020 & 2033
- Table 36: Global Hockey Market Revenue billion Forecast, by Distribution Channel 2020 & 2033
- Table 37: Global Hockey Market Revenue billion Forecast, by Country 2020 & 2033
- Table 38: South Africa Hockey Market Revenue (billion) Forecast, by Application 2020 & 2033
- Table 39: United Arab Emirates Hockey Market Revenue (billion) Forecast, by Application 2020 & 2033
- Table 40: Rest of Middle East and Africa Hockey Market Revenue (billion) Forecast, by Application 2020 & 2033
Frequently Asked Questions
1. What is the projected Compound Annual Growth Rate (CAGR) of the Hockey Market?
The projected CAGR is approximately 7.5%.
2. Which companies are prominent players in the Hockey Market?
Key companies in the market include Ritual Hockey, Adidas AG, Brabo Hockey, Atlas Hockey, Mazon Hockey, Dita Hockey, Grays of Cambridge (International) Ltd, Osaka World, Gryphon Hockey Ltd, STX*List Not Exhaustive, OBO, Princess Sportsgear.
3. What are the main segments of the Hockey Market?
The market segments include Product Type, Distribution Channel.
4. Can you provide details about the market size?
The market size is estimated to be USD 9.5 billion as of 2022.
5. What are some drivers contributing to market growth?
Increase in Sports Participation; Trend of Athleisure.
6. What are the notable trends driving market growth?
Rising Interest and Participation Rate in Field Hockey.
7. Are there any restraints impacting market growth?
Availability of Fake and Counterfeit Products.
8. Can you provide examples of recent developments in the market?
June 2021: USA Field Hockey officially launched the USA Field Hockey Equipment store, an online store that provides entry-level and modified equipment packages to make field hockey more accessible and affordable.
9. What pricing options are available for accessing the report?
Pricing options include single-user, multi-user, and enterprise licenses priced at USD 4750, USD 5250, and USD 8750 respectively.
10. Is the market size provided in terms of value or volume?
The market size is provided in terms of value, measured in billion.
11. Are there any specific market keywords associated with the report?
Yes, the market keyword associated with the report is "Hockey Market," which aids in identifying and referencing the specific market segment covered.
12. How do I determine which pricing option suits my needs best?
The pricing options vary based on user requirements and access needs. Individual users may opt for single-user licenses, while businesses requiring broader access may choose multi-user or enterprise licenses for cost-effective access to the report.
13. Are there any additional resources or data provided in the Hockey Market report?
While the report offers comprehensive insights, it's advisable to review the specific contents or supplementary materials provided to ascertain if additional resources or data are available.
14. How can I stay updated on further developments or reports in the Hockey Market?
To stay informed about further developments, trends, and reports in the Hockey Market, consider subscribing to industry newsletters, following relevant companies and organizations, or regularly checking reputable industry news sources and publications.
Methodology
Step 1 - Identification of Relevant Samples Size from Population Database


Step 2 - Approaches for Defining Global Market Size (Value, Volume* & Price*)

Note*: In applicable scenarios
Step 3 - Data Sources
Primary Research
- Web Analytics
- Survey Reports
- Research Institute
- Latest Research Reports
- Opinion Leaders
Secondary Research
- Annual Reports
- White Paper
- Latest Press Release
- Industry Association
- Paid Database
- Investor Presentations

Step 4 - Data Triangulation
Involves using different sources of information in order to increase the validity of a study
These sources are likely to be stakeholders in a program - participants, other researchers, program staff, other community members, and so on.
Then we put all data in single framework & apply various statistical tools to find out the dynamic on the market.
During the analysis stage, feedback from the stakeholder groups would be compared to determine areas of agreement as well as areas of divergence