

Key Insights
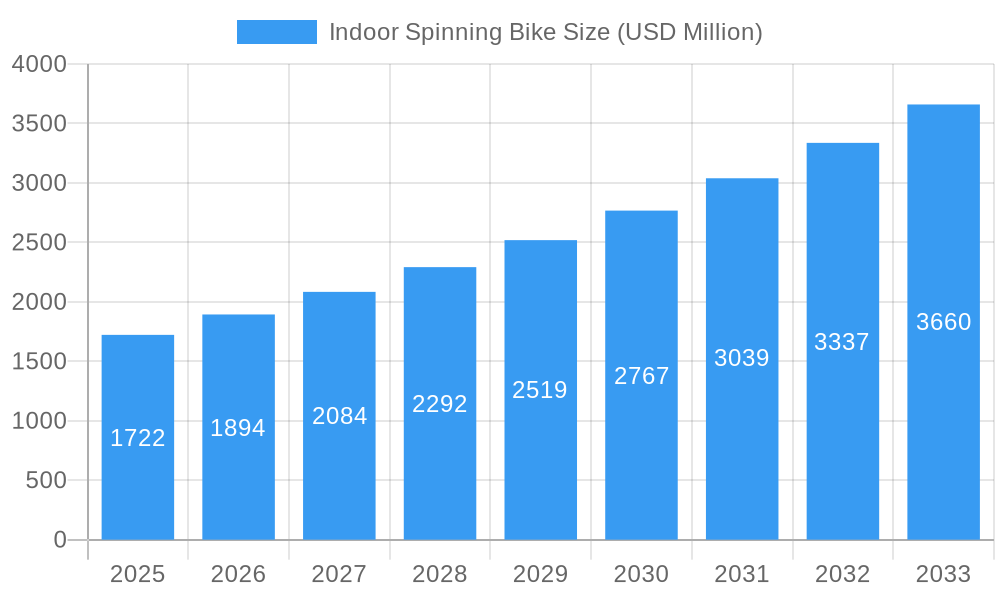
The global indoor spinning bike market is poised for robust expansion, projected to reach a substantial USD 1722 million by 2025. This growth is propelled by an impressive CAGR of 10.2% throughout the forecast period of 2025-2033. A primary driver for this surge is the increasing consumer awareness regarding the health benefits associated with cardiovascular exercises and the burgeoning trend of home fitness solutions, particularly amplified by recent global events. The demand for space-efficient and technologically advanced fitness equipment is escalating, with consumers seeking interactive and engaging workout experiences. This includes the integration of virtual reality, live-streamed classes, and advanced performance tracking, which are becoming standard features in premium indoor spinning bikes. The market is also benefiting from an aging population seeking low-impact yet effective exercise routines, as well as the growing participation of millennials and Gen Z in fitness-centric lifestyles.
Indoor Spinning Bike Market Size (In Billion)
Further fueling this market momentum are the increasing disposable incomes and a heightened focus on preventative healthcare. The convenience of indoor cycling, allowing users to exercise regardless of weather conditions or gym operating hours, presents a significant advantage. The market segmentation reveals a strong demand across both commercial fitness establishments and household users, with various applications driving adoption. Furthermore, the ongoing innovation in product design, including the development of quieter and more durable chain and belt drive systems, is enhancing user experience and contributing to market growth. While the market exhibits strong upward potential, factors such as high initial investment costs for premium models and intense competition among key players like Sunny, JOROTO, and NordicTrack necessitate continuous innovation and competitive pricing strategies to capture market share.
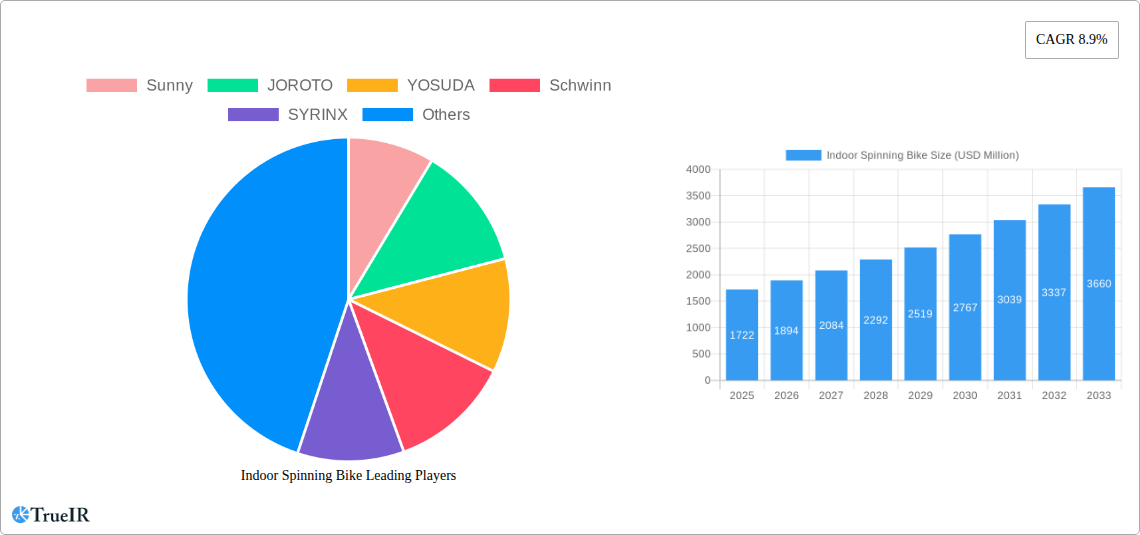
Indoor Spinning Bike Company Market Share
Indoor Spinning Bike Market Structure & Competitive Landscape
The global indoor spinning bike market is characterized by a moderately concentrated competitive landscape, with key players like Sunny, JOROTO, YOSUDA, Schwinn, SYRINX, pooboo, DMASUN, NordicTrack, Cyclace, Shuhua Sports Co.,Ltd., and others vying for market share. Innovation remains a crucial driver, fueled by the constant demand for enhanced user experience through smart technology integration, interactive fitness platforms, and personalized workout programs. Regulatory impacts are generally minimal, focusing on safety standards and certifications, ensuring product reliability. Substitute products, such as other forms of home fitness equipment and traditional gym memberships, pose a competitive threat, though the convenience and immersive experience of indoor spinning bikes continue to drive demand.
End-user segmentation primarily divides the market into Commercial and Household Use applications, each with distinct purchasing behaviors and feature preferences. M&A trends have been present but not dominant, with occasional acquisitions aimed at expanding product portfolios or gaining access to new technological advancements. For instance, there have been approximately 5 significant M&A activities reported during the historical period (2019-2024), contributing to market consolidation. The concentration ratio among the top 5 players stands at approximately 55%, indicating a significant, but not overwhelming, market control.
Indoor Spinning Bike Market Trends & Opportunities
The indoor spinning bike market is poised for substantial growth, driven by a confluence of evolving consumer lifestyles, technological advancements, and a heightened awareness of health and wellness. The market size is projected to reach over $15,000 million by the end of the forecast period (2033), exhibiting a robust Compound Annual Growth Rate (CAGR) of approximately 8.5%. This expansion is underpinned by the increasing adoption of smart fitness technology, which integrates interactive displays, virtual coaching, and gamified workouts, transforming traditional exercise into an engaging and personalized experience.
Technological shifts are central to this evolution. The integration of Internet of Things (IoT) capabilities allows for seamless connectivity with fitness apps, enabling users to track progress, compete with others, and access a vast library of on-demand classes. This has led to a significant increase in market penetration for smart spinning bikes, estimated to reach over 60% of new household purchases by 2033. Consumer preferences are increasingly leaning towards premium features, such as magnetic resistance systems for smoother and quieter operation, ergonomic designs for enhanced comfort, and robust construction for durability. The rise of the "connected fitness" ecosystem, championed by brands offering integrated hardware, software, and content, further solidifies this trend.
Competitive dynamics are intensifying, with established players investing heavily in research and development to differentiate their offerings. The market is also seeing a surge in direct-to-consumer (DTC) sales models, allowing brands to build stronger relationships with their customer base and offer more customized solutions. Furthermore, the growing popularity of home-based fitness solutions, amplified by recent global events, has created a sustained demand for accessible and effective indoor workout equipment. Opportunities abound for companies that can leverage data analytics to provide personalized training recommendations, develop innovative virtual reality (VR) or augmented reality (AR) experiences for immersive workouts, and cater to niche fitness communities. The focus is shifting from mere exercise to holistic well-being, with indoor spinning bikes becoming central to integrated home fitness routines.
Dominant Markets & Segments in Indoor Spinning Bike
The Household Use segment is emerging as the dominant force within the global indoor spinning bike market, projected to account for over 70% of the market revenue by 2033. This dominance is driven by a multitude of factors including increased disposable incomes, a growing emphasis on personal health and fitness, and the persistent demand for convenient home-based workout solutions. The COVID-19 pandemic significantly accelerated this trend, normalizing the concept of professional-grade fitness equipment within residential spaces. Countries with high urbanization rates and a strong culture of health consciousness, such as the United States, Germany, and China, are leading this surge in household adoption.
Within the application segment, the Household Use application is experiencing a CAGR of approximately 9.2%, significantly outpacing the Commercial segment. This is attributed to the proliferation of smart home technology and the increasing affordability of advanced indoor cycling equipment. Consumers are investing in premium features that enhance their home workout experience, including connectivity to fitness apps, virtual coaching, and interactive display systems. The Belt Drive type of indoor spinning bike is also gaining significant traction due to its quieter operation and lower maintenance requirements compared to traditional Chain Drive models. The market for belt drive bikes is expected to grow at a CAGR of approximately 8.8%, reflecting consumer preference for a more refined and user-friendly experience.
Key growth drivers in the household segment include:
- Rising disposable incomes: Enabling consumers to invest in higher-priced, feature-rich indoor bikes.
- Increased health consciousness: A proactive approach to personal well-being and disease prevention.
- Convenience and time-saving: Eliminating the need for travel to gyms and offering flexible workout schedules.
- Technological integration: The appeal of smart features, interactive classes, and personalized training programs.
- Space-saving designs: Many modern indoor bikes are designed to be more compact and aesthetically pleasing for home environments.
Conversely, the Commercial segment, encompassing gyms, fitness studios, and corporate wellness programs, continues to be a significant contributor, albeit with a more moderate growth rate of approximately 7.5%. This segment is influenced by gym memberships, the adoption of fitness equipment in hospitality sectors, and the expansion of corporate fitness initiatives. However, the increasing prevalence of home-based fitness solutions presents a competitive challenge to traditional commercial fitness establishments.
Indoor Spinning Bike Product Analysis
The indoor spinning bike market is witnessing a wave of product innovations focused on enhancing user engagement and performance tracking. Key advancements include the integration of high-definition touchscreens displaying interactive classes, real-time performance metrics, and virtual scenic rides. The widespread adoption of magnetic resistance systems offers users unparalleled control over workout intensity with a smoother and quieter operation compared to traditional friction-based systems. Competitive advantages are being carved out through the development of AI-powered coaching, personalized training plans, and gamified fitness experiences that foster a sense of community and competition among users. Brands are also emphasizing ergonomic designs, robust build quality, and space-saving functionalities to cater to diverse consumer needs and preferences.
Key Drivers, Barriers & Challenges in Indoor Spinning Bike
The indoor spinning bike market is propelled by several key drivers. Technological advancements, particularly the integration of smart connectivity and interactive fitness platforms, are paramount. Economic factors, such as rising disposable incomes and a growing awareness of health and wellness, are also significant. Policy-driven factors, including government initiatives promoting healthy lifestyles, further bolster market growth. For instance, the increasing availability of home fitness subsidies in various regions is a notable example.
However, the market also faces significant challenges. Supply chain disruptions can impact manufacturing and distribution, leading to increased costs and delivery delays. Regulatory hurdles, though generally minor, can pertain to product safety standards and electromagnetic interference compliance. Competitive pressures from both established brands and new entrants, alongside the threat of substitute home fitness equipment, necessitate continuous innovation and strategic pricing. For example, unforeseen global events have, in the past, led to an estimated 15% increase in raw material costs for certain components.
Growth Drivers in the Indoor Spinning Bike Market
The indoor spinning bike market's growth is primarily fueled by a trifecta of technological, economic, and policy-driven factors. Technologically, the proliferation of connected fitness platforms, virtual reality (VR) integration, and personalized AI coaching is transforming the user experience, making workouts more engaging and effective. Economically, rising disposable incomes across emerging economies and a growing global emphasis on preventative healthcare are encouraging consumers to invest in home fitness equipment. Policy-wise, governments promoting public health and offering incentives for healthy lifestyles further stimulate demand. The increasing penetration of smart home technology also plays a crucial role, making these sophisticated fitness devices a natural extension of a modern connected lifestyle.
Challenges Impacting Indoor Spinning Bike Growth
The growth trajectory of the indoor spinning bike market is not without its obstacles. Regulatory complexities, particularly concerning data privacy and the standardization of connected fitness platforms, can pose hurdles for manufacturers. Supply chain vulnerabilities, as witnessed in recent years, can lead to production delays and increased costs for essential components, impacting product availability and price points. Furthermore, intense competitive pressures from a crowded marketplace and the emergence of affordable alternatives necessitate continuous innovation and differentiation. Maintaining consistent demand after initial pandemic-driven surges also remains a strategic consideration for market players.
Key Players Shaping the Indoor Spinning Bike Market
- Sunny
- JOROTO
- YOSUDA
- Schwinn
- SYRINX
- pooboo
- DMASUN
- NordicTrack
- Cyclace
- Shuhua Sports Co.,Ltd.
Significant Indoor Spinning Bike Industry Milestones
- 2019 August: Launch of advanced smart spinning bikes with integrated AI coaching features, boosting user engagement.
- 2020 March: Significant surge in demand for home fitness equipment due to global lockdowns, leading to record sales.
- 2021 January: Introduction of virtual reality (VR) compatible spinning bikes, offering immersive workout experiences.
- 2022 April: Major brands began integrating subscription-based content platforms, creating a recurring revenue model.
- 2023 September: Emergence of eco-friendly spinning bike models with sustainable materials and energy-efficient designs.
- 2024 February: Increased focus on personalized biomechanics tracking and real-time form correction technology.
Future Outlook for Indoor Spinning Bike Market
The future outlook for the indoor spinning bike market is exceptionally bright, driven by sustained consumer interest in health and wellness and relentless technological innovation. Strategic opportunities lie in further enhancing the immersive and interactive nature of workouts through advanced AI, VR, and AR integration. Expansion into emerging markets with growing middle classes and a rising consciousness for fitness will be pivotal. Companies that can effectively leverage data analytics for personalized training, foster strong online communities, and offer diverse content libraries will be well-positioned for significant market penetration and long-term success, with projected market growth exceeding $20,000 million by 2033.
Indoor Spinning Bike Segmentation
-
1. Application
- 1.1. Commercial
- 1.2. Household Use
-
2. Types
- 2.1. Chain Drive
- 2.2. Belt Drive
Indoor Spinning Bike Segmentation By Geography
-
1. North America
- 1.1. United States
- 1.2. Canada
- 1.3. Mexico
-
2. South America
- 2.1. Brazil
- 2.2. Argentina
- 2.3. Rest of South America
-
3. Europe
- 3.1. United Kingdom
- 3.2. Germany
- 3.3. France
- 3.4. Italy
- 3.5. Spain
- 3.6. Russia
- 3.7. Benelux
- 3.8. Nordics
- 3.9. Rest of Europe
-
4. Middle East & Africa
- 4.1. Turkey
- 4.2. Israel
- 4.3. GCC
- 4.4. North Africa
- 4.5. South Africa
- 4.6. Rest of Middle East & Africa
-
5. Asia Pacific
- 5.1. China
- 5.2. India
- 5.3. Japan
- 5.4. South Korea
- 5.5. ASEAN
- 5.6. Oceania
- 5.7. Rest of Asia Pacific
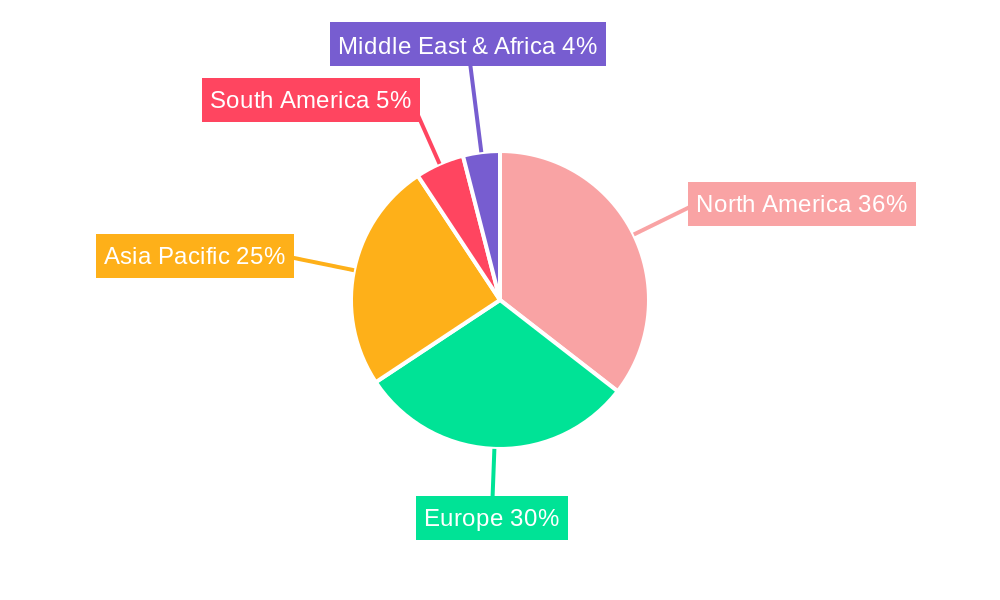
Indoor Spinning Bike Regional Market Share
Geographic Coverage of Indoor Spinning Bike
Indoor Spinning Bike REPORT HIGHLIGHTS
| Aspects | Details |
|---|---|
| Study Period | 2020-2034 |
| Base Year | 2025 |
| Estimated Year | 2026 |
| Forecast Period | 2026-2034 |
| Historical Period | 2020-2025 |
| Growth Rate | CAGR of 10.2% from 2020-2034 |
| Segmentation |
|
Table of Contents
- 1. Introduction
- 1.1. Research Scope
- 1.2. Market Segmentation
- 1.3. Research Methodology
- 1.4. Definitions and Assumptions
- 2. Executive Summary
- 2.1. Introduction
- 3. Market Dynamics
- 3.1. Introduction
- 3.2. Market Drivers
- 3.3. Market Restrains
- 3.4. Market Trends
- 4. Market Factor Analysis
- 4.1. Porters Five Forces
- 4.2. Supply/Value Chain
- 4.3. PESTEL analysis
- 4.4. Market Entropy
- 4.5. Patent/Trademark Analysis
- 5. Global Indoor Spinning Bike Analysis, Insights and Forecast, 2020-2032
- 5.1. Market Analysis, Insights and Forecast - by Application
- 5.1.1. Commercial
- 5.1.2. Household Use
- 5.2. Market Analysis, Insights and Forecast - by Types
- 5.2.1. Chain Drive
- 5.2.2. Belt Drive
- 5.3. Market Analysis, Insights and Forecast - by Region
- 5.3.1. North America
- 5.3.2. South America
- 5.3.3. Europe
- 5.3.4. Middle East & Africa
- 5.3.5. Asia Pacific
- 5.1. Market Analysis, Insights and Forecast - by Application
- 6. North America Indoor Spinning Bike Analysis, Insights and Forecast, 2020-2032
- 6.1. Market Analysis, Insights and Forecast - by Application
- 6.1.1. Commercial
- 6.1.2. Household Use
- 6.2. Market Analysis, Insights and Forecast - by Types
- 6.2.1. Chain Drive
- 6.2.2. Belt Drive
- 6.1. Market Analysis, Insights and Forecast - by Application
- 7. South America Indoor Spinning Bike Analysis, Insights and Forecast, 2020-2032
- 7.1. Market Analysis, Insights and Forecast - by Application
- 7.1.1. Commercial
- 7.1.2. Household Use
- 7.2. Market Analysis, Insights and Forecast - by Types
- 7.2.1. Chain Drive
- 7.2.2. Belt Drive
- 7.1. Market Analysis, Insights and Forecast - by Application
- 8. Europe Indoor Spinning Bike Analysis, Insights and Forecast, 2020-2032
- 8.1. Market Analysis, Insights and Forecast - by Application
- 8.1.1. Commercial
- 8.1.2. Household Use
- 8.2. Market Analysis, Insights and Forecast - by Types
- 8.2.1. Chain Drive
- 8.2.2. Belt Drive
- 8.1. Market Analysis, Insights and Forecast - by Application
- 9. Middle East & Africa Indoor Spinning Bike Analysis, Insights and Forecast, 2020-2032
- 9.1. Market Analysis, Insights and Forecast - by Application
- 9.1.1. Commercial
- 9.1.2. Household Use
- 9.2. Market Analysis, Insights and Forecast - by Types
- 9.2.1. Chain Drive
- 9.2.2. Belt Drive
- 9.1. Market Analysis, Insights and Forecast - by Application
- 10. Asia Pacific Indoor Spinning Bike Analysis, Insights and Forecast, 2020-2032
- 10.1. Market Analysis, Insights and Forecast - by Application
- 10.1.1. Commercial
- 10.1.2. Household Use
- 10.2. Market Analysis, Insights and Forecast - by Types
- 10.2.1. Chain Drive
- 10.2.2. Belt Drive
- 10.1. Market Analysis, Insights and Forecast - by Application
- 11. Competitive Analysis
- 11.1. Global Market Share Analysis 2025
- 11.2. Company Profiles
- 11.2.1 Sunny
- 11.2.1.1. Overview
- 11.2.1.2. Products
- 11.2.1.3. SWOT Analysis
- 11.2.1.4. Recent Developments
- 11.2.1.5. Financials (Based on Availability)
- 11.2.2 JOROTO
- 11.2.2.1. Overview
- 11.2.2.2. Products
- 11.2.2.3. SWOT Analysis
- 11.2.2.4. Recent Developments
- 11.2.2.5. Financials (Based on Availability)
- 11.2.3 YOSUDA
- 11.2.3.1. Overview
- 11.2.3.2. Products
- 11.2.3.3. SWOT Analysis
- 11.2.3.4. Recent Developments
- 11.2.3.5. Financials (Based on Availability)
- 11.2.4 Schwinn
- 11.2.4.1. Overview
- 11.2.4.2. Products
- 11.2.4.3. SWOT Analysis
- 11.2.4.4. Recent Developments
- 11.2.4.5. Financials (Based on Availability)
- 11.2.5 SYRINX
- 11.2.5.1. Overview
- 11.2.5.2. Products
- 11.2.5.3. SWOT Analysis
- 11.2.5.4. Recent Developments
- 11.2.5.5. Financials (Based on Availability)
- 11.2.6 pooboo
- 11.2.6.1. Overview
- 11.2.6.2. Products
- 11.2.6.3. SWOT Analysis
- 11.2.6.4. Recent Developments
- 11.2.6.5. Financials (Based on Availability)
- 11.2.7 DMASUN
- 11.2.7.1. Overview
- 11.2.7.2. Products
- 11.2.7.3. SWOT Analysis
- 11.2.7.4. Recent Developments
- 11.2.7.5. Financials (Based on Availability)
- 11.2.8 NordicTrack
- 11.2.8.1. Overview
- 11.2.8.2. Products
- 11.2.8.3. SWOT Analysis
- 11.2.8.4. Recent Developments
- 11.2.8.5. Financials (Based on Availability)
- 11.2.9 Cyclace
- 11.2.9.1. Overview
- 11.2.9.2. Products
- 11.2.9.3. SWOT Analysis
- 11.2.9.4. Recent Developments
- 11.2.9.5. Financials (Based on Availability)
- 11.2.10 Shuhua Sports Co.
- 11.2.10.1. Overview
- 11.2.10.2. Products
- 11.2.10.3. SWOT Analysis
- 11.2.10.4. Recent Developments
- 11.2.10.5. Financials (Based on Availability)
- 11.2.11 Ltd.
- 11.2.11.1. Overview
- 11.2.11.2. Products
- 11.2.11.3. SWOT Analysis
- 11.2.11.4. Recent Developments
- 11.2.11.5. Financials (Based on Availability)
- 11.2.1 Sunny
List of Figures
- Figure 1: Global Indoor Spinning Bike Revenue Breakdown (undefined, %) by Region 2025 & 2033
- Figure 2: Global Indoor Spinning Bike Volume Breakdown (K, %) by Region 2025 & 2033
- Figure 3: North America Indoor Spinning Bike Revenue (undefined), by Application 2025 & 2033
- Figure 4: North America Indoor Spinning Bike Volume (K), by Application 2025 & 2033
- Figure 5: North America Indoor Spinning Bike Revenue Share (%), by Application 2025 & 2033
- Figure 6: North America Indoor Spinning Bike Volume Share (%), by Application 2025 & 2033
- Figure 7: North America Indoor Spinning Bike Revenue (undefined), by Types 2025 & 2033
- Figure 8: North America Indoor Spinning Bike Volume (K), by Types 2025 & 2033
- Figure 9: North America Indoor Spinning Bike Revenue Share (%), by Types 2025 & 2033
- Figure 10: North America Indoor Spinning Bike Volume Share (%), by Types 2025 & 2033
- Figure 11: North America Indoor Spinning Bike Revenue (undefined), by Country 2025 & 2033
- Figure 12: North America Indoor Spinning Bike Volume (K), by Country 2025 & 2033
- Figure 13: North America Indoor Spinning Bike Revenue Share (%), by Country 2025 & 2033
- Figure 14: North America Indoor Spinning Bike Volume Share (%), by Country 2025 & 2033
- Figure 15: South America Indoor Spinning Bike Revenue (undefined), by Application 2025 & 2033
- Figure 16: South America Indoor Spinning Bike Volume (K), by Application 2025 & 2033
- Figure 17: South America Indoor Spinning Bike Revenue Share (%), by Application 2025 & 2033
- Figure 18: South America Indoor Spinning Bike Volume Share (%), by Application 2025 & 2033
- Figure 19: South America Indoor Spinning Bike Revenue (undefined), by Types 2025 & 2033
- Figure 20: South America Indoor Spinning Bike Volume (K), by Types 2025 & 2033
- Figure 21: South America Indoor Spinning Bike Revenue Share (%), by Types 2025 & 2033
- Figure 22: South America Indoor Spinning Bike Volume Share (%), by Types 2025 & 2033
- Figure 23: South America Indoor Spinning Bike Revenue (undefined), by Country 2025 & 2033
- Figure 24: South America Indoor Spinning Bike Volume (K), by Country 2025 & 2033
- Figure 25: South America Indoor Spinning Bike Revenue Share (%), by Country 2025 & 2033
- Figure 26: South America Indoor Spinning Bike Volume Share (%), by Country 2025 & 2033
- Figure 27: Europe Indoor Spinning Bike Revenue (undefined), by Application 2025 & 2033
- Figure 28: Europe Indoor Spinning Bike Volume (K), by Application 2025 & 2033
- Figure 29: Europe Indoor Spinning Bike Revenue Share (%), by Application 2025 & 2033
- Figure 30: Europe Indoor Spinning Bike Volume Share (%), by Application 2025 & 2033
- Figure 31: Europe Indoor Spinning Bike Revenue (undefined), by Types 2025 & 2033
- Figure 32: Europe Indoor Spinning Bike Volume (K), by Types 2025 & 2033
- Figure 33: Europe Indoor Spinning Bike Revenue Share (%), by Types 2025 & 2033
- Figure 34: Europe Indoor Spinning Bike Volume Share (%), by Types 2025 & 2033
- Figure 35: Europe Indoor Spinning Bike Revenue (undefined), by Country 2025 & 2033
- Figure 36: Europe Indoor Spinning Bike Volume (K), by Country 2025 & 2033
- Figure 37: Europe Indoor Spinning Bike Revenue Share (%), by Country 2025 & 2033
- Figure 38: Europe Indoor Spinning Bike Volume Share (%), by Country 2025 & 2033
- Figure 39: Middle East & Africa Indoor Spinning Bike Revenue (undefined), by Application 2025 & 2033
- Figure 40: Middle East & Africa Indoor Spinning Bike Volume (K), by Application 2025 & 2033
- Figure 41: Middle East & Africa Indoor Spinning Bike Revenue Share (%), by Application 2025 & 2033
- Figure 42: Middle East & Africa Indoor Spinning Bike Volume Share (%), by Application 2025 & 2033
- Figure 43: Middle East & Africa Indoor Spinning Bike Revenue (undefined), by Types 2025 & 2033
- Figure 44: Middle East & Africa Indoor Spinning Bike Volume (K), by Types 2025 & 2033
- Figure 45: Middle East & Africa Indoor Spinning Bike Revenue Share (%), by Types 2025 & 2033
- Figure 46: Middle East & Africa Indoor Spinning Bike Volume Share (%), by Types 2025 & 2033
- Figure 47: Middle East & Africa Indoor Spinning Bike Revenue (undefined), by Country 2025 & 2033
- Figure 48: Middle East & Africa Indoor Spinning Bike Volume (K), by Country 2025 & 2033
- Figure 49: Middle East & Africa Indoor Spinning Bike Revenue Share (%), by Country 2025 & 2033
- Figure 50: Middle East & Africa Indoor Spinning Bike Volume Share (%), by Country 2025 & 2033
- Figure 51: Asia Pacific Indoor Spinning Bike Revenue (undefined), by Application 2025 & 2033
- Figure 52: Asia Pacific Indoor Spinning Bike Volume (K), by Application 2025 & 2033
- Figure 53: Asia Pacific Indoor Spinning Bike Revenue Share (%), by Application 2025 & 2033
- Figure 54: Asia Pacific Indoor Spinning Bike Volume Share (%), by Application 2025 & 2033
- Figure 55: Asia Pacific Indoor Spinning Bike Revenue (undefined), by Types 2025 & 2033
- Figure 56: Asia Pacific Indoor Spinning Bike Volume (K), by Types 2025 & 2033
- Figure 57: Asia Pacific Indoor Spinning Bike Revenue Share (%), by Types 2025 & 2033
- Figure 58: Asia Pacific Indoor Spinning Bike Volume Share (%), by Types 2025 & 2033
- Figure 59: Asia Pacific Indoor Spinning Bike Revenue (undefined), by Country 2025 & 2033
- Figure 60: Asia Pacific Indoor Spinning Bike Volume (K), by Country 2025 & 2033
- Figure 61: Asia Pacific Indoor Spinning Bike Revenue Share (%), by Country 2025 & 2033
- Figure 62: Asia Pacific Indoor Spinning Bike Volume Share (%), by Country 2025 & 2033
List of Tables
- Table 1: Global Indoor Spinning Bike Revenue undefined Forecast, by Application 2020 & 2033
- Table 2: Global Indoor Spinning Bike Volume K Forecast, by Application 2020 & 2033
- Table 3: Global Indoor Spinning Bike Revenue undefined Forecast, by Types 2020 & 2033
- Table 4: Global Indoor Spinning Bike Volume K Forecast, by Types 2020 & 2033
- Table 5: Global Indoor Spinning Bike Revenue undefined Forecast, by Region 2020 & 2033
- Table 6: Global Indoor Spinning Bike Volume K Forecast, by Region 2020 & 2033
- Table 7: Global Indoor Spinning Bike Revenue undefined Forecast, by Application 2020 & 2033
- Table 8: Global Indoor Spinning Bike Volume K Forecast, by Application 2020 & 2033
- Table 9: Global Indoor Spinning Bike Revenue undefined Forecast, by Types 2020 & 2033
- Table 10: Global Indoor Spinning Bike Volume K Forecast, by Types 2020 & 2033
- Table 11: Global Indoor Spinning Bike Revenue undefined Forecast, by Country 2020 & 2033
- Table 12: Global Indoor Spinning Bike Volume K Forecast, by Country 2020 & 2033
- Table 13: United States Indoor Spinning Bike Revenue (undefined) Forecast, by Application 2020 & 2033
- Table 14: United States Indoor Spinning Bike Volume (K) Forecast, by Application 2020 & 2033
- Table 15: Canada Indoor Spinning Bike Revenue (undefined) Forecast, by Application 2020 & 2033
- Table 16: Canada Indoor Spinning Bike Volume (K) Forecast, by Application 2020 & 2033
- Table 17: Mexico Indoor Spinning Bike Revenue (undefined) Forecast, by Application 2020 & 2033
- Table 18: Mexico Indoor Spinning Bike Volume (K) Forecast, by Application 2020 & 2033
- Table 19: Global Indoor Spinning Bike Revenue undefined Forecast, by Application 2020 & 2033
- Table 20: Global Indoor Spinning Bike Volume K Forecast, by Application 2020 & 2033
- Table 21: Global Indoor Spinning Bike Revenue undefined Forecast, by Types 2020 & 2033
- Table 22: Global Indoor Spinning Bike Volume K Forecast, by Types 2020 & 2033
- Table 23: Global Indoor Spinning Bike Revenue undefined Forecast, by Country 2020 & 2033
- Table 24: Global Indoor Spinning Bike Volume K Forecast, by Country 2020 & 2033
- Table 25: Brazil Indoor Spinning Bike Revenue (undefined) Forecast, by Application 2020 & 2033
- Table 26: Brazil Indoor Spinning Bike Volume (K) Forecast, by Application 2020 & 2033
- Table 27: Argentina Indoor Spinning Bike Revenue (undefined) Forecast, by Application 2020 & 2033
- Table 28: Argentina Indoor Spinning Bike Volume (K) Forecast, by Application 2020 & 2033
- Table 29: Rest of South America Indoor Spinning Bike Revenue (undefined) Forecast, by Application 2020 & 2033
- Table 30: Rest of South America Indoor Spinning Bike Volume (K) Forecast, by Application 2020 & 2033
- Table 31: Global Indoor Spinning Bike Revenue undefined Forecast, by Application 2020 & 2033
- Table 32: Global Indoor Spinning Bike Volume K Forecast, by Application 2020 & 2033
- Table 33: Global Indoor Spinning Bike Revenue undefined Forecast, by Types 2020 & 2033
- Table 34: Global Indoor Spinning Bike Volume K Forecast, by Types 2020 & 2033
- Table 35: Global Indoor Spinning Bike Revenue undefined Forecast, by Country 2020 & 2033
- Table 36: Global Indoor Spinning Bike Volume K Forecast, by Country 2020 & 2033
- Table 37: United Kingdom Indoor Spinning Bike Revenue (undefined) Forecast, by Application 2020 & 2033
- Table 38: United Kingdom Indoor Spinning Bike Volume (K) Forecast, by Application 2020 & 2033
- Table 39: Germany Indoor Spinning Bike Revenue (undefined) Forecast, by Application 2020 & 2033
- Table 40: Germany Indoor Spinning Bike Volume (K) Forecast, by Application 2020 & 2033
- Table 41: France Indoor Spinning Bike Revenue (undefined) Forecast, by Application 2020 & 2033
- Table 42: France Indoor Spinning Bike Volume (K) Forecast, by Application 2020 & 2033
- Table 43: Italy Indoor Spinning Bike Revenue (undefined) Forecast, by Application 2020 & 2033
- Table 44: Italy Indoor Spinning Bike Volume (K) Forecast, by Application 2020 & 2033
- Table 45: Spain Indoor Spinning Bike Revenue (undefined) Forecast, by Application 2020 & 2033
- Table 46: Spain Indoor Spinning Bike Volume (K) Forecast, by Application 2020 & 2033
- Table 47: Russia Indoor Spinning Bike Revenue (undefined) Forecast, by Application 2020 & 2033
- Table 48: Russia Indoor Spinning Bike Volume (K) Forecast, by Application 2020 & 2033
- Table 49: Benelux Indoor Spinning Bike Revenue (undefined) Forecast, by Application 2020 & 2033
- Table 50: Benelux Indoor Spinning Bike Volume (K) Forecast, by Application 2020 & 2033
- Table 51: Nordics Indoor Spinning Bike Revenue (undefined) Forecast, by Application 2020 & 2033
- Table 52: Nordics Indoor Spinning Bike Volume (K) Forecast, by Application 2020 & 2033
- Table 53: Rest of Europe Indoor Spinning Bike Revenue (undefined) Forecast, by Application 2020 & 2033
- Table 54: Rest of Europe Indoor Spinning Bike Volume (K) Forecast, by Application 2020 & 2033
- Table 55: Global Indoor Spinning Bike Revenue undefined Forecast, by Application 2020 & 2033
- Table 56: Global Indoor Spinning Bike Volume K Forecast, by Application 2020 & 2033
- Table 57: Global Indoor Spinning Bike Revenue undefined Forecast, by Types 2020 & 2033
- Table 58: Global Indoor Spinning Bike Volume K Forecast, by Types 2020 & 2033
- Table 59: Global Indoor Spinning Bike Revenue undefined Forecast, by Country 2020 & 2033
- Table 60: Global Indoor Spinning Bike Volume K Forecast, by Country 2020 & 2033
- Table 61: Turkey Indoor Spinning Bike Revenue (undefined) Forecast, by Application 2020 & 2033
- Table 62: Turkey Indoor Spinning Bike Volume (K) Forecast, by Application 2020 & 2033
- Table 63: Israel Indoor Spinning Bike Revenue (undefined) Forecast, by Application 2020 & 2033
- Table 64: Israel Indoor Spinning Bike Volume (K) Forecast, by Application 2020 & 2033
- Table 65: GCC Indoor Spinning Bike Revenue (undefined) Forecast, by Application 2020 & 2033
- Table 66: GCC Indoor Spinning Bike Volume (K) Forecast, by Application 2020 & 2033
- Table 67: North Africa Indoor Spinning Bike Revenue (undefined) Forecast, by Application 2020 & 2033
- Table 68: North Africa Indoor Spinning Bike Volume (K) Forecast, by Application 2020 & 2033
- Table 69: South Africa Indoor Spinning Bike Revenue (undefined) Forecast, by Application 2020 & 2033
- Table 70: South Africa Indoor Spinning Bike Volume (K) Forecast, by Application 2020 & 2033
- Table 71: Rest of Middle East & Africa Indoor Spinning Bike Revenue (undefined) Forecast, by Application 2020 & 2033
- Table 72: Rest of Middle East & Africa Indoor Spinning Bike Volume (K) Forecast, by Application 2020 & 2033
- Table 73: Global Indoor Spinning Bike Revenue undefined Forecast, by Application 2020 & 2033
- Table 74: Global Indoor Spinning Bike Volume K Forecast, by Application 2020 & 2033
- Table 75: Global Indoor Spinning Bike Revenue undefined Forecast, by Types 2020 & 2033
- Table 76: Global Indoor Spinning Bike Volume K Forecast, by Types 2020 & 2033
- Table 77: Global Indoor Spinning Bike Revenue undefined Forecast, by Country 2020 & 2033
- Table 78: Global Indoor Spinning Bike Volume K Forecast, by Country 2020 & 2033
- Table 79: China Indoor Spinning Bike Revenue (undefined) Forecast, by Application 2020 & 2033
- Table 80: China Indoor Spinning Bike Volume (K) Forecast, by Application 2020 & 2033
- Table 81: India Indoor Spinning Bike Revenue (undefined) Forecast, by Application 2020 & 2033
- Table 82: India Indoor Spinning Bike Volume (K) Forecast, by Application 2020 & 2033
- Table 83: Japan Indoor Spinning Bike Revenue (undefined) Forecast, by Application 2020 & 2033
- Table 84: Japan Indoor Spinning Bike Volume (K) Forecast, by Application 2020 & 2033
- Table 85: South Korea Indoor Spinning Bike Revenue (undefined) Forecast, by Application 2020 & 2033
- Table 86: South Korea Indoor Spinning Bike Volume (K) Forecast, by Application 2020 & 2033
- Table 87: ASEAN Indoor Spinning Bike Revenue (undefined) Forecast, by Application 2020 & 2033
- Table 88: ASEAN Indoor Spinning Bike Volume (K) Forecast, by Application 2020 & 2033
- Table 89: Oceania Indoor Spinning Bike Revenue (undefined) Forecast, by Application 2020 & 2033
- Table 90: Oceania Indoor Spinning Bike Volume (K) Forecast, by Application 2020 & 2033
- Table 91: Rest of Asia Pacific Indoor Spinning Bike Revenue (undefined) Forecast, by Application 2020 & 2033
- Table 92: Rest of Asia Pacific Indoor Spinning Bike Volume (K) Forecast, by Application 2020 & 2033
Frequently Asked Questions
1. What is the projected Compound Annual Growth Rate (CAGR) of the Indoor Spinning Bike?
The projected CAGR is approximately 10.2%.
2. Which companies are prominent players in the Indoor Spinning Bike?
Key companies in the market include Sunny, JOROTO, YOSUDA, Schwinn, SYRINX, pooboo, DMASUN, NordicTrack, Cyclace, Shuhua Sports Co., Ltd..
3. What are the main segments of the Indoor Spinning Bike?
The market segments include Application, Types.
4. Can you provide details about the market size?
The market size is estimated to be USD XXX N/A as of 2022.
5. What are some drivers contributing to market growth?
N/A
6. What are the notable trends driving market growth?
N/A
7. Are there any restraints impacting market growth?
N/A
8. Can you provide examples of recent developments in the market?
N/A
9. What pricing options are available for accessing the report?
Pricing options include single-user, multi-user, and enterprise licenses priced at USD 3950.00, USD 5925.00, and USD 7900.00 respectively.
10. Is the market size provided in terms of value or volume?
The market size is provided in terms of value, measured in N/A and volume, measured in K.
11. Are there any specific market keywords associated with the report?
Yes, the market keyword associated with the report is "Indoor Spinning Bike," which aids in identifying and referencing the specific market segment covered.
12. How do I determine which pricing option suits my needs best?
The pricing options vary based on user requirements and access needs. Individual users may opt for single-user licenses, while businesses requiring broader access may choose multi-user or enterprise licenses for cost-effective access to the report.
13. Are there any additional resources or data provided in the Indoor Spinning Bike report?
While the report offers comprehensive insights, it's advisable to review the specific contents or supplementary materials provided to ascertain if additional resources or data are available.
14. How can I stay updated on further developments or reports in the Indoor Spinning Bike?
To stay informed about further developments, trends, and reports in the Indoor Spinning Bike, consider subscribing to industry newsletters, following relevant companies and organizations, or regularly checking reputable industry news sources and publications.
Methodology
Step 1 - Identification of Relevant Samples Size from Population Database


Step 2 - Approaches for Defining Global Market Size (Value, Volume* & Price*)

Note*: In applicable scenarios
Step 3 - Data Sources
Primary Research
- Web Analytics
- Survey Reports
- Research Institute
- Latest Research Reports
- Opinion Leaders
Secondary Research
- Annual Reports
- White Paper
- Latest Press Release
- Industry Association
- Paid Database
- Investor Presentations

Step 4 - Data Triangulation
Involves using different sources of information in order to increase the validity of a study
These sources are likely to be stakeholders in a program - participants, other researchers, program staff, other community members, and so on.
Then we put all data in single framework & apply various statistical tools to find out the dynamic on the market.
During the analysis stage, feedback from the stakeholder groups would be compared to determine areas of agreement as well as areas of divergence