

Key Insights
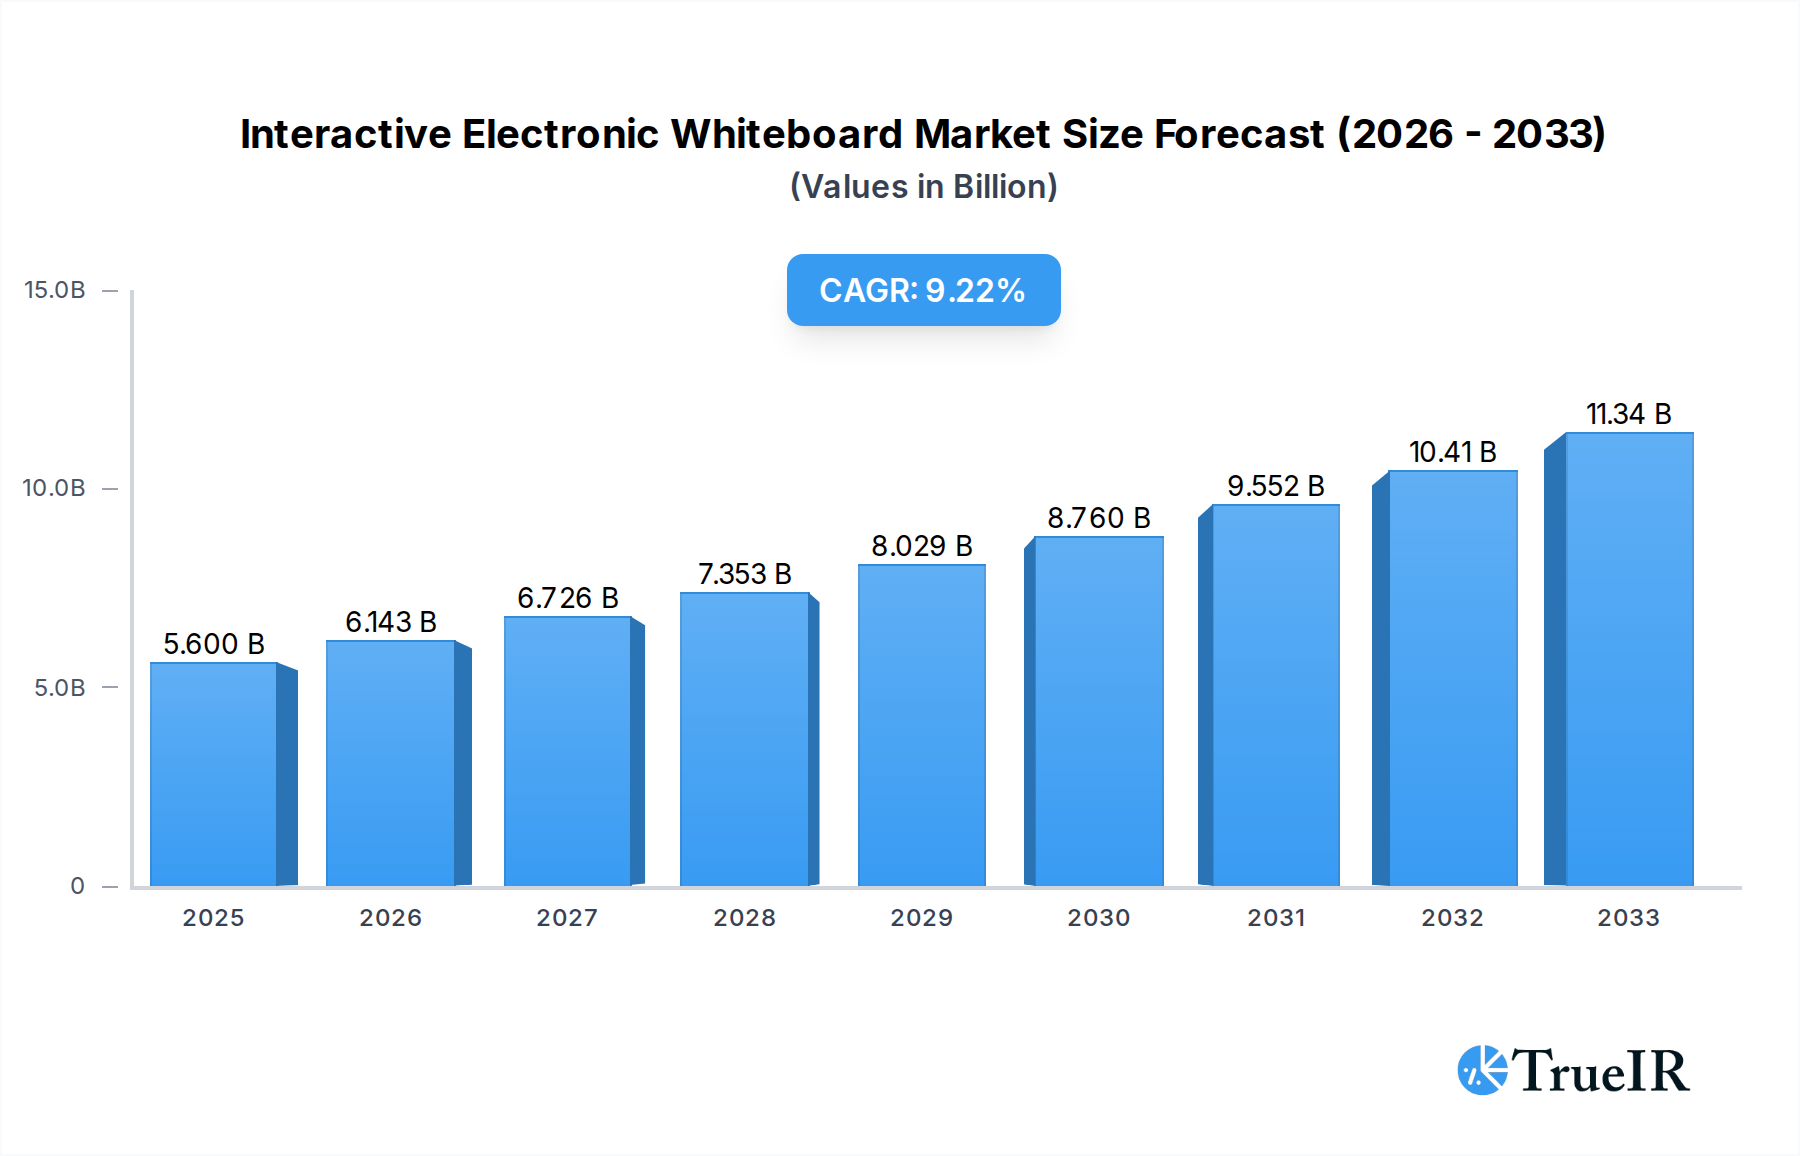
The global Interactive Electronic Whiteboard (IEWB) market is poised for substantial expansion, driven by the increasing integration of technology in educational institutions and the growing demand for collaborative solutions in business environments. The market is projected to reach USD 5.6 billion in 2025, with an impressive Compound Annual Growth Rate (CAGR) of 9.7% anticipated from 2025 to 2033. This robust growth is fueled by key drivers such as the rising adoption of smart classrooms, the need for enhanced engagement in remote and hybrid work settings, and advancements in display technology offering more interactive and user-friendly experiences. The demand for larger screen sizes, particularly those above 55 inches, is a significant trend, reflecting the preference for immersive and inclusive presentation and learning environments. Furthermore, the ongoing digital transformation across various sectors is creating new avenues for IEWB deployment, from government training programs to home-based educational tools.

Interactive Electronic Whiteboard Market Size (In Billion)
Despite the positive outlook, the market faces certain restraints. High initial investment costs for advanced IEWB systems and the need for comprehensive training to effectively utilize their functionalities can pose challenges for widespread adoption, especially in price-sensitive markets or smaller organizations. However, the continuous innovation by leading companies like SMART Technologies, Panasonic, and Promethean, focusing on more affordable yet feature-rich solutions, is expected to mitigate these restraints. The market is segmented across diverse applications, including Education, Business, and Government fields, with the Education sector historically being a dominant force, though the Business sector is rapidly gaining traction. Geographically, Asia Pacific, particularly China and India, is expected to witness significant growth due to government initiatives promoting digital education and increasing enterprise adoption. North America and Europe will continue to be key markets, driven by early adoption and technological sophistication.
Interactive Electronic Whiteboard Company Market Share
This comprehensive report delivers an in-depth analysis of the global Interactive Electronic Whiteboard market, providing invaluable insights into its structure, trends, opportunities, and competitive landscape. Covering a study period from 2019 to 2033, with a base year of 2025 and a forecast period extending to 2033, this report is essential for stakeholders seeking to understand and capitalize on the evolving dynamics of this rapidly growing sector.
Interactive Electronic Whiteboard Market Structure & Competitive Landscape
The global Interactive Electronic Whiteboard market exhibits a moderate to high degree of concentration, with a few dominant players holding significant market share. Key innovation drivers include the increasing demand for interactive learning tools in the education sector and the growing adoption of collaborative technologies in the business environment. Regulatory impacts are primarily related to data privacy and accessibility standards, particularly in government and educational institutions. Product substitutes, such as traditional whiteboards and projectors, are gradually being phased out as the functionality and cost-effectiveness of interactive whiteboards improve. End-user segmentation reveals a strong reliance on the Education Field, followed closely by the Business Field. Mergers and acquisitions (M&A) activity is a significant trend, with larger companies acquiring innovative startups to expand their product portfolios and market reach. For instance, in the historical period (2019-2024), an estimated 15 major M&A deals, totaling over $1 billion in value, have reshaped the competitive landscape. Concentration ratios for the top 5 players are estimated to be around 60% in 2025.
Interactive Electronic Whiteboard Market Trends & Opportunities
The global Interactive Electronic Whiteboard market is poised for substantial growth, with an anticipated Compound Annual Growth Rate (CAGR) of approximately 12.5% from 2025 to 2033. This impressive growth trajectory is fueled by a confluence of technological advancements, shifting consumer preferences, and expanding application areas. The market size is projected to reach over $25 billion by 2033, a significant increase from an estimated $12 billion in 2025. Technological shifts are central to this expansion, with innovations in touch responsiveness, integrated software solutions, and artificial intelligence (AI)-powered features transforming the user experience. The increasing integration of cloud connectivity allows for seamless content sharing, remote collaboration, and data analytics, further enhancing the value proposition of these devices. Consumer preferences are increasingly leaning towards intuitive, user-friendly interfaces and robust educational software that supports personalized learning and engagement. In the business field, the demand for interactive displays in meeting rooms and presentation spaces is soaring, driven by the need for enhanced collaboration and productivity. The market penetration rate for interactive whiteboards in developed educational markets is already high, exceeding 70%, creating opportunities for upgrade cycles and feature-rich solutions. Emerging markets represent a significant untapped potential, with growing investments in digital infrastructure and educational technology. The competitive dynamics are characterized by fierce innovation, with companies continually striving to differentiate themselves through unique features, pricing strategies, and ecosystem partnerships. The shift towards larger screen sizes and higher resolutions continues, catering to diverse room sizes and application needs. Furthermore, the burgeoning demand for smart classroom solutions and digital signage in commercial spaces presents a significant avenue for market expansion.
Dominant Markets & Segments in Interactive Electronic Whiteboard
The Education Field consistently dominates the Interactive Electronic Whiteboard market, driven by global initiatives to modernize learning environments and enhance student engagement. In 2025, the Education Field is projected to account for over 55% of the total market revenue, estimated at $6.6 billion. Within this segment, North America and Europe are leading regions, with substantial government investments in educational technology and high adoption rates of interactive learning tools. The market dominance in the Education Field is propelled by key growth drivers such as:
- Government Policies and Funding: Numerous governments worldwide are implementing policies to promote digital learning and investing billions in equipping schools with modern technology.
- Demand for Enhanced Learning Experiences: Educators and students alike are seeking more interactive and engaging ways to deliver and receive information, moving away from traditional lecture formats.
- Technological Advancements: The continuous improvement in interactive whiteboard technology, including better responsiveness, integration with learning management systems (LMS), and content creation tools, fuels adoption.
In terms of Types, the 66-75 Inch segment is currently the most dominant, representing an estimated 40% of the market share in 2025, valued at approximately $4.8 billion. This size range offers an optimal balance of visibility and interactivity for most classroom and meeting room settings. However, significant growth is anticipated in the larger screen sizes, More than 85 Inch, as they become more accessible and are increasingly adopted for auditoriums, large conference halls, and collaborative workspaces.
- Growth Drivers for 66-75 Inch Segment:
- Ideal size for medium to large classrooms and standard meeting rooms.
- Cost-effectiveness compared to larger displays.
- Wide range of features and functionalities available.
- Growth Drivers for More than 85 Inch Segment:
- Increasing demand for immersive presentation and collaboration experiences.
- Adoption in corporate training centers, command centers, and higher education lecture halls.
- Technological advancements making larger displays more feasible and affordable.
The Business Field is the second-largest segment, with an estimated market size of $4.2 billion in 2025, representing 35% of the total market. This segment is driven by the need for effective collaboration tools in corporate environments, particularly with the rise of hybrid work models. Government Field, while smaller, is experiencing steady growth due to its adoption in public sector training and civic engagement initiatives.
Interactive Electronic Whiteboard Product Analysis
Interactive Electronic Whiteboards are continuously evolving, with product innovations focusing on enhanced touch accuracy, intuitive software integration, and advanced connectivity features. Current offerings emphasize seamless integration with cloud platforms, enabling real-time collaboration, content sharing, and remote access. Many models incorporate AI-powered functionalities for features like handwriting recognition and intelligent annotation. The competitive advantage lies in offering a comprehensive ecosystem of hardware, software, and support services that cater to specific end-user needs, particularly in the Education and Business Fields.
Key Drivers, Barriers & Challenges in Interactive Electronic Whiteboard
Key Drivers:
- Digital Transformation Initiatives: Widespread adoption of digital technologies in education and business environments is a primary growth catalyst.
- Demand for Collaborative Learning & Work: The need for interactive and engaging learning experiences and more efficient workplace collaboration fuels demand.
- Technological Advancements: Continuous improvements in touch technology, display quality, and integrated software are making interactive whiteboards more appealing.
- Government Support & Funding: Increased public investment in educational technology and digital infrastructure provides significant impetus.
Barriers & Challenges:
- High Initial Cost: The upfront investment for interactive whiteboards can be a barrier for smaller institutions or businesses with limited budgets.
- Integration Complexity: Ensuring seamless integration with existing IT infrastructure and diverse software ecosystems can be challenging.
- Teacher/User Training: Effective utilization requires adequate training for educators and employees, which can be a resource-intensive undertaking.
- Competition from Alternative Technologies: While declining, competition from projectors and traditional whiteboards persists in certain price-sensitive segments.
- Supply Chain Volatility: Global supply chain disruptions can impact the availability and cost of components, affecting production timelines.
Growth Drivers in the Interactive Electronic Whiteboard Market
The Interactive Electronic Whiteboard market is propelled by several key growth drivers. Technologically, the evolution towards higher resolution displays, faster touch response times, and integrated AI features enhances user experience and functionality. Economically, increasing government investments in digitalization, particularly in the education sector, and the growing corporate focus on collaborative workspaces are significant catalysts. Regulatory factors, such as mandates for smart classrooms and digital accessibility standards, also contribute to market expansion. For instance, the US government's significant investment in educational technology over the past five years has boosted adoption rates, and similar trends are emerging globally.
Challenges Impacting Interactive Electronic Whiteboard Growth
Several challenges can impact the growth of the Interactive Electronic Whiteboard market. Regulatory complexities related to data privacy and security can pose hurdles, particularly for government and enterprise deployments. Supply chain issues, as witnessed in recent years, can lead to production delays and increased costs, affecting product availability. Furthermore, intense competitive pressures among key players can lead to price wars and a continuous need for significant R&D investment to maintain market share. The high initial cost of advanced interactive whiteboards also remains a barrier for adoption in price-sensitive markets.
Key Players Shaping the Interactive Electronic Whiteboard Market
- SMART Technologies (Foxconn)
- PLUS Corporation
- Promethean
- Turning Technologies
- Panasonic
- Ricoh
- Hitevision
- Julong
- Returnstar
- INTECH
- Haiya
- Hitachi
- Changhong
- Genee
- Seewo
Significant Interactive Electronic Whiteboard Industry Milestones
- 2019: Increased adoption of cloud-based collaborative software for interactive whiteboards.
- 2020: Surge in demand for interactive whiteboards for remote learning due to global pandemic.
- 2021: Introduction of AI-powered features in interactive whiteboards, enhancing user experience.
- 2022: Growing trend of larger screen sizes and higher resolution displays becoming more mainstream.
- 2023: Expansion of interactive whiteboard applications into new sectors like healthcare and retail.
- 2024: Focus on enhanced cybersecurity features and data privacy in interactive whiteboard solutions.
Future Outlook for Interactive Electronic Whiteboard Market
The future outlook for the Interactive Electronic Whiteboard market is exceptionally bright, driven by an ongoing digital transformation across various sectors. Strategic opportunities lie in the continued innovation of AI-integrated features, the development of more affordable solutions for emerging markets, and the expansion into new application verticals. Market potential will be further unlocked by strategic partnerships and the creation of comprehensive educational and business technology ecosystems. The increasing emphasis on blended learning models and hybrid work environments will continue to fuel the demand for interactive and collaborative technologies, positioning the Interactive Electronic Whiteboard as a critical tool for the future.
Interactive Electronic Whiteboard Segmentation
-
1. Application
- 1.1. Education Field
- 1.2. Business Field
- 1.3. Government Field
- 1.4. Household Field
- 1.5. Others
-
2. Types
- 2.1. Below 55 Inch
- 2.2. 56-65 Inch
- 2.3. 66-75 Inch
- 2.4. 76-85 Inch
- 2.5. More than 85 Inch
Interactive Electronic Whiteboard Segmentation By Geography
-
1. North America
- 1.1. United States
- 1.2. Canada
- 1.3. Mexico
-
2. South America
- 2.1. Brazil
- 2.2. Argentina
- 2.3. Rest of South America
-
3. Europe
- 3.1. United Kingdom
- 3.2. Germany
- 3.3. France
- 3.4. Italy
- 3.5. Spain
- 3.6. Russia
- 3.7. Benelux
- 3.8. Nordics
- 3.9. Rest of Europe
-
4. Middle East & Africa
- 4.1. Turkey
- 4.2. Israel
- 4.3. GCC
- 4.4. North Africa
- 4.5. South Africa
- 4.6. Rest of Middle East & Africa
-
5. Asia Pacific
- 5.1. China
- 5.2. India
- 5.3. Japan
- 5.4. South Korea
- 5.5. ASEAN
- 5.6. Oceania
- 5.7. Rest of Asia Pacific
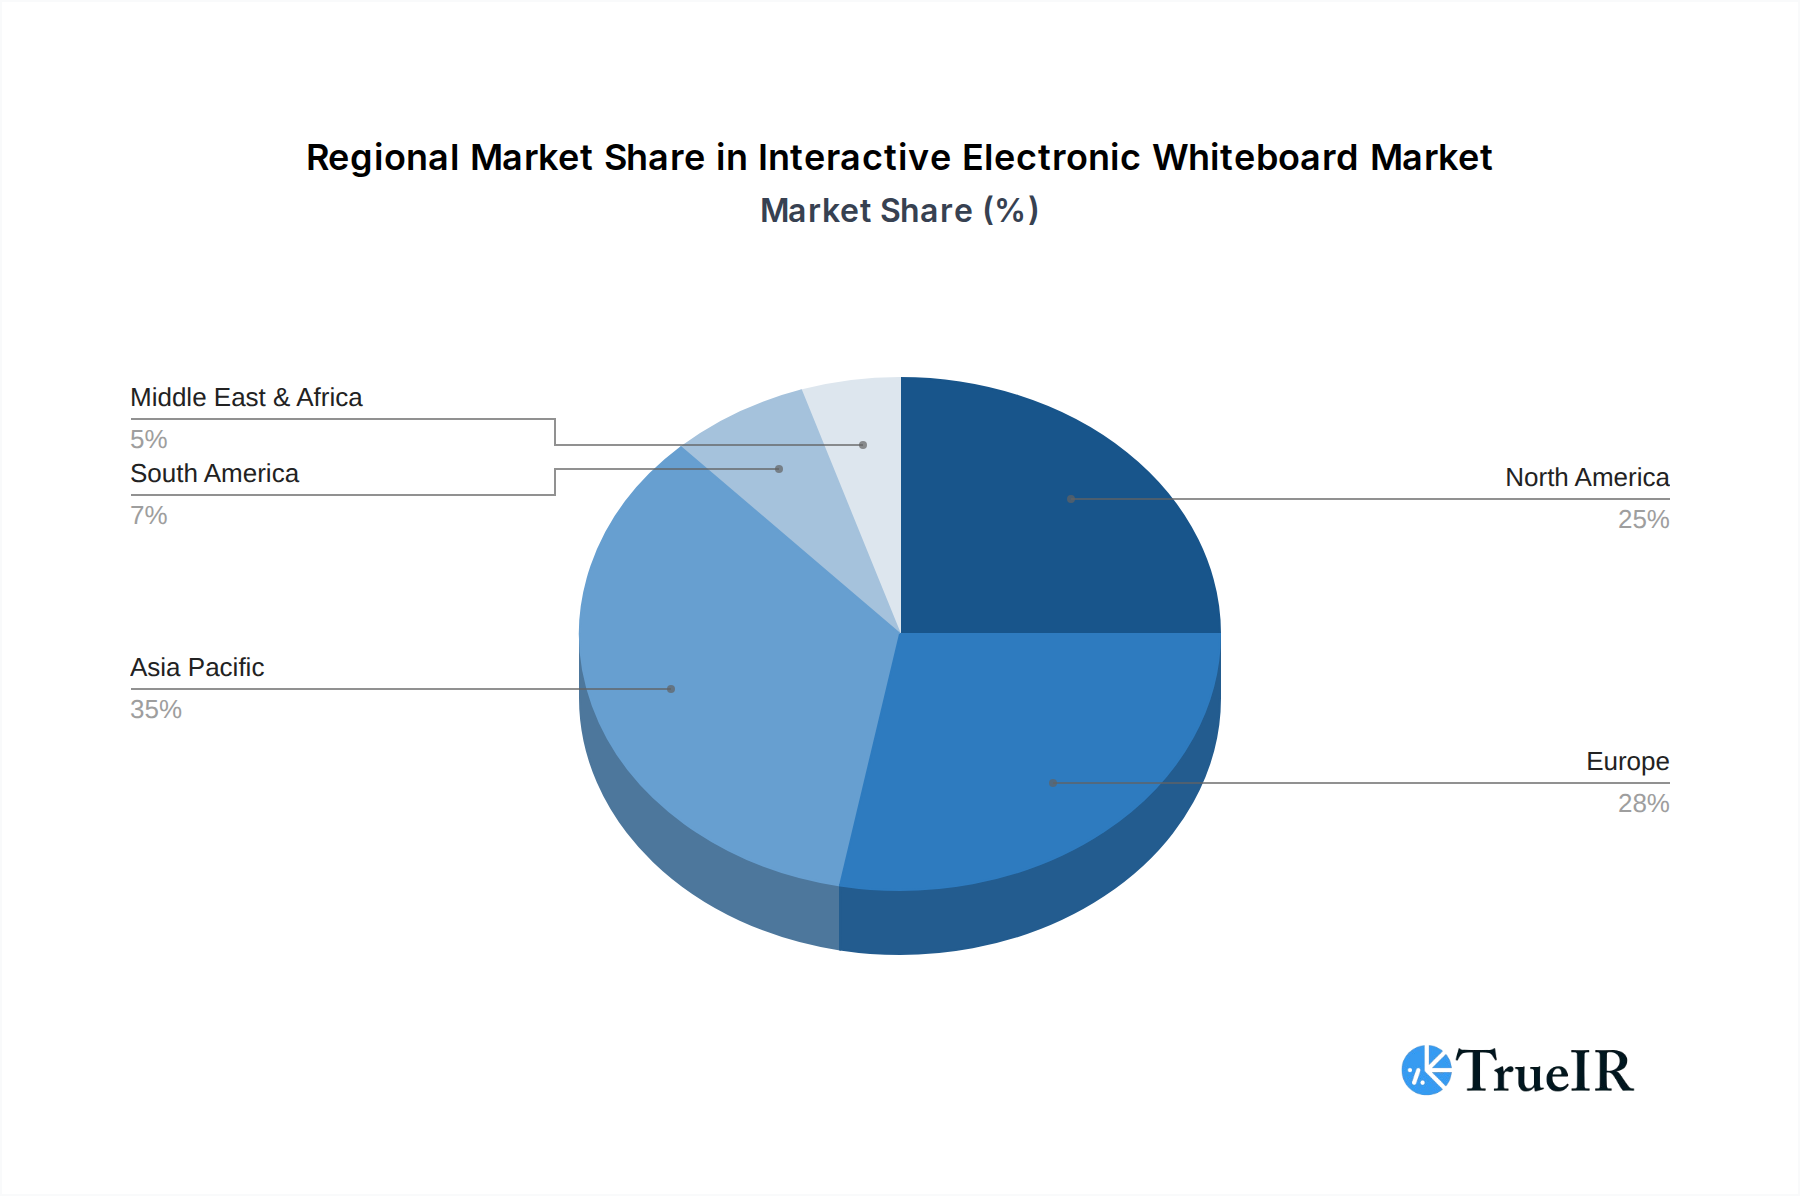
Interactive Electronic Whiteboard Regional Market Share
Geographic Coverage of Interactive Electronic Whiteboard
Interactive Electronic Whiteboard REPORT HIGHLIGHTS
| Aspects | Details |
|---|---|
| Study Period | 2020-2034 |
| Base Year | 2025 |
| Estimated Year | 2026 |
| Forecast Period | 2026-2034 |
| Historical Period | 2020-2025 |
| Growth Rate | CAGR of 9.7% from 2020-2034 |
| Segmentation |
|
Table of Contents
- 1. Introduction
- 1.1. Research Scope
- 1.2. Market Segmentation
- 1.3. Research Methodology
- 1.4. Definitions and Assumptions
- 2. Executive Summary
- 2.1. Introduction
- 3. Market Dynamics
- 3.1. Introduction
- 3.2. Market Drivers
- 3.3. Market Restrains
- 3.4. Market Trends
- 4. Market Factor Analysis
- 4.1. Porters Five Forces
- 4.2. Supply/Value Chain
- 4.3. PESTEL analysis
- 4.4. Market Entropy
- 4.5. Patent/Trademark Analysis
- 5. Global Interactive Electronic Whiteboard Analysis, Insights and Forecast, 2020-2032
- 5.1. Market Analysis, Insights and Forecast - by Application
- 5.1.1. Education Field
- 5.1.2. Business Field
- 5.1.3. Government Field
- 5.1.4. Household Field
- 5.1.5. Others
- 5.2. Market Analysis, Insights and Forecast - by Types
- 5.2.1. Below 55 Inch
- 5.2.2. 56-65 Inch
- 5.2.3. 66-75 Inch
- 5.2.4. 76-85 Inch
- 5.2.5. More than 85 Inch
- 5.3. Market Analysis, Insights and Forecast - by Region
- 5.3.1. North America
- 5.3.2. South America
- 5.3.3. Europe
- 5.3.4. Middle East & Africa
- 5.3.5. Asia Pacific
- 5.1. Market Analysis, Insights and Forecast - by Application
- 6. North America Interactive Electronic Whiteboard Analysis, Insights and Forecast, 2020-2032
- 6.1. Market Analysis, Insights and Forecast - by Application
- 6.1.1. Education Field
- 6.1.2. Business Field
- 6.1.3. Government Field
- 6.1.4. Household Field
- 6.1.5. Others
- 6.2. Market Analysis, Insights and Forecast - by Types
- 6.2.1. Below 55 Inch
- 6.2.2. 56-65 Inch
- 6.2.3. 66-75 Inch
- 6.2.4. 76-85 Inch
- 6.2.5. More than 85 Inch
- 6.1. Market Analysis, Insights and Forecast - by Application
- 7. South America Interactive Electronic Whiteboard Analysis, Insights and Forecast, 2020-2032
- 7.1. Market Analysis, Insights and Forecast - by Application
- 7.1.1. Education Field
- 7.1.2. Business Field
- 7.1.3. Government Field
- 7.1.4. Household Field
- 7.1.5. Others
- 7.2. Market Analysis, Insights and Forecast - by Types
- 7.2.1. Below 55 Inch
- 7.2.2. 56-65 Inch
- 7.2.3. 66-75 Inch
- 7.2.4. 76-85 Inch
- 7.2.5. More than 85 Inch
- 7.1. Market Analysis, Insights and Forecast - by Application
- 8. Europe Interactive Electronic Whiteboard Analysis, Insights and Forecast, 2020-2032
- 8.1. Market Analysis, Insights and Forecast - by Application
- 8.1.1. Education Field
- 8.1.2. Business Field
- 8.1.3. Government Field
- 8.1.4. Household Field
- 8.1.5. Others
- 8.2. Market Analysis, Insights and Forecast - by Types
- 8.2.1. Below 55 Inch
- 8.2.2. 56-65 Inch
- 8.2.3. 66-75 Inch
- 8.2.4. 76-85 Inch
- 8.2.5. More than 85 Inch
- 8.1. Market Analysis, Insights and Forecast - by Application
- 9. Middle East & Africa Interactive Electronic Whiteboard Analysis, Insights and Forecast, 2020-2032
- 9.1. Market Analysis, Insights and Forecast - by Application
- 9.1.1. Education Field
- 9.1.2. Business Field
- 9.1.3. Government Field
- 9.1.4. Household Field
- 9.1.5. Others
- 9.2. Market Analysis, Insights and Forecast - by Types
- 9.2.1. Below 55 Inch
- 9.2.2. 56-65 Inch
- 9.2.3. 66-75 Inch
- 9.2.4. 76-85 Inch
- 9.2.5. More than 85 Inch
- 9.1. Market Analysis, Insights and Forecast - by Application
- 10. Asia Pacific Interactive Electronic Whiteboard Analysis, Insights and Forecast, 2020-2032
- 10.1. Market Analysis, Insights and Forecast - by Application
- 10.1.1. Education Field
- 10.1.2. Business Field
- 10.1.3. Government Field
- 10.1.4. Household Field
- 10.1.5. Others
- 10.2. Market Analysis, Insights and Forecast - by Types
- 10.2.1. Below 55 Inch
- 10.2.2. 56-65 Inch
- 10.2.3. 66-75 Inch
- 10.2.4. 76-85 Inch
- 10.2.5. More than 85 Inch
- 10.1. Market Analysis, Insights and Forecast - by Application
- 11. Competitive Analysis
- 11.1. Global Market Share Analysis 2025
- 11.2. Company Profiles
- 11.2.1 SMART Technologies (Foxconn)
- 11.2.1.1. Overview
- 11.2.1.2. Products
- 11.2.1.3. SWOT Analysis
- 11.2.1.4. Recent Developments
- 11.2.1.5. Financials (Based on Availability)
- 11.2.2 PLUS Corporation
- 11.2.2.1. Overview
- 11.2.2.2. Products
- 11.2.2.3. SWOT Analysis
- 11.2.2.4. Recent Developments
- 11.2.2.5. Financials (Based on Availability)
- 11.2.3 Promethean
- 11.2.3.1. Overview
- 11.2.3.2. Products
- 11.2.3.3. SWOT Analysis
- 11.2.3.4. Recent Developments
- 11.2.3.5. Financials (Based on Availability)
- 11.2.4 Turning Technologies
- 11.2.4.1. Overview
- 11.2.4.2. Products
- 11.2.4.3. SWOT Analysis
- 11.2.4.4. Recent Developments
- 11.2.4.5. Financials (Based on Availability)
- 11.2.5 Panasonic
- 11.2.5.1. Overview
- 11.2.5.2. Products
- 11.2.5.3. SWOT Analysis
- 11.2.5.4. Recent Developments
- 11.2.5.5. Financials (Based on Availability)
- 11.2.6 Ricoh
- 11.2.6.1. Overview
- 11.2.6.2. Products
- 11.2.6.3. SWOT Analysis
- 11.2.6.4. Recent Developments
- 11.2.6.5. Financials (Based on Availability)
- 11.2.7 Hitevision
- 11.2.7.1. Overview
- 11.2.7.2. Products
- 11.2.7.3. SWOT Analysis
- 11.2.7.4. Recent Developments
- 11.2.7.5. Financials (Based on Availability)
- 11.2.8 Julong
- 11.2.8.1. Overview
- 11.2.8.2. Products
- 11.2.8.3. SWOT Analysis
- 11.2.8.4. Recent Developments
- 11.2.8.5. Financials (Based on Availability)
- 11.2.9 Returnstar
- 11.2.9.1. Overview
- 11.2.9.2. Products
- 11.2.9.3. SWOT Analysis
- 11.2.9.4. Recent Developments
- 11.2.9.5. Financials (Based on Availability)
- 11.2.10 INTECH
- 11.2.10.1. Overview
- 11.2.10.2. Products
- 11.2.10.3. SWOT Analysis
- 11.2.10.4. Recent Developments
- 11.2.10.5. Financials (Based on Availability)
- 11.2.11 Haiya
- 11.2.11.1. Overview
- 11.2.11.2. Products
- 11.2.11.3. SWOT Analysis
- 11.2.11.4. Recent Developments
- 11.2.11.5. Financials (Based on Availability)
- 11.2.12 Hitachi
- 11.2.12.1. Overview
- 11.2.12.2. Products
- 11.2.12.3. SWOT Analysis
- 11.2.12.4. Recent Developments
- 11.2.12.5. Financials (Based on Availability)
- 11.2.13 Changhong
- 11.2.13.1. Overview
- 11.2.13.2. Products
- 11.2.13.3. SWOT Analysis
- 11.2.13.4. Recent Developments
- 11.2.13.5. Financials (Based on Availability)
- 11.2.14 Genee
- 11.2.14.1. Overview
- 11.2.14.2. Products
- 11.2.14.3. SWOT Analysis
- 11.2.14.4. Recent Developments
- 11.2.14.5. Financials (Based on Availability)
- 11.2.15 Seewo
- 11.2.15.1. Overview
- 11.2.15.2. Products
- 11.2.15.3. SWOT Analysis
- 11.2.15.4. Recent Developments
- 11.2.15.5. Financials (Based on Availability)
- 11.2.1 SMART Technologies (Foxconn)
List of Figures
- Figure 1: Global Interactive Electronic Whiteboard Revenue Breakdown (billion, %) by Region 2025 & 2033
- Figure 2: North America Interactive Electronic Whiteboard Revenue (billion), by Application 2025 & 2033
- Figure 3: North America Interactive Electronic Whiteboard Revenue Share (%), by Application 2025 & 2033
- Figure 4: North America Interactive Electronic Whiteboard Revenue (billion), by Types 2025 & 2033
- Figure 5: North America Interactive Electronic Whiteboard Revenue Share (%), by Types 2025 & 2033
- Figure 6: North America Interactive Electronic Whiteboard Revenue (billion), by Country 2025 & 2033
- Figure 7: North America Interactive Electronic Whiteboard Revenue Share (%), by Country 2025 & 2033
- Figure 8: South America Interactive Electronic Whiteboard Revenue (billion), by Application 2025 & 2033
- Figure 9: South America Interactive Electronic Whiteboard Revenue Share (%), by Application 2025 & 2033
- Figure 10: South America Interactive Electronic Whiteboard Revenue (billion), by Types 2025 & 2033
- Figure 11: South America Interactive Electronic Whiteboard Revenue Share (%), by Types 2025 & 2033
- Figure 12: South America Interactive Electronic Whiteboard Revenue (billion), by Country 2025 & 2033
- Figure 13: South America Interactive Electronic Whiteboard Revenue Share (%), by Country 2025 & 2033
- Figure 14: Europe Interactive Electronic Whiteboard Revenue (billion), by Application 2025 & 2033
- Figure 15: Europe Interactive Electronic Whiteboard Revenue Share (%), by Application 2025 & 2033
- Figure 16: Europe Interactive Electronic Whiteboard Revenue (billion), by Types 2025 & 2033
- Figure 17: Europe Interactive Electronic Whiteboard Revenue Share (%), by Types 2025 & 2033
- Figure 18: Europe Interactive Electronic Whiteboard Revenue (billion), by Country 2025 & 2033
- Figure 19: Europe Interactive Electronic Whiteboard Revenue Share (%), by Country 2025 & 2033
- Figure 20: Middle East & Africa Interactive Electronic Whiteboard Revenue (billion), by Application 2025 & 2033
- Figure 21: Middle East & Africa Interactive Electronic Whiteboard Revenue Share (%), by Application 2025 & 2033
- Figure 22: Middle East & Africa Interactive Electronic Whiteboard Revenue (billion), by Types 2025 & 2033
- Figure 23: Middle East & Africa Interactive Electronic Whiteboard Revenue Share (%), by Types 2025 & 2033
- Figure 24: Middle East & Africa Interactive Electronic Whiteboard Revenue (billion), by Country 2025 & 2033
- Figure 25: Middle East & Africa Interactive Electronic Whiteboard Revenue Share (%), by Country 2025 & 2033
- Figure 26: Asia Pacific Interactive Electronic Whiteboard Revenue (billion), by Application 2025 & 2033
- Figure 27: Asia Pacific Interactive Electronic Whiteboard Revenue Share (%), by Application 2025 & 2033
- Figure 28: Asia Pacific Interactive Electronic Whiteboard Revenue (billion), by Types 2025 & 2033
- Figure 29: Asia Pacific Interactive Electronic Whiteboard Revenue Share (%), by Types 2025 & 2033
- Figure 30: Asia Pacific Interactive Electronic Whiteboard Revenue (billion), by Country 2025 & 2033
- Figure 31: Asia Pacific Interactive Electronic Whiteboard Revenue Share (%), by Country 2025 & 2033
List of Tables
- Table 1: Global Interactive Electronic Whiteboard Revenue billion Forecast, by Application 2020 & 2033
- Table 2: Global Interactive Electronic Whiteboard Revenue billion Forecast, by Types 2020 & 2033
- Table 3: Global Interactive Electronic Whiteboard Revenue billion Forecast, by Region 2020 & 2033
- Table 4: Global Interactive Electronic Whiteboard Revenue billion Forecast, by Application 2020 & 2033
- Table 5: Global Interactive Electronic Whiteboard Revenue billion Forecast, by Types 2020 & 2033
- Table 6: Global Interactive Electronic Whiteboard Revenue billion Forecast, by Country 2020 & 2033
- Table 7: United States Interactive Electronic Whiteboard Revenue (billion) Forecast, by Application 2020 & 2033
- Table 8: Canada Interactive Electronic Whiteboard Revenue (billion) Forecast, by Application 2020 & 2033
- Table 9: Mexico Interactive Electronic Whiteboard Revenue (billion) Forecast, by Application 2020 & 2033
- Table 10: Global Interactive Electronic Whiteboard Revenue billion Forecast, by Application 2020 & 2033
- Table 11: Global Interactive Electronic Whiteboard Revenue billion Forecast, by Types 2020 & 2033
- Table 12: Global Interactive Electronic Whiteboard Revenue billion Forecast, by Country 2020 & 2033
- Table 13: Brazil Interactive Electronic Whiteboard Revenue (billion) Forecast, by Application 2020 & 2033
- Table 14: Argentina Interactive Electronic Whiteboard Revenue (billion) Forecast, by Application 2020 & 2033
- Table 15: Rest of South America Interactive Electronic Whiteboard Revenue (billion) Forecast, by Application 2020 & 2033
- Table 16: Global Interactive Electronic Whiteboard Revenue billion Forecast, by Application 2020 & 2033
- Table 17: Global Interactive Electronic Whiteboard Revenue billion Forecast, by Types 2020 & 2033
- Table 18: Global Interactive Electronic Whiteboard Revenue billion Forecast, by Country 2020 & 2033
- Table 19: United Kingdom Interactive Electronic Whiteboard Revenue (billion) Forecast, by Application 2020 & 2033
- Table 20: Germany Interactive Electronic Whiteboard Revenue (billion) Forecast, by Application 2020 & 2033
- Table 21: France Interactive Electronic Whiteboard Revenue (billion) Forecast, by Application 2020 & 2033
- Table 22: Italy Interactive Electronic Whiteboard Revenue (billion) Forecast, by Application 2020 & 2033
- Table 23: Spain Interactive Electronic Whiteboard Revenue (billion) Forecast, by Application 2020 & 2033
- Table 24: Russia Interactive Electronic Whiteboard Revenue (billion) Forecast, by Application 2020 & 2033
- Table 25: Benelux Interactive Electronic Whiteboard Revenue (billion) Forecast, by Application 2020 & 2033
- Table 26: Nordics Interactive Electronic Whiteboard Revenue (billion) Forecast, by Application 2020 & 2033
- Table 27: Rest of Europe Interactive Electronic Whiteboard Revenue (billion) Forecast, by Application 2020 & 2033
- Table 28: Global Interactive Electronic Whiteboard Revenue billion Forecast, by Application 2020 & 2033
- Table 29: Global Interactive Electronic Whiteboard Revenue billion Forecast, by Types 2020 & 2033
- Table 30: Global Interactive Electronic Whiteboard Revenue billion Forecast, by Country 2020 & 2033
- Table 31: Turkey Interactive Electronic Whiteboard Revenue (billion) Forecast, by Application 2020 & 2033
- Table 32: Israel Interactive Electronic Whiteboard Revenue (billion) Forecast, by Application 2020 & 2033
- Table 33: GCC Interactive Electronic Whiteboard Revenue (billion) Forecast, by Application 2020 & 2033
- Table 34: North Africa Interactive Electronic Whiteboard Revenue (billion) Forecast, by Application 2020 & 2033
- Table 35: South Africa Interactive Electronic Whiteboard Revenue (billion) Forecast, by Application 2020 & 2033
- Table 36: Rest of Middle East & Africa Interactive Electronic Whiteboard Revenue (billion) Forecast, by Application 2020 & 2033
- Table 37: Global Interactive Electronic Whiteboard Revenue billion Forecast, by Application 2020 & 2033
- Table 38: Global Interactive Electronic Whiteboard Revenue billion Forecast, by Types 2020 & 2033
- Table 39: Global Interactive Electronic Whiteboard Revenue billion Forecast, by Country 2020 & 2033
- Table 40: China Interactive Electronic Whiteboard Revenue (billion) Forecast, by Application 2020 & 2033
- Table 41: India Interactive Electronic Whiteboard Revenue (billion) Forecast, by Application 2020 & 2033
- Table 42: Japan Interactive Electronic Whiteboard Revenue (billion) Forecast, by Application 2020 & 2033
- Table 43: South Korea Interactive Electronic Whiteboard Revenue (billion) Forecast, by Application 2020 & 2033
- Table 44: ASEAN Interactive Electronic Whiteboard Revenue (billion) Forecast, by Application 2020 & 2033
- Table 45: Oceania Interactive Electronic Whiteboard Revenue (billion) Forecast, by Application 2020 & 2033
- Table 46: Rest of Asia Pacific Interactive Electronic Whiteboard Revenue (billion) Forecast, by Application 2020 & 2033
Frequently Asked Questions
1. What is the projected Compound Annual Growth Rate (CAGR) of the Interactive Electronic Whiteboard?
The projected CAGR is approximately 9.7%.
2. Which companies are prominent players in the Interactive Electronic Whiteboard?
Key companies in the market include SMART Technologies (Foxconn), PLUS Corporation, Promethean, Turning Technologies, Panasonic, Ricoh, Hitevision, Julong, Returnstar, INTECH, Haiya, Hitachi, Changhong, Genee, Seewo.
3. What are the main segments of the Interactive Electronic Whiteboard?
The market segments include Application, Types.
4. Can you provide details about the market size?
The market size is estimated to be USD 5.6 billion as of 2022.
5. What are some drivers contributing to market growth?
N/A
6. What are the notable trends driving market growth?
N/A
7. Are there any restraints impacting market growth?
N/A
8. Can you provide examples of recent developments in the market?
N/A
9. What pricing options are available for accessing the report?
Pricing options include single-user, multi-user, and enterprise licenses priced at USD 2900.00, USD 4350.00, and USD 5800.00 respectively.
10. Is the market size provided in terms of value or volume?
The market size is provided in terms of value, measured in billion.
11. Are there any specific market keywords associated with the report?
Yes, the market keyword associated with the report is "Interactive Electronic Whiteboard," which aids in identifying and referencing the specific market segment covered.
12. How do I determine which pricing option suits my needs best?
The pricing options vary based on user requirements and access needs. Individual users may opt for single-user licenses, while businesses requiring broader access may choose multi-user or enterprise licenses for cost-effective access to the report.
13. Are there any additional resources or data provided in the Interactive Electronic Whiteboard report?
While the report offers comprehensive insights, it's advisable to review the specific contents or supplementary materials provided to ascertain if additional resources or data are available.
14. How can I stay updated on further developments or reports in the Interactive Electronic Whiteboard?
To stay informed about further developments, trends, and reports in the Interactive Electronic Whiteboard, consider subscribing to industry newsletters, following relevant companies and organizations, or regularly checking reputable industry news sources and publications.
Methodology
Step 1 - Identification of Relevant Samples Size from Population Database


Step 2 - Approaches for Defining Global Market Size (Value, Volume* & Price*)

Note*: In applicable scenarios
Step 3 - Data Sources
Primary Research
- Web Analytics
- Survey Reports
- Research Institute
- Latest Research Reports
- Opinion Leaders
Secondary Research
- Annual Reports
- White Paper
- Latest Press Release
- Industry Association
- Paid Database
- Investor Presentations

Step 4 - Data Triangulation
Involves using different sources of information in order to increase the validity of a study
These sources are likely to be stakeholders in a program - participants, other researchers, program staff, other community members, and so on.
Then we put all data in single framework & apply various statistical tools to find out the dynamic on the market.
During the analysis stage, feedback from the stakeholder groups would be compared to determine areas of agreement as well as areas of divergence