

Key Insights
The Low Earth Orbit (LEO) satellite market is demonstrating substantial growth, propelled by escalating demand for high-bandwidth communications, advanced Earth observation, precise navigation, and expanding space-based research. With a projected Compound Annual Growth Rate (CAGR) of 11.9%, the market is anticipated to reach a significant valuation. Key application segments driving this expansion include communication, benefiting from reduced latency and enhanced signal quality; Earth observation, leveraging LEO's proximity for high-resolution imagery; and navigation, with improved positioning accuracy. Segmentation by satellite mass indicates that the 100-500kg and 500-1000kg categories are likely to dominate due to their payload capacity. End-user segments, including commercial entities (IoT, broadband, Earth imaging) and military & government (surveillance, reconnaissance, secure communication), are pivotal growth drivers. Advancements in propulsion systems are contributing to cost efficiency and extended satellite lifespans. Intense competition among established aerospace firms and emerging new space companies fosters innovation and the development of cost-effective LEO satellite technologies.
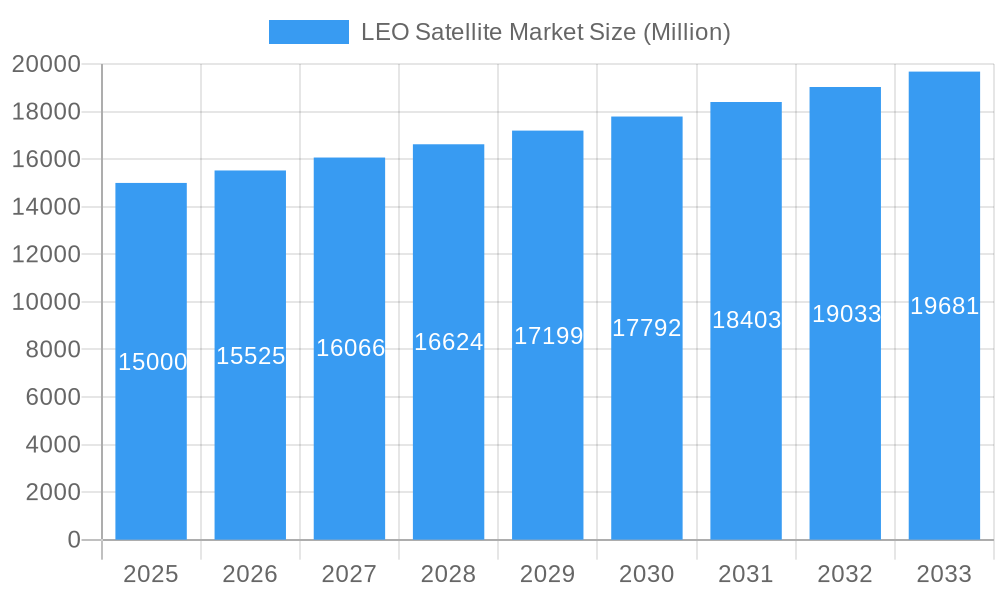
LEO Satellite Market Market Size (In Billion)
The LEO satellite market is projected to grow from an estimated $11.81 billion in the base year of 2025 to a substantial size by 2033. This trajectory is supported by continuous investment in LEO constellations, rapid technological progress, and increasing demand across various sectors. Potential restraints include evolving regulatory landscapes, space debris mitigation challenges, and the necessity for robust infrastructure to support the burgeoning LEO satellite population. However, the inherent advantages of LEO satellites position the market for sustained expansion, driven by ongoing innovation and escalating demand for space-based services.
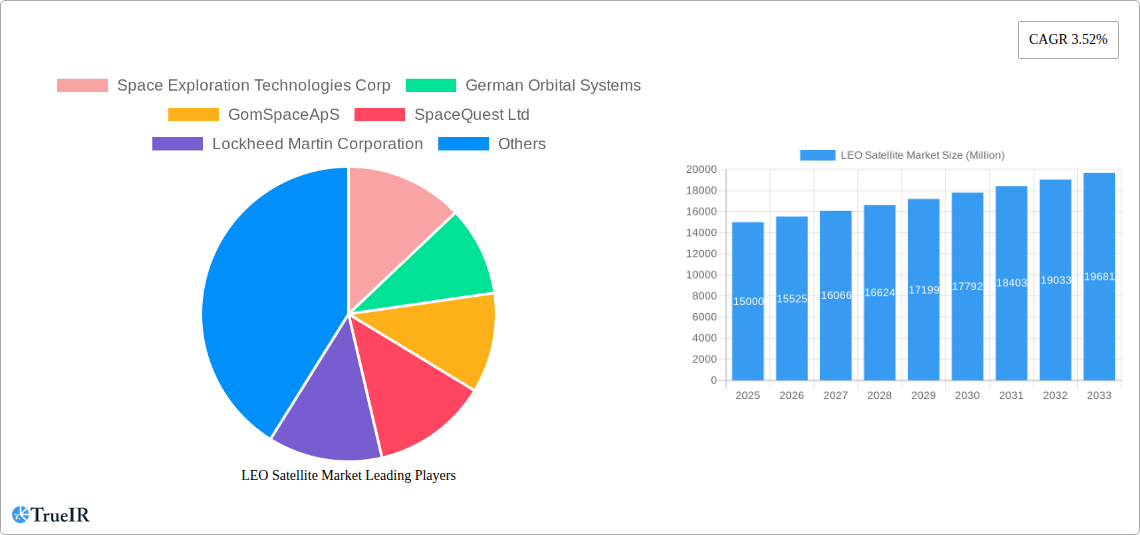
LEO Satellite Market Company Market Share
LEO Satellite Market: A Comprehensive Market Report (2019-2033)
This dynamic report provides a thorough analysis of the Low Earth Orbit (LEO) Satellite market, offering invaluable insights for investors, industry professionals, and strategic decision-makers. With a comprehensive study period spanning from 2019 to 2033 (Base Year: 2025, Forecast Period: 2025-2033), this report leverages extensive data analysis to project market trends and identify lucrative opportunities.
LEO Satellite Market Market Structure & Competitive Landscape
The LEO satellite market exhibits a moderately concentrated structure, with several key players dominating various segments. The market concentration ratio (CR5) is estimated at xx% in 2025, indicating a relatively oligopolistic landscape. Innovation is a key driver, fueled by advancements in miniaturization, propulsion technology, and data analytics. Regulatory frameworks, particularly regarding spectrum allocation and launch licenses, significantly impact market dynamics. Product substitutes, such as terrestrial communication networks and high-altitude platforms, present competitive pressures. The market is segmented by end-user (Commercial, Military & Government, Other), further influencing competitive dynamics. M&A activity has been significant, with xx deals recorded between 2019 and 2024, totaling an estimated value of $xx Million. This activity reflects consolidation efforts and the pursuit of technological expertise and market share.
- Key Players: Space Exploration Technologies Corp, Lockheed Martin Corporation, Airbus SE, Planet Labs Inc, China Aerospace Science and Technology Corporation (CASC), ROSCOSMOS, Surrey Satellite Technology Ltd, GomSpace ApS, German Orbital Systems, Nano Avionics, Astrocast, SpaceQuest Ltd.
- Market Concentration: CR5 estimated at xx% in 2025.
- M&A Activity: xx deals between 2019 and 2024, totaling $xx Million.
LEO Satellite Market Market Trends & Opportunities
The global LEO satellite market is experiencing robust growth, with a projected CAGR of xx% during the forecast period (2025-2033). This expansion is driven by increasing demand for high-bandwidth communication, advanced Earth observation capabilities, and precise navigation solutions. Technological advancements, such as the miniaturization of satellites and the development of efficient propulsion systems, are further fueling market expansion. Consumer preference is shifting towards reliable and affordable satellite-based services, creating substantial market opportunities. Intense competition among established players and new entrants is stimulating innovation and driving down costs. Market penetration rates are expected to increase significantly across various segments, particularly in the commercial sector, driven by the growing adoption of IoT and the expansion of global connectivity. The market size is expected to reach $xx Million by 2033.
Dominant Markets & Segments in LEO Satellite Market
The North American region currently dominates the LEO satellite market, driven by strong government support, robust private sector investment, and a well-established space infrastructure. However, the Asia-Pacific region is projected to exhibit the highest growth rate during the forecast period, propelled by rapid economic development and increasing demand for communication and Earth observation services.
- Dominant Application Segment: Communication (holding xx% of the market in 2025)
- Fastest Growing Application Segment: Earth Observation
- Leading Satellite Mass Segment: 10-100kg
- Key End-User: Commercial, followed by Military & Government
- Dominant Propulsion Technology: Electric propulsion systems are gaining traction due to their efficiency and cost-effectiveness.
- Growth Drivers:
- Increasing demand for high-bandwidth communication
- Enhanced Earth observation capabilities for various applications
- Government initiatives and funding
- Technological advancements in satellite miniaturization and propulsion.
LEO Satellite Market Product Analysis
Product innovations in the LEO satellite market are focused on improving satellite performance, reducing costs, and enhancing functionalities. Advancements in miniaturization, improved sensor technology, and the development of more efficient propulsion systems are driving product differentiation and competitive advantages. The integration of Artificial Intelligence and Machine Learning algorithms for data processing and analysis is transforming the capabilities of LEO satellites, leading to more precise and efficient services across diverse applications.
Key Drivers, Barriers & Challenges in LEO Satellite Market
Key Drivers: Technological advancements (miniaturization, improved sensors), increasing demand for high-bandwidth communication and data, government initiatives promoting space exploration and commercialization, and the growth of IoT are key drivers.
Challenges: Regulatory complexities surrounding spectrum allocation and launch permissions, supply chain constraints related to component availability and manufacturing capacity, and intense competition among numerous players present significant hurdles. Increased launch costs and potential for space debris accumulation also pose challenges.
Growth Drivers in the LEO Satellite Market Market
Technological innovation, including miniaturization and enhanced data processing capabilities, is a major driver. Government initiatives promoting space exploration and commercialization, alongside the burgeoning IoT and Big Data sectors, create significant demand. The need for improved global communication and Earth observation capabilities fuels market growth.
Challenges Impacting LEO Satellite Market Growth
Regulatory hurdles, including complex licensing procedures and spectrum allocation challenges, hinder market expansion. Supply chain bottlenecks, especially concerning specialized components, can cause delays and cost increases. Intense competition amongst various players necessitates continuous innovation and efficiency improvements to maintain market share.
Key Players Shaping the LEO Satellite Market Market
- Space Exploration Technologies Corp
- German Orbital Systems
- GomSpace ApS
- SpaceQuest Ltd
- Lockheed Martin Corporation
- Airbus SE
- Astrocast
- Nano Avionics
- China Aerospace Science and Technology Corporation (CASC)
- Surrey Satellite Technology Ltd
- ROSCOSMOS
- Planet Labs Inc
Significant LEO Satellite Market Industry Milestones
- January 2022: Planet Labs launches 44 SuperDove satellites on SpaceX's Falcon 9 rocket, significantly expanding its Earth observation constellation and data collection capabilities.
- November 2021: Planet Labs' acquisition of VanderSat for approximately $28 Million enhances its Earth observation data analysis capabilities through advanced algorithms and data integration.
- January 2021: Astrocast launches 5 satellites, expanding its network for data collection from remote sensors and enhancing its IoT capabilities.
Future Outlook for LEO Satellite Market Market
The LEO satellite market is poised for substantial growth, driven by continued technological advancements, increasing demand for various applications, and supportive government policies. Strategic partnerships and collaborations among industry players are likely to accelerate innovation and market expansion. The market is expected to witness an influx of new players and services, further enhancing its dynamism and creating exciting opportunities for both established and emerging companies. The potential for new applications, particularly in the areas of AI-powered analytics and advanced communication services, further strengthens the market’s long-term outlook.
LEO Satellite Market Segmentation
-
1. Application
- 1.1. Communication
- 1.2. Earth Observation
- 1.3. Navigation
- 1.4. Space Observation
- 1.5. Others
-
2. Satellite Mass
- 2.1. 10-100kg
- 2.2. 100-500kg
- 2.3. 500-1000kg
- 2.4. Below 10 Kg
- 2.5. above 1000kg
-
3. End User
- 3.1. Commercial
- 3.2. Military & Government
- 3.3. Other
-
4. Propulsion Tech
- 4.1. Electric
- 4.2. Gas based
- 4.3. Liquid Fuel
LEO Satellite Market Segmentation By Geography
-
1. North America
- 1.1. United States
- 1.2. Canada
- 1.3. Mexico
-
2. South America
- 2.1. Brazil
- 2.2. Argentina
- 2.3. Rest of South America
-
3. Europe
- 3.1. United Kingdom
- 3.2. Germany
- 3.3. France
- 3.4. Italy
- 3.5. Spain
- 3.6. Russia
- 3.7. Benelux
- 3.8. Nordics
- 3.9. Rest of Europe
-
4. Middle East & Africa
- 4.1. Turkey
- 4.2. Israel
- 4.3. GCC
- 4.4. North Africa
- 4.5. South Africa
- 4.6. Rest of Middle East & Africa
-
5. Asia Pacific
- 5.1. China
- 5.2. India
- 5.3. Japan
- 5.4. South Korea
- 5.5. ASEAN
- 5.6. Oceania
- 5.7. Rest of Asia Pacific
LEO Satellite Market Regional Market Share
Geographic Coverage of LEO Satellite Market
LEO Satellite Market REPORT HIGHLIGHTS
| Aspects | Details |
|---|---|
| Study Period | 2020-2034 |
| Base Year | 2025 |
| Estimated Year | 2026 |
| Forecast Period | 2026-2034 |
| Historical Period | 2020-2025 |
| Growth Rate | CAGR of 11.9% from 2020-2034 |
| Segmentation |
|
Table of Contents
- 1. Introduction
- 1.1. Research Scope
- 1.2. Market Segmentation
- 1.3. Research Objective
- 1.4. Definitions and Assumptions
- 2. Executive Summary
- 2.1. Market Snapshot
- 3. Market Dynamics
- 3.1. Market Drivers
- 3.2. Market Restrains
- 3.3. Market Trends
- 3.4. Market Opportunities
- 4. Market Factor Analysis
- 4.1. Porters Five Forces
- 4.1.1. Bargaining Power of Suppliers
- 4.1.2. Bargaining Power of Buyers
- 4.1.3. Threat of New Entrants
- 4.1.4. Threat of Substitutes
- 4.1.5. Competitive Rivalry
- 4.2. PESTEL analysis
- 4.3. BCG Analysis
- 4.3.1. Stars (High Growth, High Market Share)
- 4.3.2. Cash Cows (Low Growth, High Market Share)
- 4.3.3. Question Mark (High Growth, Low Market Share)
- 4.3.4. Dogs (Low Growth, Low Market Share)
- 4.4. Ansoff Matrix Analysis
- 4.5. Supply Chain Analysis
- 4.6. Regulatory Landscape
- 4.7. Current Market Potential and Opportunity Assessment (TAM–SAM–SOM Framework)
- 4.8. TIR Analyst Note
- 4.1. Porters Five Forces
- 5. Market Analysis, Insights and Forecast 2021-2033
- 5.1. Market Analysis, Insights and Forecast - by Application
- 5.1.1. Communication
- 5.1.2. Earth Observation
- 5.1.3. Navigation
- 5.1.4. Space Observation
- 5.1.5. Others
- 5.2. Market Analysis, Insights and Forecast - by Satellite Mass
- 5.2.1. 10-100kg
- 5.2.2. 100-500kg
- 5.2.3. 500-1000kg
- 5.2.4. Below 10 Kg
- 5.2.5. above 1000kg
- 5.3. Market Analysis, Insights and Forecast - by End User
- 5.3.1. Commercial
- 5.3.2. Military & Government
- 5.3.3. Other
- 5.4. Market Analysis, Insights and Forecast - by Propulsion Tech
- 5.4.1. Electric
- 5.4.2. Gas based
- 5.4.3. Liquid Fuel
- 5.5. Market Analysis, Insights and Forecast - by Region
- 5.5.1. North America
- 5.5.2. South America
- 5.5.3. Europe
- 5.5.4. Middle East & Africa
- 5.5.5. Asia Pacific
- 5.1. Market Analysis, Insights and Forecast - by Application
- 6. Global LEO Satellite Market Analysis, Insights and Forecast, 2021-2033
- 6.1. Market Analysis, Insights and Forecast - by Application
- 6.1.1. Communication
- 6.1.2. Earth Observation
- 6.1.3. Navigation
- 6.1.4. Space Observation
- 6.1.5. Others
- 6.2. Market Analysis, Insights and Forecast - by Satellite Mass
- 6.2.1. 10-100kg
- 6.2.2. 100-500kg
- 6.2.3. 500-1000kg
- 6.2.4. Below 10 Kg
- 6.2.5. above 1000kg
- 6.3. Market Analysis, Insights and Forecast - by End User
- 6.3.1. Commercial
- 6.3.2. Military & Government
- 6.3.3. Other
- 6.4. Market Analysis, Insights and Forecast - by Propulsion Tech
- 6.4.1. Electric
- 6.4.2. Gas based
- 6.4.3. Liquid Fuel
- 6.1. Market Analysis, Insights and Forecast - by Application
- 7. North America LEO Satellite Market Analysis, Insights and Forecast, 2020-2032
- 7.1. Market Analysis, Insights and Forecast - by Application
- 7.1.1. Communication
- 7.1.2. Earth Observation
- 7.1.3. Navigation
- 7.1.4. Space Observation
- 7.1.5. Others
- 7.2. Market Analysis, Insights and Forecast - by Satellite Mass
- 7.2.1. 10-100kg
- 7.2.2. 100-500kg
- 7.2.3. 500-1000kg
- 7.2.4. Below 10 Kg
- 7.2.5. above 1000kg
- 7.3. Market Analysis, Insights and Forecast - by End User
- 7.3.1. Commercial
- 7.3.2. Military & Government
- 7.3.3. Other
- 7.4. Market Analysis, Insights and Forecast - by Propulsion Tech
- 7.4.1. Electric
- 7.4.2. Gas based
- 7.4.3. Liquid Fuel
- 7.1. Market Analysis, Insights and Forecast - by Application
- 8. South America LEO Satellite Market Analysis, Insights and Forecast, 2020-2032
- 8.1. Market Analysis, Insights and Forecast - by Application
- 8.1.1. Communication
- 8.1.2. Earth Observation
- 8.1.3. Navigation
- 8.1.4. Space Observation
- 8.1.5. Others
- 8.2. Market Analysis, Insights and Forecast - by Satellite Mass
- 8.2.1. 10-100kg
- 8.2.2. 100-500kg
- 8.2.3. 500-1000kg
- 8.2.4. Below 10 Kg
- 8.2.5. above 1000kg
- 8.3. Market Analysis, Insights and Forecast - by End User
- 8.3.1. Commercial
- 8.3.2. Military & Government
- 8.3.3. Other
- 8.4. Market Analysis, Insights and Forecast - by Propulsion Tech
- 8.4.1. Electric
- 8.4.2. Gas based
- 8.4.3. Liquid Fuel
- 8.1. Market Analysis, Insights and Forecast - by Application
- 9. Europe LEO Satellite Market Analysis, Insights and Forecast, 2020-2032
- 9.1. Market Analysis, Insights and Forecast - by Application
- 9.1.1. Communication
- 9.1.2. Earth Observation
- 9.1.3. Navigation
- 9.1.4. Space Observation
- 9.1.5. Others
- 9.2. Market Analysis, Insights and Forecast - by Satellite Mass
- 9.2.1. 10-100kg
- 9.2.2. 100-500kg
- 9.2.3. 500-1000kg
- 9.2.4. Below 10 Kg
- 9.2.5. above 1000kg
- 9.3. Market Analysis, Insights and Forecast - by End User
- 9.3.1. Commercial
- 9.3.2. Military & Government
- 9.3.3. Other
- 9.4. Market Analysis, Insights and Forecast - by Propulsion Tech
- 9.4.1. Electric
- 9.4.2. Gas based
- 9.4.3. Liquid Fuel
- 9.1. Market Analysis, Insights and Forecast - by Application
- 10. Middle East & Africa LEO Satellite Market Analysis, Insights and Forecast, 2020-2032
- 10.1. Market Analysis, Insights and Forecast - by Application
- 10.1.1. Communication
- 10.1.2. Earth Observation
- 10.1.3. Navigation
- 10.1.4. Space Observation
- 10.1.5. Others
- 10.2. Market Analysis, Insights and Forecast - by Satellite Mass
- 10.2.1. 10-100kg
- 10.2.2. 100-500kg
- 10.2.3. 500-1000kg
- 10.2.4. Below 10 Kg
- 10.2.5. above 1000kg
- 10.3. Market Analysis, Insights and Forecast - by End User
- 10.3.1. Commercial
- 10.3.2. Military & Government
- 10.3.3. Other
- 10.4. Market Analysis, Insights and Forecast - by Propulsion Tech
- 10.4.1. Electric
- 10.4.2. Gas based
- 10.4.3. Liquid Fuel
- 10.1. Market Analysis, Insights and Forecast - by Application
- 11. Asia Pacific LEO Satellite Market Analysis, Insights and Forecast, 2020-2032
- 11.1. Market Analysis, Insights and Forecast - by Application
- 11.1.1. Communication
- 11.1.2. Earth Observation
- 11.1.3. Navigation
- 11.1.4. Space Observation
- 11.1.5. Others
- 11.2. Market Analysis, Insights and Forecast - by Satellite Mass
- 11.2.1. 10-100kg
- 11.2.2. 100-500kg
- 11.2.3. 500-1000kg
- 11.2.4. Below 10 Kg
- 11.2.5. above 1000kg
- 11.3. Market Analysis, Insights and Forecast - by End User
- 11.3.1. Commercial
- 11.3.2. Military & Government
- 11.3.3. Other
- 11.4. Market Analysis, Insights and Forecast - by Propulsion Tech
- 11.4.1. Electric
- 11.4.2. Gas based
- 11.4.3. Liquid Fuel
- 11.1. Market Analysis, Insights and Forecast - by Application
- 12. Competitive Analysis
- 12.1. Company Profiles
- 12.1.1 Space Exploration Technologies Corp
- 12.1.1.1. Company Overview
- 12.1.1.2. Products
- 12.1.1.3. Company Financials
- 12.1.1.4. SWOT Analysis
- 12.1.2 German Orbital Systems
- 12.1.2.1. Company Overview
- 12.1.2.2. Products
- 12.1.2.3. Company Financials
- 12.1.2.4. SWOT Analysis
- 12.1.3 GomSpaceApS
- 12.1.3.1. Company Overview
- 12.1.3.2. Products
- 12.1.3.3. Company Financials
- 12.1.3.4. SWOT Analysis
- 12.1.4 SpaceQuest Ltd
- 12.1.4.1. Company Overview
- 12.1.4.2. Products
- 12.1.4.3. Company Financials
- 12.1.4.4. SWOT Analysis
- 12.1.5 Lockheed Martin Corporation
- 12.1.5.1. Company Overview
- 12.1.5.2. Products
- 12.1.5.3. Company Financials
- 12.1.5.4. SWOT Analysis
- 12.1.6 Airbus SE
- 12.1.6.1. Company Overview
- 12.1.6.2. Products
- 12.1.6.3. Company Financials
- 12.1.6.4. SWOT Analysis
- 12.1.7 Astrocast
- 12.1.7.1. Company Overview
- 12.1.7.2. Products
- 12.1.7.3. Company Financials
- 12.1.7.4. SWOT Analysis
- 12.1.8 Nano Avionics
- 12.1.8.1. Company Overview
- 12.1.8.2. Products
- 12.1.8.3. Company Financials
- 12.1.8.4. SWOT Analysis
- 12.1.9 China Aerospace Science and Technology Corporation (CASC)
- 12.1.9.1. Company Overview
- 12.1.9.2. Products
- 12.1.9.3. Company Financials
- 12.1.9.4. SWOT Analysis
- 12.1.10 Surrey Satellite Technology Ltd
- 12.1.10.1. Company Overview
- 12.1.10.2. Products
- 12.1.10.3. Company Financials
- 12.1.10.4. SWOT Analysis
- 12.1.11 ROSCOSMOS
- 12.1.11.1. Company Overview
- 12.1.11.2. Products
- 12.1.11.3. Company Financials
- 12.1.11.4. SWOT Analysis
- 12.1.12 Planet Labs Inc
- 12.1.12.1. Company Overview
- 12.1.12.2. Products
- 12.1.12.3. Company Financials
- 12.1.12.4. SWOT Analysis
- 12.1.1 Space Exploration Technologies Corp
- 12.2. Market Entropy
- 12.2.1 Company's Key Areas Served
- 12.2.2 Recent Developments
- 12.3. Company Market Share Analysis 2025
- 12.3.1 Top 5 Companies Market Share Analysis
- 12.3.2 Top 3 Companies Market Share Analysis
- 12.4. List of Potential Customers
- 13. Research Methodology
List of Figures
- Figure 1: Global LEO Satellite Market Revenue Breakdown (billion, %) by Region 2025 & 2033
- Figure 2: North America LEO Satellite Market Revenue (billion), by Application 2025 & 2033
- Figure 3: North America LEO Satellite Market Revenue Share (%), by Application 2025 & 2033
- Figure 4: North America LEO Satellite Market Revenue (billion), by Satellite Mass 2025 & 2033
- Figure 5: North America LEO Satellite Market Revenue Share (%), by Satellite Mass 2025 & 2033
- Figure 6: North America LEO Satellite Market Revenue (billion), by End User 2025 & 2033
- Figure 7: North America LEO Satellite Market Revenue Share (%), by End User 2025 & 2033
- Figure 8: North America LEO Satellite Market Revenue (billion), by Propulsion Tech 2025 & 2033
- Figure 9: North America LEO Satellite Market Revenue Share (%), by Propulsion Tech 2025 & 2033
- Figure 10: North America LEO Satellite Market Revenue (billion), by Country 2025 & 2033
- Figure 11: North America LEO Satellite Market Revenue Share (%), by Country 2025 & 2033
- Figure 12: South America LEO Satellite Market Revenue (billion), by Application 2025 & 2033
- Figure 13: South America LEO Satellite Market Revenue Share (%), by Application 2025 & 2033
- Figure 14: South America LEO Satellite Market Revenue (billion), by Satellite Mass 2025 & 2033
- Figure 15: South America LEO Satellite Market Revenue Share (%), by Satellite Mass 2025 & 2033
- Figure 16: South America LEO Satellite Market Revenue (billion), by End User 2025 & 2033
- Figure 17: South America LEO Satellite Market Revenue Share (%), by End User 2025 & 2033
- Figure 18: South America LEO Satellite Market Revenue (billion), by Propulsion Tech 2025 & 2033
- Figure 19: South America LEO Satellite Market Revenue Share (%), by Propulsion Tech 2025 & 2033
- Figure 20: South America LEO Satellite Market Revenue (billion), by Country 2025 & 2033
- Figure 21: South America LEO Satellite Market Revenue Share (%), by Country 2025 & 2033
- Figure 22: Europe LEO Satellite Market Revenue (billion), by Application 2025 & 2033
- Figure 23: Europe LEO Satellite Market Revenue Share (%), by Application 2025 & 2033
- Figure 24: Europe LEO Satellite Market Revenue (billion), by Satellite Mass 2025 & 2033
- Figure 25: Europe LEO Satellite Market Revenue Share (%), by Satellite Mass 2025 & 2033
- Figure 26: Europe LEO Satellite Market Revenue (billion), by End User 2025 & 2033
- Figure 27: Europe LEO Satellite Market Revenue Share (%), by End User 2025 & 2033
- Figure 28: Europe LEO Satellite Market Revenue (billion), by Propulsion Tech 2025 & 2033
- Figure 29: Europe LEO Satellite Market Revenue Share (%), by Propulsion Tech 2025 & 2033
- Figure 30: Europe LEO Satellite Market Revenue (billion), by Country 2025 & 2033
- Figure 31: Europe LEO Satellite Market Revenue Share (%), by Country 2025 & 2033
- Figure 32: Middle East & Africa LEO Satellite Market Revenue (billion), by Application 2025 & 2033
- Figure 33: Middle East & Africa LEO Satellite Market Revenue Share (%), by Application 2025 & 2033
- Figure 34: Middle East & Africa LEO Satellite Market Revenue (billion), by Satellite Mass 2025 & 2033
- Figure 35: Middle East & Africa LEO Satellite Market Revenue Share (%), by Satellite Mass 2025 & 2033
- Figure 36: Middle East & Africa LEO Satellite Market Revenue (billion), by End User 2025 & 2033
- Figure 37: Middle East & Africa LEO Satellite Market Revenue Share (%), by End User 2025 & 2033
- Figure 38: Middle East & Africa LEO Satellite Market Revenue (billion), by Propulsion Tech 2025 & 2033
- Figure 39: Middle East & Africa LEO Satellite Market Revenue Share (%), by Propulsion Tech 2025 & 2033
- Figure 40: Middle East & Africa LEO Satellite Market Revenue (billion), by Country 2025 & 2033
- Figure 41: Middle East & Africa LEO Satellite Market Revenue Share (%), by Country 2025 & 2033
- Figure 42: Asia Pacific LEO Satellite Market Revenue (billion), by Application 2025 & 2033
- Figure 43: Asia Pacific LEO Satellite Market Revenue Share (%), by Application 2025 & 2033
- Figure 44: Asia Pacific LEO Satellite Market Revenue (billion), by Satellite Mass 2025 & 2033
- Figure 45: Asia Pacific LEO Satellite Market Revenue Share (%), by Satellite Mass 2025 & 2033
- Figure 46: Asia Pacific LEO Satellite Market Revenue (billion), by End User 2025 & 2033
- Figure 47: Asia Pacific LEO Satellite Market Revenue Share (%), by End User 2025 & 2033
- Figure 48: Asia Pacific LEO Satellite Market Revenue (billion), by Propulsion Tech 2025 & 2033
- Figure 49: Asia Pacific LEO Satellite Market Revenue Share (%), by Propulsion Tech 2025 & 2033
- Figure 50: Asia Pacific LEO Satellite Market Revenue (billion), by Country 2025 & 2033
- Figure 51: Asia Pacific LEO Satellite Market Revenue Share (%), by Country 2025 & 2033
List of Tables
- Table 1: Global LEO Satellite Market Revenue billion Forecast, by Application 2020 & 2033
- Table 2: Global LEO Satellite Market Revenue billion Forecast, by Satellite Mass 2020 & 2033
- Table 3: Global LEO Satellite Market Revenue billion Forecast, by End User 2020 & 2033
- Table 4: Global LEO Satellite Market Revenue billion Forecast, by Propulsion Tech 2020 & 2033
- Table 5: Global LEO Satellite Market Revenue billion Forecast, by Region 2020 & 2033
- Table 6: Global LEO Satellite Market Revenue billion Forecast, by Application 2020 & 2033
- Table 7: Global LEO Satellite Market Revenue billion Forecast, by Satellite Mass 2020 & 2033
- Table 8: Global LEO Satellite Market Revenue billion Forecast, by End User 2020 & 2033
- Table 9: Global LEO Satellite Market Revenue billion Forecast, by Propulsion Tech 2020 & 2033
- Table 10: Global LEO Satellite Market Revenue billion Forecast, by Country 2020 & 2033
- Table 11: United States LEO Satellite Market Revenue (billion) Forecast, by Application 2020 & 2033
- Table 12: Canada LEO Satellite Market Revenue (billion) Forecast, by Application 2020 & 2033
- Table 13: Mexico LEO Satellite Market Revenue (billion) Forecast, by Application 2020 & 2033
- Table 14: Global LEO Satellite Market Revenue billion Forecast, by Application 2020 & 2033
- Table 15: Global LEO Satellite Market Revenue billion Forecast, by Satellite Mass 2020 & 2033
- Table 16: Global LEO Satellite Market Revenue billion Forecast, by End User 2020 & 2033
- Table 17: Global LEO Satellite Market Revenue billion Forecast, by Propulsion Tech 2020 & 2033
- Table 18: Global LEO Satellite Market Revenue billion Forecast, by Country 2020 & 2033
- Table 19: Brazil LEO Satellite Market Revenue (billion) Forecast, by Application 2020 & 2033
- Table 20: Argentina LEO Satellite Market Revenue (billion) Forecast, by Application 2020 & 2033
- Table 21: Rest of South America LEO Satellite Market Revenue (billion) Forecast, by Application 2020 & 2033
- Table 22: Global LEO Satellite Market Revenue billion Forecast, by Application 2020 & 2033
- Table 23: Global LEO Satellite Market Revenue billion Forecast, by Satellite Mass 2020 & 2033
- Table 24: Global LEO Satellite Market Revenue billion Forecast, by End User 2020 & 2033
- Table 25: Global LEO Satellite Market Revenue billion Forecast, by Propulsion Tech 2020 & 2033
- Table 26: Global LEO Satellite Market Revenue billion Forecast, by Country 2020 & 2033
- Table 27: United Kingdom LEO Satellite Market Revenue (billion) Forecast, by Application 2020 & 2033
- Table 28: Germany LEO Satellite Market Revenue (billion) Forecast, by Application 2020 & 2033
- Table 29: France LEO Satellite Market Revenue (billion) Forecast, by Application 2020 & 2033
- Table 30: Italy LEO Satellite Market Revenue (billion) Forecast, by Application 2020 & 2033
- Table 31: Spain LEO Satellite Market Revenue (billion) Forecast, by Application 2020 & 2033
- Table 32: Russia LEO Satellite Market Revenue (billion) Forecast, by Application 2020 & 2033
- Table 33: Benelux LEO Satellite Market Revenue (billion) Forecast, by Application 2020 & 2033
- Table 34: Nordics LEO Satellite Market Revenue (billion) Forecast, by Application 2020 & 2033
- Table 35: Rest of Europe LEO Satellite Market Revenue (billion) Forecast, by Application 2020 & 2033
- Table 36: Global LEO Satellite Market Revenue billion Forecast, by Application 2020 & 2033
- Table 37: Global LEO Satellite Market Revenue billion Forecast, by Satellite Mass 2020 & 2033
- Table 38: Global LEO Satellite Market Revenue billion Forecast, by End User 2020 & 2033
- Table 39: Global LEO Satellite Market Revenue billion Forecast, by Propulsion Tech 2020 & 2033
- Table 40: Global LEO Satellite Market Revenue billion Forecast, by Country 2020 & 2033
- Table 41: Turkey LEO Satellite Market Revenue (billion) Forecast, by Application 2020 & 2033
- Table 42: Israel LEO Satellite Market Revenue (billion) Forecast, by Application 2020 & 2033
- Table 43: GCC LEO Satellite Market Revenue (billion) Forecast, by Application 2020 & 2033
- Table 44: North Africa LEO Satellite Market Revenue (billion) Forecast, by Application 2020 & 2033
- Table 45: South Africa LEO Satellite Market Revenue (billion) Forecast, by Application 2020 & 2033
- Table 46: Rest of Middle East & Africa LEO Satellite Market Revenue (billion) Forecast, by Application 2020 & 2033
- Table 47: Global LEO Satellite Market Revenue billion Forecast, by Application 2020 & 2033
- Table 48: Global LEO Satellite Market Revenue billion Forecast, by Satellite Mass 2020 & 2033
- Table 49: Global LEO Satellite Market Revenue billion Forecast, by End User 2020 & 2033
- Table 50: Global LEO Satellite Market Revenue billion Forecast, by Propulsion Tech 2020 & 2033
- Table 51: Global LEO Satellite Market Revenue billion Forecast, by Country 2020 & 2033
- Table 52: China LEO Satellite Market Revenue (billion) Forecast, by Application 2020 & 2033
- Table 53: India LEO Satellite Market Revenue (billion) Forecast, by Application 2020 & 2033
- Table 54: Japan LEO Satellite Market Revenue (billion) Forecast, by Application 2020 & 2033
- Table 55: South Korea LEO Satellite Market Revenue (billion) Forecast, by Application 2020 & 2033
- Table 56: ASEAN LEO Satellite Market Revenue (billion) Forecast, by Application 2020 & 2033
- Table 57: Oceania LEO Satellite Market Revenue (billion) Forecast, by Application 2020 & 2033
- Table 58: Rest of Asia Pacific LEO Satellite Market Revenue (billion) Forecast, by Application 2020 & 2033
Frequently Asked Questions
1. What is the projected Compound Annual Growth Rate (CAGR) of the LEO Satellite Market?
The projected CAGR is approximately 11.9%.
2. Which companies are prominent players in the LEO Satellite Market?
Key companies in the market include Space Exploration Technologies Corp, German Orbital Systems, GomSpaceApS, SpaceQuest Ltd, Lockheed Martin Corporation, Airbus SE, Astrocast, Nano Avionics, China Aerospace Science and Technology Corporation (CASC), Surrey Satellite Technology Ltd, ROSCOSMOS, Planet Labs Inc.
3. What are the main segments of the LEO Satellite Market?
The market segments include Application, Satellite Mass, End User, Propulsion Tech.
4. Can you provide details about the market size?
The market size is estimated to be USD 11.81 billion as of 2022.
5. What are some drivers contributing to market growth?
N/A
6. What are the notable trends driving market growth?
North America is driving the market demand with a market share of 85.4% in 2029.
7. Are there any restraints impacting market growth?
N/A
8. Can you provide examples of recent developments in the market?
January 2022: Planet Labs launches 44 SuperDove satellites on SpaceX's Falcon 9 rocketNovember 2021: Planet Labs announced an agreement to acquire VanderSat, a Dutch company that provides data on Earth surface conditions, like soil moisture and land surface temperature, by combining public satellite data with proprietary algorithms, for about $28 million.January 2021: In January 2021, 5 Astrocast satellites were launched to collect and downlink data from weather buoys, wellhead sensors, pollution monitors, and other remote stations.
9. What pricing options are available for accessing the report?
Pricing options include single-user, multi-user, and enterprise licenses priced at USD 3800, USD 4500, and USD 5800 respectively.
10. Is the market size provided in terms of value or volume?
The market size is provided in terms of value, measured in billion.
11. Are there any specific market keywords associated with the report?
Yes, the market keyword associated with the report is "LEO Satellite Market," which aids in identifying and referencing the specific market segment covered.
12. How do I determine which pricing option suits my needs best?
The pricing options vary based on user requirements and access needs. Individual users may opt for single-user licenses, while businesses requiring broader access may choose multi-user or enterprise licenses for cost-effective access to the report.
13. Are there any additional resources or data provided in the LEO Satellite Market report?
While the report offers comprehensive insights, it's advisable to review the specific contents or supplementary materials provided to ascertain if additional resources or data are available.
14. How can I stay updated on further developments or reports in the LEO Satellite Market?
To stay informed about further developments, trends, and reports in the LEO Satellite Market, consider subscribing to industry newsletters, following relevant companies and organizations, or regularly checking reputable industry news sources and publications.
Methodology
Step 1 - Identification of Relevant Samples Size from Population Database


Step 2 - Approaches for Defining Global Market Size (Value, Volume* & Price*)

Note*: In applicable scenarios
Step 3 - Data Sources
Primary Research
- Web Analytics
- Survey Reports
- Research Institute
- Latest Research Reports
- Opinion Leaders
Secondary Research
- Annual Reports
- White Paper
- Latest Press Release
- Industry Association
- Paid Database
- Investor Presentations

Step 4 - Data Triangulation
Involves using different sources of information in order to increase the validity of a study
These sources are likely to be stakeholders in a program - participants, other researchers, program staff, other community members, and so on.
Then we put all data in single framework & apply various statistical tools to find out the dynamic on the market.
During the analysis stage, feedback from the stakeholder groups would be compared to determine areas of agreement as well as areas of divergence