

Key Insights
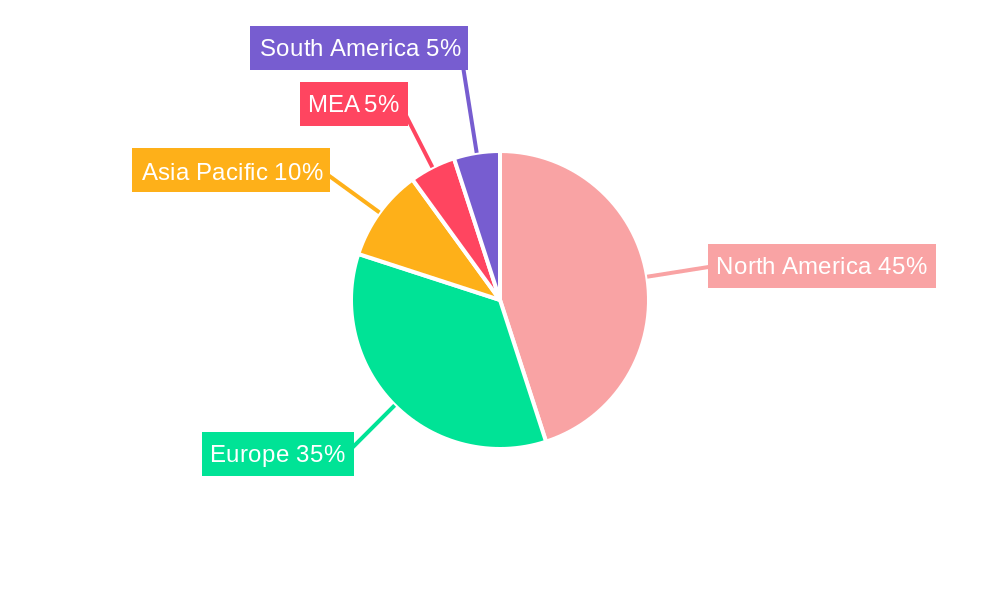
The MEA Portable X-Ray Devices market, while a smaller segment of the global market, exhibits significant growth potential driven by increasing healthcare infrastructure development, rising prevalence of chronic diseases requiring frequent X-ray imaging, and a growing preference for portable devices offering greater patient convenience and accessibility in remote areas. The market's expansion is further fueled by technological advancements leading to lighter, more efficient, and user-friendly portable X-ray systems. This trend is particularly pronounced in countries like Saudi Arabia and the UAE, where healthcare investment is substantial. However, challenges remain, including the relatively high cost of advanced portable X-ray devices, the need for skilled professionals to operate them effectively, and regulatory hurdles related to medical device approvals and safety standards. Despite these challenges, the market is projected to experience healthy growth, driven primarily by the increasing demand for point-of-care diagnostics and the ongoing efforts to improve healthcare access across diverse geographical regions within the MEA region. Factors such as government initiatives promoting healthcare accessibility and the rising adoption of telemedicine further enhance market prospects.
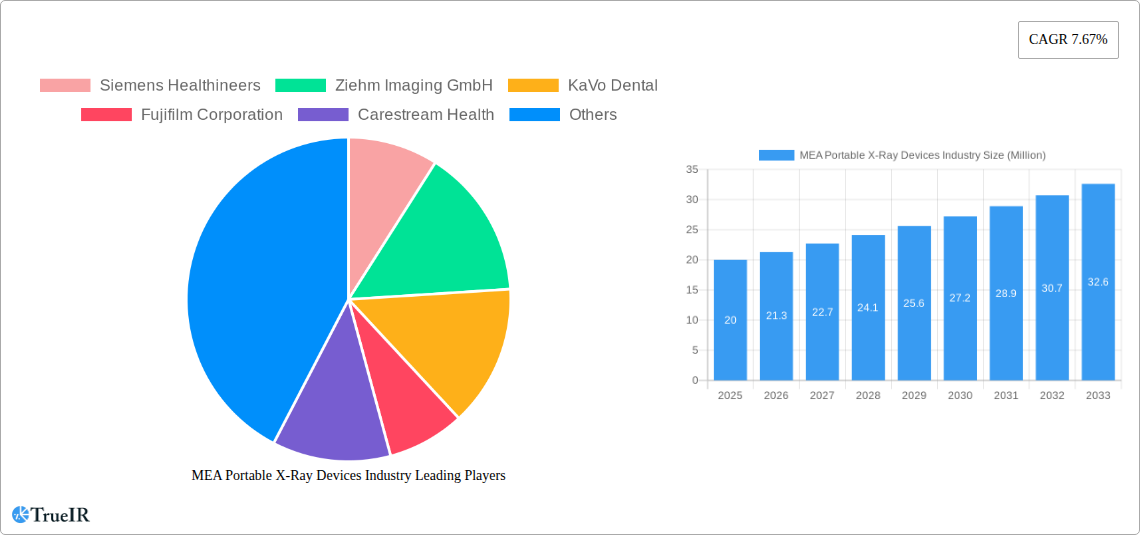
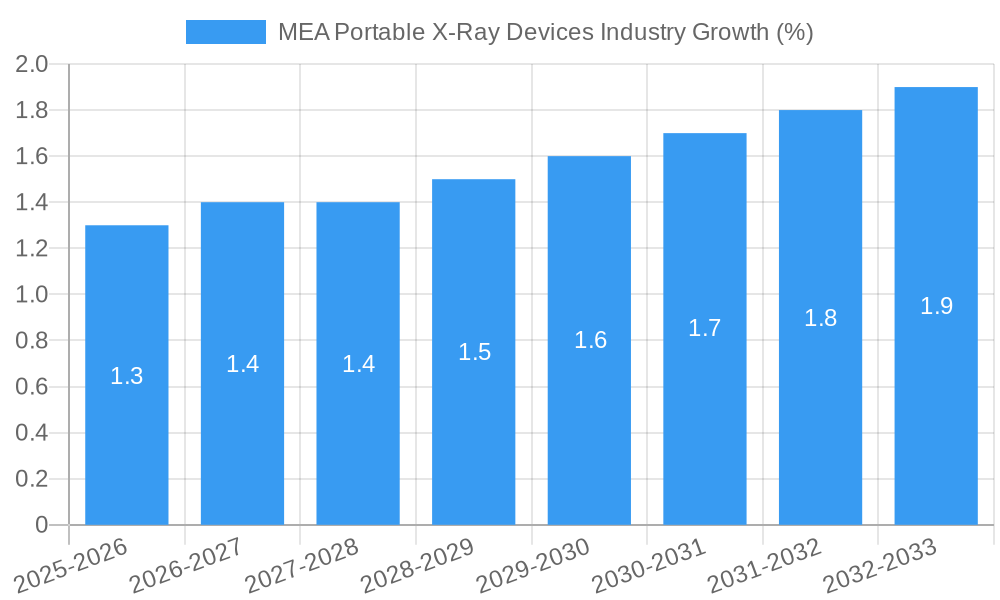
Considering the global market size of $321.39 million and a CAGR of 7.67%, and factoring in the MEA region's unique characteristics, a reasonable estimation for the MEA Portable X-Ray Devices market in 2025 is approximately $20 million. This estimation considers the MEA region's comparatively smaller healthcare market size compared to North America or Europe, but accounts for its rapid development and expanding healthcare infrastructure. Projecting forward, assuming a slightly lower CAGR of 6.5% to account for regional-specific factors, the market size could reach approximately $28 million by 2030, reflecting continued growth and investment in portable X-ray technology within the MEA region. This growth trajectory is sustainable given the increasing demand and the ongoing focus on enhancing healthcare services within the region.
MEA Portable X-Ray Devices Industry Market Report: 2019-2033
This comprehensive report provides an in-depth analysis of the Middle East and Africa (MEA) portable X-ray devices industry, offering valuable insights into market size, growth trends, competitive landscape, and future outlook. The study covers the period 2019-2033, with a focus on the forecast period 2025-2033 and a base year of 2025. The report analyzes various segments, including technology (Analog X-ray, Digital X-ray), application (Dental X-ray, Mammography, Chest X-ray, Abdomen X-ray), and modality (Handheld X-ray Devices, Mobile X-ray Devices). Key players such as Siemens Healthineers, Ziehm Imaging GmbH, KaVo Dental, Fujifilm Corporation, Carestream Health, General Electric Company (GE Healthcare), Koninklijke Philips NV, Canon Medical Systems, and Shimadzu Corporations are profiled. The market is projected to reach xx Million by 2033, exhibiting a CAGR of xx% during the forecast period.
MEA Portable X-Ray Devices Industry Market Structure & Competitive Landscape
The MEA portable X-ray devices market exhibits a moderately concentrated structure, with the top five players holding an estimated xx% market share in 2025. Market concentration is influenced by factors such as technological advancements, regulatory approvals, and the strategic acquisitions and mergers within the industry. The historical period (2019-2024) witnessed xx M&A deals, primarily driven by the desire to expand product portfolios and geographic reach. Innovation is a key driver, with companies investing heavily in developing advanced digital X-ray technologies, including AI-powered image analysis tools. Regulatory frameworks vary across MEA countries, impacting market entry and product approvals. The market faces competition from alternative diagnostic imaging techniques, such as ultrasound and MRI, although portable X-ray devices maintain a strong position due to their portability, cost-effectiveness, and ease of use. End-user segmentation includes hospitals, clinics, dental practices, and mobile healthcare units.
- Market Concentration: Top 5 players hold approximately xx% market share in 2025.
- M&A Activity: xx M&A deals occurred between 2019 and 2024.
- Innovation Drivers: Development of AI-powered image analysis and digital X-ray technologies.
- Regulatory Impacts: Varying regulatory frameworks across MEA countries.
- Product Substitutes: Ultrasound, MRI.
- End-User Segmentation: Hospitals, clinics, dental practices, mobile healthcare units.
MEA Portable X-Ray Devices Industry Market Trends & Opportunities
The MEA portable X-ray devices market is experiencing significant growth, driven by increasing healthcare infrastructure development, rising prevalence of chronic diseases, and growing demand for point-of-care diagnostics. Technological advancements, such as the development of wireless and digital X-ray systems, are enhancing image quality, reducing radiation exposure, and improving workflow efficiency. Consumer preferences are shifting towards smaller, more portable, and user-friendly devices. The market is characterized by intense competition, with established players focusing on product innovation and expansion into new markets. The market size is estimated at xx Million in 2025 and is projected to reach xx Million by 2033, exhibiting a strong CAGR of xx%. Market penetration is highest in urban areas, with significant growth potential in rural regions.
Dominant Markets & Segments in MEA Portable X-Ray Devices Industry
The digital X-ray segment is the dominant technology in the MEA portable X-ray devices market, accounting for approximately xx% of the market share in 2025. Within applications, dental X-ray and chest X-ray are the largest segments, driven by their high prevalence and relatively lower cost compared to other imaging modalities. Mobile X-ray devices dominate the modality segment owing to their flexibility and suitability for diverse healthcare settings.
- Leading Region/Country: [Specify leading region/country with market share data].
- Dominant Technology: Digital X-ray (xx% market share in 2025).
- Leading Application: Dental X-ray and Chest X-ray.
- Dominant Modality: Mobile X-ray Devices.
- Key Growth Drivers: Increasing healthcare infrastructure investment, rising prevalence of chronic diseases, government initiatives to improve healthcare access.
MEA Portable X-Ray Devices Industry Product Analysis
The MEA market shows a strong preference for digital portable X-ray systems offering improved image quality, reduced radiation exposure, and enhanced diagnostic capabilities. Wireless connectivity features and integrated image processing software further enhance efficiency and workflow. These systems are designed to meet the needs of diverse healthcare settings, from small clinics to large hospitals, offering competitive advantages in terms of portability, ease of use, and cost-effectiveness compared to traditional analog systems.
Key Drivers, Barriers & Challenges in MEA Portable X-Ray Devices Industry
Key Drivers: Increasing healthcare infrastructure investments, rising prevalence of chronic diseases, government initiatives to improve healthcare access, and technological advancements like wireless and digital X-ray systems.
Challenges: High initial investment costs for advanced systems, limited access to skilled technicians in certain regions, and varying regulatory frameworks across MEA countries. Supply chain disruptions may cause delays and impact availability and cost. These factors can decrease market growth by an estimated xx% annually.
Growth Drivers in the MEA Portable X-Ray Devices Industry Market
Technological advancements, particularly the development of digital and wireless X-ray systems, are driving market expansion. Government initiatives promoting healthcare infrastructure development and increased investments in healthcare are creating significant opportunities. The rising prevalence of chronic diseases necessitating frequent diagnostics fuels demand.
Challenges Impacting MEA Portable X-Ray Devices Industry Growth
High initial investment costs for advanced digital systems, especially in resource-limited settings, pose a significant challenge. Varied regulatory frameworks across MEA countries complicate market entry and product approvals. A shortage of skilled technicians and lack of comprehensive service networks can hinder adoption and increase operational costs.
Key Players Shaping the MEA Portable X-Ray Devices Industry Market
- Siemens Healthineers
- Ziehm Imaging GmbH
- KaVo Dental
- Fujifilm Corporation
- Carestream Health
- General Electric Company (GE Healthcare)
- Koninklijke Philips NV
- Canon Medical Systems
- Shimadzu Corporations
Significant MEA Portable X-Ray Devices Industry Industry Milestones
- January 2023: LG showcased new medical monitors and digital X-ray detectors at Arab Health 2023, improving diagnostic accuracy.
- September 2022: UNICEF Venture Fund invested in startups developing AI and machine learning for healthcare, including Neural Labs in Kenya for chest X-ray disease detection.
Future Outlook for MEA Portable X-Ray Devices Industry Market
The MEA portable X-ray devices market is poised for substantial growth driven by continued investments in healthcare infrastructure, technological advancements in digital and AI-powered systems, and increasing demand for point-of-care diagnostics. Strategic partnerships and collaborations between manufacturers and healthcare providers are expected to accelerate market penetration, especially in underserved regions. The market offers significant opportunities for companies specializing in cost-effective, user-friendly, and portable X-ray devices.
MEA Portable X-Ray Devices Industry Segmentation
-
1. Technology
- 1.1. Analog X-ray
- 1.2. Digital X-ray
-
2. Application
- 2.1. Dental X-ray
- 2.2. Mammography
- 2.3. Chest X-ray
- 2.4. Abdomen X-ray
-
3. Modality
- 3.1. Handheld X-ray Devices
- 3.2. Mobile X-ray Devices
-
4. Geography
- 4.1. GCC
- 4.2. South Africa
- 4.3. Rest of Middle East and Africa
MEA Portable X-Ray Devices Industry Segmentation By Geography
- 1. GCC
- 2. South Africa
- 3. Rest of Middle East and Africa
MEA Portable X-Ray Devices Industry REPORT HIGHLIGHTS
| Aspects | Details |
|---|---|
| Study Period | 2019-2033 |
| Base Year | 2024 |
| Estimated Year | 2025 |
| Forecast Period | 2025-2033 |
| Historical Period | 2019-2024 |
| Growth Rate | CAGR of 7.67% from 2019-2033 |
| Segmentation |
|
Table of Contents
- 1. Introduction
- 1.1. Research Scope
- 1.2. Market Segmentation
- 1.3. Research Methodology
- 1.4. Definitions and Assumptions
- 2. Executive Summary
- 2.1. Introduction
- 3. Market Dynamics
- 3.1. Introduction
- 3.2. Market Drivers
- 3.2.1. Technological Advancements and Rise in Awareness Regarding Portable Devices; Increase in Geriatric Population with Mobility Issues
- 3.3. Market Restrains
- 3.3.1. High Risk of Radiation Exposure
- 3.4. Market Trends
- 3.4.1. Digital X-ray is Expected to Hold a Significant Share of the Market During the Forecasted Period
- 4. Market Factor Analysis
- 4.1. Porters Five Forces
- 4.2. Supply/Value Chain
- 4.3. PESTEL analysis
- 4.4. Market Entropy
- 4.5. Patent/Trademark Analysis
- 5. Global MEA Portable X-Ray Devices Industry Analysis, Insights and Forecast, 2019-2031
- 5.1. Market Analysis, Insights and Forecast - by Technology
- 5.1.1. Analog X-ray
- 5.1.2. Digital X-ray
- 5.2. Market Analysis, Insights and Forecast - by Application
- 5.2.1. Dental X-ray
- 5.2.2. Mammography
- 5.2.3. Chest X-ray
- 5.2.4. Abdomen X-ray
- 5.3. Market Analysis, Insights and Forecast - by Modality
- 5.3.1. Handheld X-ray Devices
- 5.3.2. Mobile X-ray Devices
- 5.4. Market Analysis, Insights and Forecast - by Geography
- 5.4.1. GCC
- 5.4.2. South Africa
- 5.4.3. Rest of Middle East and Africa
- 5.5. Market Analysis, Insights and Forecast - by Region
- 5.5.1. GCC
- 5.5.2. South Africa
- 5.5.3. Rest of Middle East and Africa
- 5.1. Market Analysis, Insights and Forecast - by Technology
- 6. GCC MEA Portable X-Ray Devices Industry Analysis, Insights and Forecast, 2019-2031
- 6.1. Market Analysis, Insights and Forecast - by Technology
- 6.1.1. Analog X-ray
- 6.1.2. Digital X-ray
- 6.2. Market Analysis, Insights and Forecast - by Application
- 6.2.1. Dental X-ray
- 6.2.2. Mammography
- 6.2.3. Chest X-ray
- 6.2.4. Abdomen X-ray
- 6.3. Market Analysis, Insights and Forecast - by Modality
- 6.3.1. Handheld X-ray Devices
- 6.3.2. Mobile X-ray Devices
- 6.4. Market Analysis, Insights and Forecast - by Geography
- 6.4.1. GCC
- 6.4.2. South Africa
- 6.4.3. Rest of Middle East and Africa
- 6.1. Market Analysis, Insights and Forecast - by Technology
- 7. South Africa MEA Portable X-Ray Devices Industry Analysis, Insights and Forecast, 2019-2031
- 7.1. Market Analysis, Insights and Forecast - by Technology
- 7.1.1. Analog X-ray
- 7.1.2. Digital X-ray
- 7.2. Market Analysis, Insights and Forecast - by Application
- 7.2.1. Dental X-ray
- 7.2.2. Mammography
- 7.2.3. Chest X-ray
- 7.2.4. Abdomen X-ray
- 7.3. Market Analysis, Insights and Forecast - by Modality
- 7.3.1. Handheld X-ray Devices
- 7.3.2. Mobile X-ray Devices
- 7.4. Market Analysis, Insights and Forecast - by Geography
- 7.4.1. GCC
- 7.4.2. South Africa
- 7.4.3. Rest of Middle East and Africa
- 7.1. Market Analysis, Insights and Forecast - by Technology
- 8. Rest of Middle East and Africa MEA Portable X-Ray Devices Industry Analysis, Insights and Forecast, 2019-2031
- 8.1. Market Analysis, Insights and Forecast - by Technology
- 8.1.1. Analog X-ray
- 8.1.2. Digital X-ray
- 8.2. Market Analysis, Insights and Forecast - by Application
- 8.2.1. Dental X-ray
- 8.2.2. Mammography
- 8.2.3. Chest X-ray
- 8.2.4. Abdomen X-ray
- 8.3. Market Analysis, Insights and Forecast - by Modality
- 8.3.1. Handheld X-ray Devices
- 8.3.2. Mobile X-ray Devices
- 8.4. Market Analysis, Insights and Forecast - by Geography
- 8.4.1. GCC
- 8.4.2. South Africa
- 8.4.3. Rest of Middle East and Africa
- 8.1. Market Analysis, Insights and Forecast - by Technology
- 9. North America MEA Portable X-Ray Devices Industry Analysis, Insights and Forecast, 2019-2031
- 9.1. Market Analysis, Insights and Forecast - By Country/Sub-region
- 9.1.1 United States
- 9.1.2 Canada
- 9.1.3 Mexico
- 10. Europe MEA Portable X-Ray Devices Industry Analysis, Insights and Forecast, 2019-2031
- 10.1. Market Analysis, Insights and Forecast - By Country/Sub-region
- 10.1.1 Germany
- 10.1.2 United Kingdom
- 10.1.3 France
- 10.1.4 Spain
- 10.1.5 Italy
- 10.1.6 Spain
- 10.1.7 Belgium
- 10.1.8 Netherland
- 10.1.9 Nordics
- 10.1.10 Rest of Europe
- 11. Asia Pacific MEA Portable X-Ray Devices Industry Analysis, Insights and Forecast, 2019-2031
- 11.1. Market Analysis, Insights and Forecast - By Country/Sub-region
- 11.1.1 China
- 11.1.2 Japan
- 11.1.3 India
- 11.1.4 South Korea
- 11.1.5 Southeast Asia
- 11.1.6 Australia
- 11.1.7 Indonesia
- 11.1.8 Phillipes
- 11.1.9 Singapore
- 11.1.10 Thailandc
- 11.1.11 Rest of Asia Pacific
- 12. South America MEA Portable X-Ray Devices Industry Analysis, Insights and Forecast, 2019-2031
- 12.1. Market Analysis, Insights and Forecast - By Country/Sub-region
- 12.1.1 Brazil
- 12.1.2 Argentina
- 12.1.3 Peru
- 12.1.4 Chile
- 12.1.5 Colombia
- 12.1.6 Ecuador
- 12.1.7 Venezuela
- 12.1.8 Rest of South America
- 13. MEA MEA Portable X-Ray Devices Industry Analysis, Insights and Forecast, 2019-2031
- 13.1. Market Analysis, Insights and Forecast - By Country/Sub-region
- 13.1.1 United Arab Emirates
- 13.1.2 Saudi Arabia
- 13.1.3 South Africa
- 13.1.4 Rest of Middle East and Africa
- 14. Competitive Analysis
- 14.1. Global Market Share Analysis 2024
- 14.2. Company Profiles
- 14.2.1 Siemens Healthineers
- 14.2.1.1. Overview
- 14.2.1.2. Products
- 14.2.1.3. SWOT Analysis
- 14.2.1.4. Recent Developments
- 14.2.1.5. Financials (Based on Availability)
- 14.2.2 Ziehm Imaging GmbH
- 14.2.2.1. Overview
- 14.2.2.2. Products
- 14.2.2.3. SWOT Analysis
- 14.2.2.4. Recent Developments
- 14.2.2.5. Financials (Based on Availability)
- 14.2.3 KaVo Dental
- 14.2.3.1. Overview
- 14.2.3.2. Products
- 14.2.3.3. SWOT Analysis
- 14.2.3.4. Recent Developments
- 14.2.3.5. Financials (Based on Availability)
- 14.2.4 Fujifilm Corporation
- 14.2.4.1. Overview
- 14.2.4.2. Products
- 14.2.4.3. SWOT Analysis
- 14.2.4.4. Recent Developments
- 14.2.4.5. Financials (Based on Availability)
- 14.2.5 Carestream Health
- 14.2.5.1. Overview
- 14.2.5.2. Products
- 14.2.5.3. SWOT Analysis
- 14.2.5.4. Recent Developments
- 14.2.5.5. Financials (Based on Availability)
- 14.2.6 General Electric Company (GE Healthcare)
- 14.2.6.1. Overview
- 14.2.6.2. Products
- 14.2.6.3. SWOT Analysis
- 14.2.6.4. Recent Developments
- 14.2.6.5. Financials (Based on Availability)
- 14.2.7 Koninklijke Philips NV
- 14.2.7.1. Overview
- 14.2.7.2. Products
- 14.2.7.3. SWOT Analysis
- 14.2.7.4. Recent Developments
- 14.2.7.5. Financials (Based on Availability)
- 14.2.8 Canon Medical Systems
- 14.2.8.1. Overview
- 14.2.8.2. Products
- 14.2.8.3. SWOT Analysis
- 14.2.8.4. Recent Developments
- 14.2.8.5. Financials (Based on Availability)
- 14.2.9 Shimadzu Corporations
- 14.2.9.1. Overview
- 14.2.9.2. Products
- 14.2.9.3. SWOT Analysis
- 14.2.9.4. Recent Developments
- 14.2.9.5. Financials (Based on Availability)
- 14.2.1 Siemens Healthineers
List of Figures
- Figure 1: Global MEA Portable X-Ray Devices Industry Revenue Breakdown (Million, %) by Region 2024 & 2032
- Figure 2: Global MEA Portable X-Ray Devices Industry Volume Breakdown (K Unit, %) by Region 2024 & 2032
- Figure 3: North America MEA Portable X-Ray Devices Industry Revenue (Million), by Country 2024 & 2032
- Figure 4: North America MEA Portable X-Ray Devices Industry Volume (K Unit), by Country 2024 & 2032
- Figure 5: North America MEA Portable X-Ray Devices Industry Revenue Share (%), by Country 2024 & 2032
- Figure 6: North America MEA Portable X-Ray Devices Industry Volume Share (%), by Country 2024 & 2032
- Figure 7: Europe MEA Portable X-Ray Devices Industry Revenue (Million), by Country 2024 & 2032
- Figure 8: Europe MEA Portable X-Ray Devices Industry Volume (K Unit), by Country 2024 & 2032
- Figure 9: Europe MEA Portable X-Ray Devices Industry Revenue Share (%), by Country 2024 & 2032
- Figure 10: Europe MEA Portable X-Ray Devices Industry Volume Share (%), by Country 2024 & 2032
- Figure 11: Asia Pacific MEA Portable X-Ray Devices Industry Revenue (Million), by Country 2024 & 2032
- Figure 12: Asia Pacific MEA Portable X-Ray Devices Industry Volume (K Unit), by Country 2024 & 2032
- Figure 13: Asia Pacific MEA Portable X-Ray Devices Industry Revenue Share (%), by Country 2024 & 2032
- Figure 14: Asia Pacific MEA Portable X-Ray Devices Industry Volume Share (%), by Country 2024 & 2032
- Figure 15: South America MEA Portable X-Ray Devices Industry Revenue (Million), by Country 2024 & 2032
- Figure 16: South America MEA Portable X-Ray Devices Industry Volume (K Unit), by Country 2024 & 2032
- Figure 17: South America MEA Portable X-Ray Devices Industry Revenue Share (%), by Country 2024 & 2032
- Figure 18: South America MEA Portable X-Ray Devices Industry Volume Share (%), by Country 2024 & 2032
- Figure 19: MEA MEA Portable X-Ray Devices Industry Revenue (Million), by Country 2024 & 2032
- Figure 20: MEA MEA Portable X-Ray Devices Industry Volume (K Unit), by Country 2024 & 2032
- Figure 21: MEA MEA Portable X-Ray Devices Industry Revenue Share (%), by Country 2024 & 2032
- Figure 22: MEA MEA Portable X-Ray Devices Industry Volume Share (%), by Country 2024 & 2032
- Figure 23: GCC MEA Portable X-Ray Devices Industry Revenue (Million), by Technology 2024 & 2032
- Figure 24: GCC MEA Portable X-Ray Devices Industry Volume (K Unit), by Technology 2024 & 2032
- Figure 25: GCC MEA Portable X-Ray Devices Industry Revenue Share (%), by Technology 2024 & 2032
- Figure 26: GCC MEA Portable X-Ray Devices Industry Volume Share (%), by Technology 2024 & 2032
- Figure 27: GCC MEA Portable X-Ray Devices Industry Revenue (Million), by Application 2024 & 2032
- Figure 28: GCC MEA Portable X-Ray Devices Industry Volume (K Unit), by Application 2024 & 2032
- Figure 29: GCC MEA Portable X-Ray Devices Industry Revenue Share (%), by Application 2024 & 2032
- Figure 30: GCC MEA Portable X-Ray Devices Industry Volume Share (%), by Application 2024 & 2032
- Figure 31: GCC MEA Portable X-Ray Devices Industry Revenue (Million), by Modality 2024 & 2032
- Figure 32: GCC MEA Portable X-Ray Devices Industry Volume (K Unit), by Modality 2024 & 2032
- Figure 33: GCC MEA Portable X-Ray Devices Industry Revenue Share (%), by Modality 2024 & 2032
- Figure 34: GCC MEA Portable X-Ray Devices Industry Volume Share (%), by Modality 2024 & 2032
- Figure 35: GCC MEA Portable X-Ray Devices Industry Revenue (Million), by Geography 2024 & 2032
- Figure 36: GCC MEA Portable X-Ray Devices Industry Volume (K Unit), by Geography 2024 & 2032
- Figure 37: GCC MEA Portable X-Ray Devices Industry Revenue Share (%), by Geography 2024 & 2032
- Figure 38: GCC MEA Portable X-Ray Devices Industry Volume Share (%), by Geography 2024 & 2032
- Figure 39: GCC MEA Portable X-Ray Devices Industry Revenue (Million), by Country 2024 & 2032
- Figure 40: GCC MEA Portable X-Ray Devices Industry Volume (K Unit), by Country 2024 & 2032
- Figure 41: GCC MEA Portable X-Ray Devices Industry Revenue Share (%), by Country 2024 & 2032
- Figure 42: GCC MEA Portable X-Ray Devices Industry Volume Share (%), by Country 2024 & 2032
- Figure 43: South Africa MEA Portable X-Ray Devices Industry Revenue (Million), by Technology 2024 & 2032
- Figure 44: South Africa MEA Portable X-Ray Devices Industry Volume (K Unit), by Technology 2024 & 2032
- Figure 45: South Africa MEA Portable X-Ray Devices Industry Revenue Share (%), by Technology 2024 & 2032
- Figure 46: South Africa MEA Portable X-Ray Devices Industry Volume Share (%), by Technology 2024 & 2032
- Figure 47: South Africa MEA Portable X-Ray Devices Industry Revenue (Million), by Application 2024 & 2032
- Figure 48: South Africa MEA Portable X-Ray Devices Industry Volume (K Unit), by Application 2024 & 2032
- Figure 49: South Africa MEA Portable X-Ray Devices Industry Revenue Share (%), by Application 2024 & 2032
- Figure 50: South Africa MEA Portable X-Ray Devices Industry Volume Share (%), by Application 2024 & 2032
- Figure 51: South Africa MEA Portable X-Ray Devices Industry Revenue (Million), by Modality 2024 & 2032
- Figure 52: South Africa MEA Portable X-Ray Devices Industry Volume (K Unit), by Modality 2024 & 2032
- Figure 53: South Africa MEA Portable X-Ray Devices Industry Revenue Share (%), by Modality 2024 & 2032
- Figure 54: South Africa MEA Portable X-Ray Devices Industry Volume Share (%), by Modality 2024 & 2032
- Figure 55: South Africa MEA Portable X-Ray Devices Industry Revenue (Million), by Geography 2024 & 2032
- Figure 56: South Africa MEA Portable X-Ray Devices Industry Volume (K Unit), by Geography 2024 & 2032
- Figure 57: South Africa MEA Portable X-Ray Devices Industry Revenue Share (%), by Geography 2024 & 2032
- Figure 58: South Africa MEA Portable X-Ray Devices Industry Volume Share (%), by Geography 2024 & 2032
- Figure 59: South Africa MEA Portable X-Ray Devices Industry Revenue (Million), by Country 2024 & 2032
- Figure 60: South Africa MEA Portable X-Ray Devices Industry Volume (K Unit), by Country 2024 & 2032
- Figure 61: South Africa MEA Portable X-Ray Devices Industry Revenue Share (%), by Country 2024 & 2032
- Figure 62: South Africa MEA Portable X-Ray Devices Industry Volume Share (%), by Country 2024 & 2032
- Figure 63: Rest of Middle East and Africa MEA Portable X-Ray Devices Industry Revenue (Million), by Technology 2024 & 2032
- Figure 64: Rest of Middle East and Africa MEA Portable X-Ray Devices Industry Volume (K Unit), by Technology 2024 & 2032
- Figure 65: Rest of Middle East and Africa MEA Portable X-Ray Devices Industry Revenue Share (%), by Technology 2024 & 2032
- Figure 66: Rest of Middle East and Africa MEA Portable X-Ray Devices Industry Volume Share (%), by Technology 2024 & 2032
- Figure 67: Rest of Middle East and Africa MEA Portable X-Ray Devices Industry Revenue (Million), by Application 2024 & 2032
- Figure 68: Rest of Middle East and Africa MEA Portable X-Ray Devices Industry Volume (K Unit), by Application 2024 & 2032
- Figure 69: Rest of Middle East and Africa MEA Portable X-Ray Devices Industry Revenue Share (%), by Application 2024 & 2032
- Figure 70: Rest of Middle East and Africa MEA Portable X-Ray Devices Industry Volume Share (%), by Application 2024 & 2032
- Figure 71: Rest of Middle East and Africa MEA Portable X-Ray Devices Industry Revenue (Million), by Modality 2024 & 2032
- Figure 72: Rest of Middle East and Africa MEA Portable X-Ray Devices Industry Volume (K Unit), by Modality 2024 & 2032
- Figure 73: Rest of Middle East and Africa MEA Portable X-Ray Devices Industry Revenue Share (%), by Modality 2024 & 2032
- Figure 74: Rest of Middle East and Africa MEA Portable X-Ray Devices Industry Volume Share (%), by Modality 2024 & 2032
- Figure 75: Rest of Middle East and Africa MEA Portable X-Ray Devices Industry Revenue (Million), by Geography 2024 & 2032
- Figure 76: Rest of Middle East and Africa MEA Portable X-Ray Devices Industry Volume (K Unit), by Geography 2024 & 2032
- Figure 77: Rest of Middle East and Africa MEA Portable X-Ray Devices Industry Revenue Share (%), by Geography 2024 & 2032
- Figure 78: Rest of Middle East and Africa MEA Portable X-Ray Devices Industry Volume Share (%), by Geography 2024 & 2032
- Figure 79: Rest of Middle East and Africa MEA Portable X-Ray Devices Industry Revenue (Million), by Country 2024 & 2032
- Figure 80: Rest of Middle East and Africa MEA Portable X-Ray Devices Industry Volume (K Unit), by Country 2024 & 2032
- Figure 81: Rest of Middle East and Africa MEA Portable X-Ray Devices Industry Revenue Share (%), by Country 2024 & 2032
- Figure 82: Rest of Middle East and Africa MEA Portable X-Ray Devices Industry Volume Share (%), by Country 2024 & 2032
List of Tables
- Table 1: Global MEA Portable X-Ray Devices Industry Revenue Million Forecast, by Region 2019 & 2032
- Table 2: Global MEA Portable X-Ray Devices Industry Volume K Unit Forecast, by Region 2019 & 2032
- Table 3: Global MEA Portable X-Ray Devices Industry Revenue Million Forecast, by Technology 2019 & 2032
- Table 4: Global MEA Portable X-Ray Devices Industry Volume K Unit Forecast, by Technology 2019 & 2032
- Table 5: Global MEA Portable X-Ray Devices Industry Revenue Million Forecast, by Application 2019 & 2032
- Table 6: Global MEA Portable X-Ray Devices Industry Volume K Unit Forecast, by Application 2019 & 2032
- Table 7: Global MEA Portable X-Ray Devices Industry Revenue Million Forecast, by Modality 2019 & 2032
- Table 8: Global MEA Portable X-Ray Devices Industry Volume K Unit Forecast, by Modality 2019 & 2032
- Table 9: Global MEA Portable X-Ray Devices Industry Revenue Million Forecast, by Geography 2019 & 2032
- Table 10: Global MEA Portable X-Ray Devices Industry Volume K Unit Forecast, by Geography 2019 & 2032
- Table 11: Global MEA Portable X-Ray Devices Industry Revenue Million Forecast, by Region 2019 & 2032
- Table 12: Global MEA Portable X-Ray Devices Industry Volume K Unit Forecast, by Region 2019 & 2032
- Table 13: Global MEA Portable X-Ray Devices Industry Revenue Million Forecast, by Country 2019 & 2032
- Table 14: Global MEA Portable X-Ray Devices Industry Volume K Unit Forecast, by Country 2019 & 2032
- Table 15: United States MEA Portable X-Ray Devices Industry Revenue (Million) Forecast, by Application 2019 & 2032
- Table 16: United States MEA Portable X-Ray Devices Industry Volume (K Unit) Forecast, by Application 2019 & 2032
- Table 17: Canada MEA Portable X-Ray Devices Industry Revenue (Million) Forecast, by Application 2019 & 2032
- Table 18: Canada MEA Portable X-Ray Devices Industry Volume (K Unit) Forecast, by Application 2019 & 2032
- Table 19: Mexico MEA Portable X-Ray Devices Industry Revenue (Million) Forecast, by Application 2019 & 2032
- Table 20: Mexico MEA Portable X-Ray Devices Industry Volume (K Unit) Forecast, by Application 2019 & 2032
- Table 21: Global MEA Portable X-Ray Devices Industry Revenue Million Forecast, by Country 2019 & 2032
- Table 22: Global MEA Portable X-Ray Devices Industry Volume K Unit Forecast, by Country 2019 & 2032
- Table 23: Germany MEA Portable X-Ray Devices Industry Revenue (Million) Forecast, by Application 2019 & 2032
- Table 24: Germany MEA Portable X-Ray Devices Industry Volume (K Unit) Forecast, by Application 2019 & 2032
- Table 25: United Kingdom MEA Portable X-Ray Devices Industry Revenue (Million) Forecast, by Application 2019 & 2032
- Table 26: United Kingdom MEA Portable X-Ray Devices Industry Volume (K Unit) Forecast, by Application 2019 & 2032
- Table 27: France MEA Portable X-Ray Devices Industry Revenue (Million) Forecast, by Application 2019 & 2032
- Table 28: France MEA Portable X-Ray Devices Industry Volume (K Unit) Forecast, by Application 2019 & 2032
- Table 29: Spain MEA Portable X-Ray Devices Industry Revenue (Million) Forecast, by Application 2019 & 2032
- Table 30: Spain MEA Portable X-Ray Devices Industry Volume (K Unit) Forecast, by Application 2019 & 2032
- Table 31: Italy MEA Portable X-Ray Devices Industry Revenue (Million) Forecast, by Application 2019 & 2032
- Table 32: Italy MEA Portable X-Ray Devices Industry Volume (K Unit) Forecast, by Application 2019 & 2032
- Table 33: Spain MEA Portable X-Ray Devices Industry Revenue (Million) Forecast, by Application 2019 & 2032
- Table 34: Spain MEA Portable X-Ray Devices Industry Volume (K Unit) Forecast, by Application 2019 & 2032
- Table 35: Belgium MEA Portable X-Ray Devices Industry Revenue (Million) Forecast, by Application 2019 & 2032
- Table 36: Belgium MEA Portable X-Ray Devices Industry Volume (K Unit) Forecast, by Application 2019 & 2032
- Table 37: Netherland MEA Portable X-Ray Devices Industry Revenue (Million) Forecast, by Application 2019 & 2032
- Table 38: Netherland MEA Portable X-Ray Devices Industry Volume (K Unit) Forecast, by Application 2019 & 2032
- Table 39: Nordics MEA Portable X-Ray Devices Industry Revenue (Million) Forecast, by Application 2019 & 2032
- Table 40: Nordics MEA Portable X-Ray Devices Industry Volume (K Unit) Forecast, by Application 2019 & 2032
- Table 41: Rest of Europe MEA Portable X-Ray Devices Industry Revenue (Million) Forecast, by Application 2019 & 2032
- Table 42: Rest of Europe MEA Portable X-Ray Devices Industry Volume (K Unit) Forecast, by Application 2019 & 2032
- Table 43: Global MEA Portable X-Ray Devices Industry Revenue Million Forecast, by Country 2019 & 2032
- Table 44: Global MEA Portable X-Ray Devices Industry Volume K Unit Forecast, by Country 2019 & 2032
- Table 45: China MEA Portable X-Ray Devices Industry Revenue (Million) Forecast, by Application 2019 & 2032
- Table 46: China MEA Portable X-Ray Devices Industry Volume (K Unit) Forecast, by Application 2019 & 2032
- Table 47: Japan MEA Portable X-Ray Devices Industry Revenue (Million) Forecast, by Application 2019 & 2032
- Table 48: Japan MEA Portable X-Ray Devices Industry Volume (K Unit) Forecast, by Application 2019 & 2032
- Table 49: India MEA Portable X-Ray Devices Industry Revenue (Million) Forecast, by Application 2019 & 2032
- Table 50: India MEA Portable X-Ray Devices Industry Volume (K Unit) Forecast, by Application 2019 & 2032
- Table 51: South Korea MEA Portable X-Ray Devices Industry Revenue (Million) Forecast, by Application 2019 & 2032
- Table 52: South Korea MEA Portable X-Ray Devices Industry Volume (K Unit) Forecast, by Application 2019 & 2032
- Table 53: Southeast Asia MEA Portable X-Ray Devices Industry Revenue (Million) Forecast, by Application 2019 & 2032
- Table 54: Southeast Asia MEA Portable X-Ray Devices Industry Volume (K Unit) Forecast, by Application 2019 & 2032
- Table 55: Australia MEA Portable X-Ray Devices Industry Revenue (Million) Forecast, by Application 2019 & 2032
- Table 56: Australia MEA Portable X-Ray Devices Industry Volume (K Unit) Forecast, by Application 2019 & 2032
- Table 57: Indonesia MEA Portable X-Ray Devices Industry Revenue (Million) Forecast, by Application 2019 & 2032
- Table 58: Indonesia MEA Portable X-Ray Devices Industry Volume (K Unit) Forecast, by Application 2019 & 2032
- Table 59: Phillipes MEA Portable X-Ray Devices Industry Revenue (Million) Forecast, by Application 2019 & 2032
- Table 60: Phillipes MEA Portable X-Ray Devices Industry Volume (K Unit) Forecast, by Application 2019 & 2032
- Table 61: Singapore MEA Portable X-Ray Devices Industry Revenue (Million) Forecast, by Application 2019 & 2032
- Table 62: Singapore MEA Portable X-Ray Devices Industry Volume (K Unit) Forecast, by Application 2019 & 2032
- Table 63: Thailandc MEA Portable X-Ray Devices Industry Revenue (Million) Forecast, by Application 2019 & 2032
- Table 64: Thailandc MEA Portable X-Ray Devices Industry Volume (K Unit) Forecast, by Application 2019 & 2032
- Table 65: Rest of Asia Pacific MEA Portable X-Ray Devices Industry Revenue (Million) Forecast, by Application 2019 & 2032
- Table 66: Rest of Asia Pacific MEA Portable X-Ray Devices Industry Volume (K Unit) Forecast, by Application 2019 & 2032
- Table 67: Global MEA Portable X-Ray Devices Industry Revenue Million Forecast, by Country 2019 & 2032
- Table 68: Global MEA Portable X-Ray Devices Industry Volume K Unit Forecast, by Country 2019 & 2032
- Table 69: Brazil MEA Portable X-Ray Devices Industry Revenue (Million) Forecast, by Application 2019 & 2032
- Table 70: Brazil MEA Portable X-Ray Devices Industry Volume (K Unit) Forecast, by Application 2019 & 2032
- Table 71: Argentina MEA Portable X-Ray Devices Industry Revenue (Million) Forecast, by Application 2019 & 2032
- Table 72: Argentina MEA Portable X-Ray Devices Industry Volume (K Unit) Forecast, by Application 2019 & 2032
- Table 73: Peru MEA Portable X-Ray Devices Industry Revenue (Million) Forecast, by Application 2019 & 2032
- Table 74: Peru MEA Portable X-Ray Devices Industry Volume (K Unit) Forecast, by Application 2019 & 2032
- Table 75: Chile MEA Portable X-Ray Devices Industry Revenue (Million) Forecast, by Application 2019 & 2032
- Table 76: Chile MEA Portable X-Ray Devices Industry Volume (K Unit) Forecast, by Application 2019 & 2032
- Table 77: Colombia MEA Portable X-Ray Devices Industry Revenue (Million) Forecast, by Application 2019 & 2032
- Table 78: Colombia MEA Portable X-Ray Devices Industry Volume (K Unit) Forecast, by Application 2019 & 2032
- Table 79: Ecuador MEA Portable X-Ray Devices Industry Revenue (Million) Forecast, by Application 2019 & 2032
- Table 80: Ecuador MEA Portable X-Ray Devices Industry Volume (K Unit) Forecast, by Application 2019 & 2032
- Table 81: Venezuela MEA Portable X-Ray Devices Industry Revenue (Million) Forecast, by Application 2019 & 2032
- Table 82: Venezuela MEA Portable X-Ray Devices Industry Volume (K Unit) Forecast, by Application 2019 & 2032
- Table 83: Rest of South America MEA Portable X-Ray Devices Industry Revenue (Million) Forecast, by Application 2019 & 2032
- Table 84: Rest of South America MEA Portable X-Ray Devices Industry Volume (K Unit) Forecast, by Application 2019 & 2032
- Table 85: Global MEA Portable X-Ray Devices Industry Revenue Million Forecast, by Country 2019 & 2032
- Table 86: Global MEA Portable X-Ray Devices Industry Volume K Unit Forecast, by Country 2019 & 2032
- Table 87: United Arab Emirates MEA Portable X-Ray Devices Industry Revenue (Million) Forecast, by Application 2019 & 2032
- Table 88: United Arab Emirates MEA Portable X-Ray Devices Industry Volume (K Unit) Forecast, by Application 2019 & 2032
- Table 89: Saudi Arabia MEA Portable X-Ray Devices Industry Revenue (Million) Forecast, by Application 2019 & 2032
- Table 90: Saudi Arabia MEA Portable X-Ray Devices Industry Volume (K Unit) Forecast, by Application 2019 & 2032
- Table 91: South Africa MEA Portable X-Ray Devices Industry Revenue (Million) Forecast, by Application 2019 & 2032
- Table 92: South Africa MEA Portable X-Ray Devices Industry Volume (K Unit) Forecast, by Application 2019 & 2032
- Table 93: Rest of Middle East and Africa MEA Portable X-Ray Devices Industry Revenue (Million) Forecast, by Application 2019 & 2032
- Table 94: Rest of Middle East and Africa MEA Portable X-Ray Devices Industry Volume (K Unit) Forecast, by Application 2019 & 2032
- Table 95: Global MEA Portable X-Ray Devices Industry Revenue Million Forecast, by Technology 2019 & 2032
- Table 96: Global MEA Portable X-Ray Devices Industry Volume K Unit Forecast, by Technology 2019 & 2032
- Table 97: Global MEA Portable X-Ray Devices Industry Revenue Million Forecast, by Application 2019 & 2032
- Table 98: Global MEA Portable X-Ray Devices Industry Volume K Unit Forecast, by Application 2019 & 2032
- Table 99: Global MEA Portable X-Ray Devices Industry Revenue Million Forecast, by Modality 2019 & 2032
- Table 100: Global MEA Portable X-Ray Devices Industry Volume K Unit Forecast, by Modality 2019 & 2032
- Table 101: Global MEA Portable X-Ray Devices Industry Revenue Million Forecast, by Geography 2019 & 2032
- Table 102: Global MEA Portable X-Ray Devices Industry Volume K Unit Forecast, by Geography 2019 & 2032
- Table 103: Global MEA Portable X-Ray Devices Industry Revenue Million Forecast, by Country 2019 & 2032
- Table 104: Global MEA Portable X-Ray Devices Industry Volume K Unit Forecast, by Country 2019 & 2032
- Table 105: Global MEA Portable X-Ray Devices Industry Revenue Million Forecast, by Technology 2019 & 2032
- Table 106: Global MEA Portable X-Ray Devices Industry Volume K Unit Forecast, by Technology 2019 & 2032
- Table 107: Global MEA Portable X-Ray Devices Industry Revenue Million Forecast, by Application 2019 & 2032
- Table 108: Global MEA Portable X-Ray Devices Industry Volume K Unit Forecast, by Application 2019 & 2032
- Table 109: Global MEA Portable X-Ray Devices Industry Revenue Million Forecast, by Modality 2019 & 2032
- Table 110: Global MEA Portable X-Ray Devices Industry Volume K Unit Forecast, by Modality 2019 & 2032
- Table 111: Global MEA Portable X-Ray Devices Industry Revenue Million Forecast, by Geography 2019 & 2032
- Table 112: Global MEA Portable X-Ray Devices Industry Volume K Unit Forecast, by Geography 2019 & 2032
- Table 113: Global MEA Portable X-Ray Devices Industry Revenue Million Forecast, by Country 2019 & 2032
- Table 114: Global MEA Portable X-Ray Devices Industry Volume K Unit Forecast, by Country 2019 & 2032
- Table 115: Global MEA Portable X-Ray Devices Industry Revenue Million Forecast, by Technology 2019 & 2032
- Table 116: Global MEA Portable X-Ray Devices Industry Volume K Unit Forecast, by Technology 2019 & 2032
- Table 117: Global MEA Portable X-Ray Devices Industry Revenue Million Forecast, by Application 2019 & 2032
- Table 118: Global MEA Portable X-Ray Devices Industry Volume K Unit Forecast, by Application 2019 & 2032
- Table 119: Global MEA Portable X-Ray Devices Industry Revenue Million Forecast, by Modality 2019 & 2032
- Table 120: Global MEA Portable X-Ray Devices Industry Volume K Unit Forecast, by Modality 2019 & 2032
- Table 121: Global MEA Portable X-Ray Devices Industry Revenue Million Forecast, by Geography 2019 & 2032
- Table 122: Global MEA Portable X-Ray Devices Industry Volume K Unit Forecast, by Geography 2019 & 2032
- Table 123: Global MEA Portable X-Ray Devices Industry Revenue Million Forecast, by Country 2019 & 2032
- Table 124: Global MEA Portable X-Ray Devices Industry Volume K Unit Forecast, by Country 2019 & 2032
Frequently Asked Questions
1. What is the projected Compound Annual Growth Rate (CAGR) of the MEA Portable X-Ray Devices Industry?
The projected CAGR is approximately 7.67%.
2. Which companies are prominent players in the MEA Portable X-Ray Devices Industry?
Key companies in the market include Siemens Healthineers, Ziehm Imaging GmbH, KaVo Dental, Fujifilm Corporation, Carestream Health, General Electric Company (GE Healthcare), Koninklijke Philips NV, Canon Medical Systems, Shimadzu Corporations.
3. What are the main segments of the MEA Portable X-Ray Devices Industry?
The market segments include Technology, Application, Modality, Geography.
4. Can you provide details about the market size?
The market size is estimated to be USD 321.39 Million as of 2022.
5. What are some drivers contributing to market growth?
Technological Advancements and Rise in Awareness Regarding Portable Devices; Increase in Geriatric Population with Mobility Issues.
6. What are the notable trends driving market growth?
Digital X-ray is Expected to Hold a Significant Share of the Market During the Forecasted Period.
7. Are there any restraints impacting market growth?
High Risk of Radiation Exposure.
8. Can you provide examples of recent developments in the market?
In January 2023, LG demonstrated its new medical monitors and digital x-ray detectors, offering improved diagnostic accuracy and transforming patient care at Arab Health 2023.
9. What pricing options are available for accessing the report?
Pricing options include single-user, multi-user, and enterprise licenses priced at USD 4750, USD 5250, and USD 8750 respectively.
10. Is the market size provided in terms of value or volume?
The market size is provided in terms of value, measured in Million and volume, measured in K Unit.
11. Are there any specific market keywords associated with the report?
Yes, the market keyword associated with the report is "MEA Portable X-Ray Devices Industry," which aids in identifying and referencing the specific market segment covered.
12. How do I determine which pricing option suits my needs best?
The pricing options vary based on user requirements and access needs. Individual users may opt for single-user licenses, while businesses requiring broader access may choose multi-user or enterprise licenses for cost-effective access to the report.
13. Are there any additional resources or data provided in the MEA Portable X-Ray Devices Industry report?
While the report offers comprehensive insights, it's advisable to review the specific contents or supplementary materials provided to ascertain if additional resources or data are available.
14. How can I stay updated on further developments or reports in the MEA Portable X-Ray Devices Industry?
To stay informed about further developments, trends, and reports in the MEA Portable X-Ray Devices Industry, consider subscribing to industry newsletters, following relevant companies and organizations, or regularly checking reputable industry news sources and publications.
Methodology
Step 1 - Identification of Relevant Samples Size from Population Database


Step 2 - Approaches for Defining Global Market Size (Value, Volume* & Price*)

Note*: In applicable scenarios
Step 3 - Data Sources
Primary Research
- Web Analytics
- Survey Reports
- Research Institute
- Latest Research Reports
- Opinion Leaders
Secondary Research
- Annual Reports
- White Paper
- Latest Press Release
- Industry Association
- Paid Database
- Investor Presentations

Step 4 - Data Triangulation
Involves using different sources of information in order to increase the validity of a study
These sources are likely to be stakeholders in a program - participants, other researchers, program staff, other community members, and so on.
Then we put all data in single framework & apply various statistical tools to find out the dynamic on the market.
During the analysis stage, feedback from the stakeholder groups would be compared to determine areas of agreement as well as areas of divergence
