

Key Insights
The global Medical Intraocular Lens (IOL) market is poised for significant expansion, projected to reach an estimated USD 4.62 billion in 2025. This growth is propelled by an anticipated CAGR of 6% from 2019 to 2033, indicating a robust and sustained upward trajectory. The increasing prevalence of age-related eye conditions such as cataracts, coupled with a growing global elderly population, serves as a primary driver for this market. Advancements in lens technology, leading to improved visual outcomes and reduced recovery times, further fuel demand. Multifocal and extended depth of field IOLs are gaining traction due to their ability to correct presbyopia and reduce dependence on glasses, offering enhanced quality of life for patients. The rising adoption of premium IOLs, driven by patient awareness and surgeon recommendations, is a key trend shaping the market landscape.
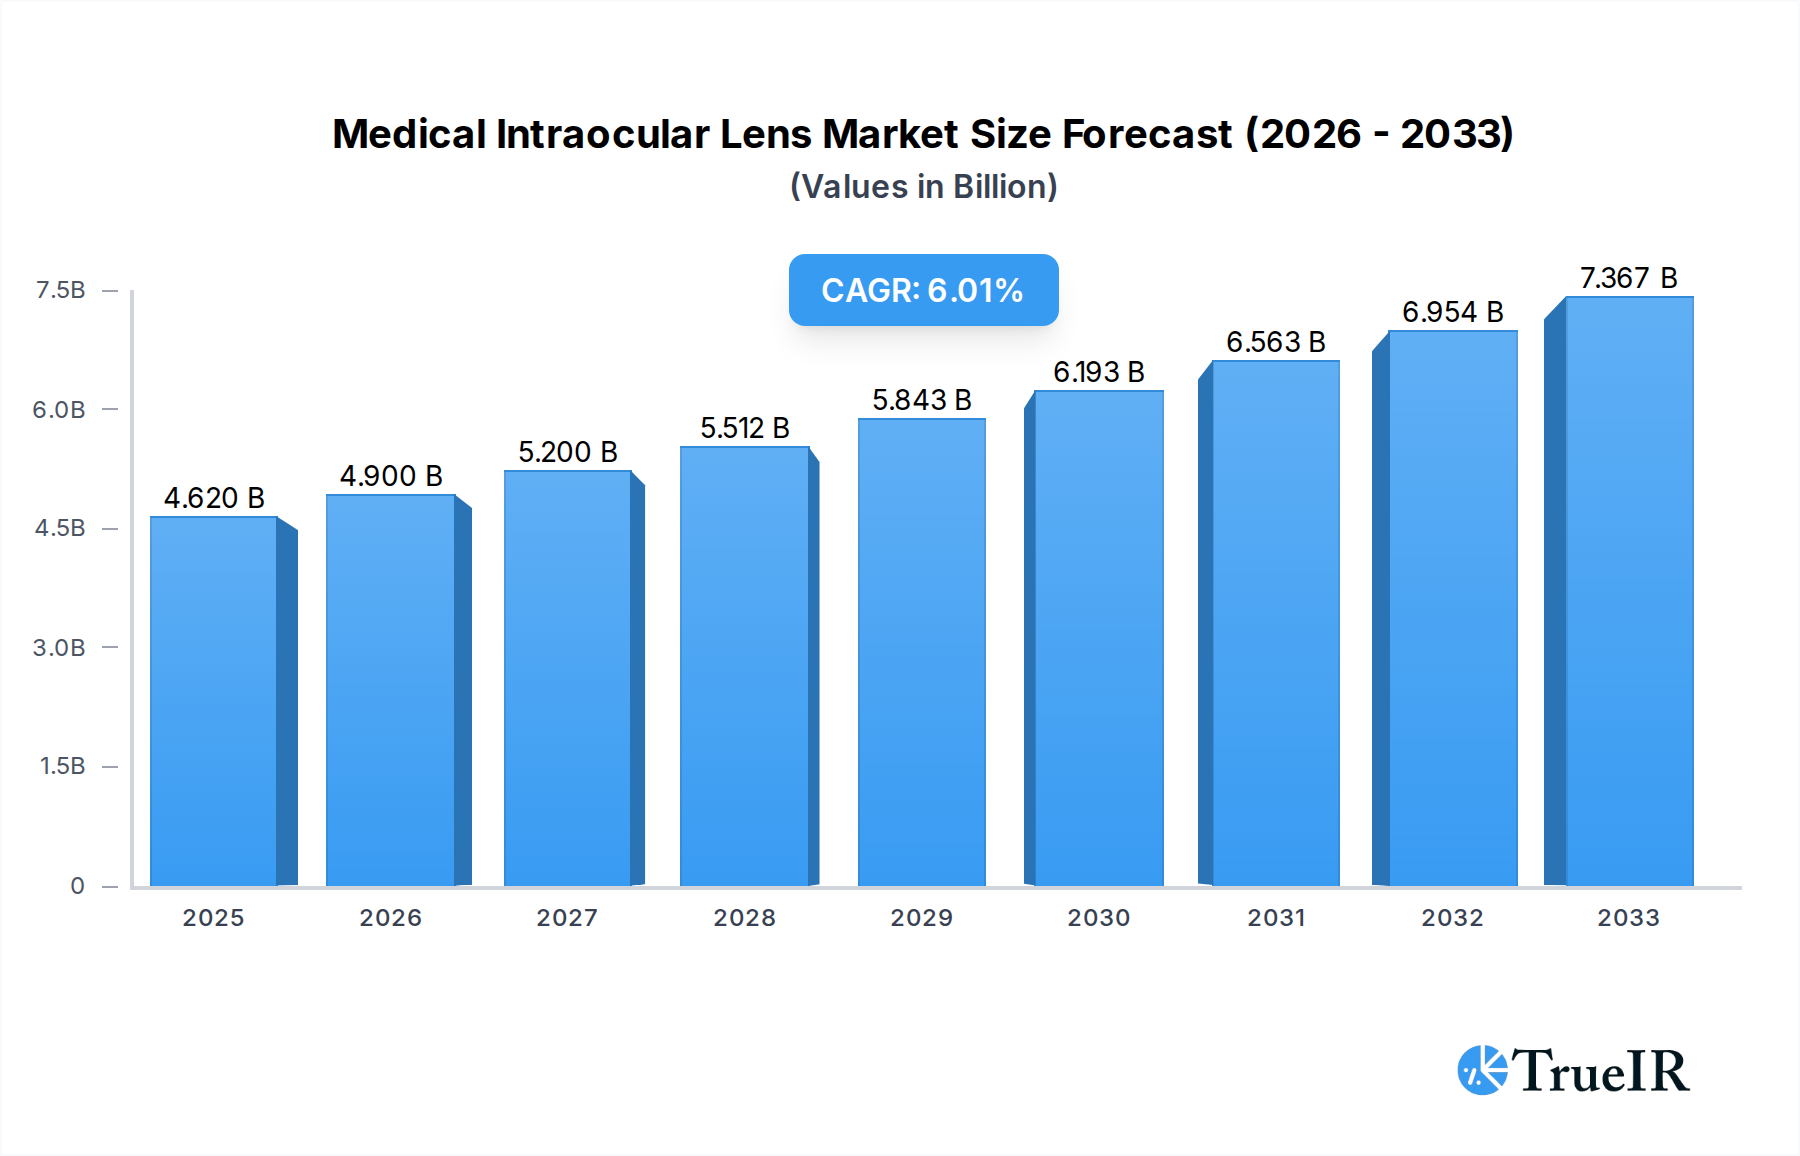
Medical Intraocular Lens Market Size (In Billion)
While the market demonstrates strong growth potential, certain factors could present challenges. The high cost associated with advanced IOL technologies and the limited reimbursement policies in some regions might restrain widespread adoption, particularly in emerging economies. However, increasing healthcare expenditure, a growing focus on eye care, and initiatives to improve access to ophthalmic surgeries are expected to mitigate these restraints. The market is segmented by application, with hospitals and clinics being the primary end-users, and by type, encompassing monofocal, multifocal, toric, and extended depth of field IOLs. Geographically, North America and Europe currently dominate the market due to advanced healthcare infrastructure and higher disposable incomes, but the Asia Pacific region is expected to witness the fastest growth, driven by a large patient pool and increasing healthcare investments. Key players like Allergan, Carl Zeiss, and Novartis are actively engaged in research and development to introduce innovative solutions and expand their market presence.

Medical Intraocular Lens Company Market Share
Medical Intraocular Lens Market: Comprehensive Report Description
This in-depth market research report provides a detailed analysis of the global Medical Intraocular Lens (IOL) market, forecasting its trajectory from 2019 to 2033. Leveraging comprehensive historical data from 2019-2024 and projecting future trends based on a robust 2025 base year, this report offers unparalleled insights for stakeholders seeking to understand the evolving landscape of ophthalmic surgery solutions. With a projected market valuation reaching billions, this study is essential for manufacturers, suppliers, investors, and healthcare providers navigating this dynamic and rapidly growing sector.
Medical Intraocular Lens Market Structure & Competitive Landscape
The Medical Intraocular Lens market is characterized by a moderately consolidated structure, with a significant portion of market share held by a few key players. Innovation drivers are primarily focused on enhancing visual outcomes, reducing surgical complications, and expanding the range of vision correction possibilities offered by IOLs. Regulatory impacts, such as stringent FDA and EMA approvals, play a crucial role in market entry and product development, influencing the pace of new product introductions. Product substitutes, while limited in direct replacement for IOLs in cataract surgery, may include advanced contact lens technologies or refractive surgery for certain patient demographics. End-user segmentation reveals a strong reliance on hospital settings for the majority of procedures, followed by specialized eye clinics. Mergers and acquisitions (M&A) trends have been observed as companies seek to expand their product portfolios, gain market access, and achieve economies of scale. For instance, the historical period saw approximately $1.5 billion in reported M&A activities. Concentration ratios are estimated to be around 65% for the top five market players.
Medical Intraocular Lens Market Trends & Opportunities
The Medical Intraocular Lens market is poised for substantial growth, driven by an aging global population, a rising incidence of cataracts, and increasing patient demand for improved vision quality post-surgery. Market size is projected to expand at a Compound Annual Growth Rate (CAGR) of approximately 7.5% between 2025 and 2033, reaching an estimated valuation of over $15 billion by the end of the forecast period. Technological shifts are a significant trend, with a pronounced move towards advanced IOL types that offer solutions beyond basic vision correction. Multifocal IOLs and Extended Depth of Field (EDOF) IOLs are gaining traction due to their ability to address presbyopia and provide functional vision at multiple distances, reducing reliance on glasses. Toric IOLs are also experiencing robust growth, catering to the significant patient population suffering from astigmatism. Consumer preferences are increasingly leaning towards premium IOLs that promise greater independence from corrective eyewear. This is supported by growing awareness of the benefits of advanced IOLs and a willingness among a segment of the population to invest in superior visual outcomes. Competitive dynamics are intensifying, with companies investing heavily in research and development (R&D) to introduce next-generation IOLs with enhanced features such as improved contrast sensitivity, reduced glare, and built-in UV protection. The market penetration rate for advanced IOLs is projected to increase from approximately 30% in 2025 to over 55% by 2033. The burgeoning medical tourism industry also presents a significant opportunity, as patients travel to countries with advanced healthcare infrastructure and more affordable surgical procedures. Furthermore, advancements in femtosecond laser technology are improving surgical precision and patient outcomes, further driving the adoption of premium IOLs. The increasing prevalence of diabetes and other chronic conditions that can lead to vision impairment also contributes to the long-term growth potential of the IOL market.
Dominant Markets & Segments in Medical Intraocular Lens
The Hospital segment is expected to remain the dominant market for Medical Intraocular Lenses, driven by the availability of advanced surgical facilities, a higher volume of cataract surgeries, and the capacity to handle complex cases. Approximately 70% of all IOL procedures are performed in hospital settings. Clinics, particularly specialized ophthalmology clinics, represent a significant and growing segment, offering convenient and often more cost-effective solutions for routine cataract surgeries. The "Others" segment, encompassing ambulatory surgical centers and smaller private practices, also contributes to market demand. Within IOL types, the Monofocal Intraocular Lens continues to hold a substantial market share due to its affordability and effectiveness in providing clear distance vision. However, the fastest growth is anticipated in the advanced IOL segments. Multifocal Intraocular Lenses are experiencing accelerated adoption as they address both cataract and presbyopia simultaneously, improving near, intermediate, and distance vision. Toric Intraocular Lenses are also seeing significant growth due to the high prevalence of astigmatism among the cataract patient population and the increasing demand for astigmatism correction during cataract surgery. Extended Depth of Field (EDOF) Intraocular Lenses are emerging as a premium option, offering a continuous range of vision and minimizing halos and glare often associated with older multifocal designs. Key growth drivers for the dominance of these segments include government initiatives aimed at improving eye healthcare, increasing healthcare expenditure, and advancements in surgical techniques that facilitate the implantation of more complex IOLs. The North American region, particularly the United States, is a leading market due to its advanced healthcare infrastructure, high disposable incomes, and strong adoption of new technologies. European countries also exhibit significant market penetration for advanced IOLs.
Medical Intraocular Lens Product Analysis
Product innovations in the Medical Intraocular Lens market are centered on delivering enhanced visual acuity, expanded functional vision, and improved patient comfort. Manufacturers are focusing on developing lenses with superior optical designs, advanced materials, and integrated features. Monofocal IOLs continue to evolve with improved optical designs for sharper vision. Multifocal IOLs are progressing with more sophisticated diffractive or refractive technologies to provide better visual outcomes across multiple focal planes with reduced visual disturbances like glare and halos. Toric IOLs are becoming more precise in their astigmatism correction and offer a wider range of power options. EDOF IOLs are a significant area of innovation, aiming to provide a continuous range of vision with fewer visual trade-offs. Competitive advantages lie in offering lenses that minimize spectacle dependence, improve contrast sensitivity in various lighting conditions, and provide predictable surgical outcomes.
Key Drivers, Barriers & Challenges in Medical Intraocular Lens
The Medical Intraocular Lens market is propelled by several key drivers. Technological advancements in lens design and surgical techniques are paramount, enabling the correction of a wider range of visual impairments. The increasing global prevalence of age-related eye conditions like cataracts, coupled with a growing and aging population, creates a continuous demand for IOLs. Economic factors, such as rising healthcare expenditure and the growing middle class in emerging economies, are expanding market access. Government initiatives promoting eye health and access to surgical care also play a vital role.
Conversely, several barriers and challenges exist. The high cost of premium IOLs can limit adoption among price-sensitive populations and in healthcare systems with limited reimbursement. Stringent regulatory approval processes in different countries can lead to delays in market entry for new products. Supply chain disruptions, as observed during global health crises, can impact the availability of essential components and finished products. Intense competitive pressure from established and emerging players necessitates continuous innovation and strategic pricing. Reimbursement policies in various countries can also be a significant restraint, particularly for advanced and more expensive IOLs.
Growth Drivers in the Medical Intraocular Lens Market
Growth in the Medical Intraocular Lens market is primarily fueled by technological innovation, leading to the development of premium lenses with enhanced functionalities. The global aging population and the consequent rise in cataract incidence are foundational growth catalysts. Increasing healthcare expenditure, both public and private, in developed and developing nations, expands patient access to vision correction procedures. Moreover, advancements in surgical techniques, such as femtosecond laser-assisted cataract surgery, are improving outcomes and encouraging the adoption of sophisticated IOLs. Favorable government policies and health initiatives aimed at reducing blindness also contribute significantly to market expansion.
Challenges Impacting Medical Intraocular Lens Growth
Challenges impacting Medical Intraocular Lens growth include the high cost associated with premium IOLs, which can pose a barrier to widespread adoption, especially in price-sensitive markets. Complex and time-consuming regulatory approval pathways in various regions can slow down the launch of innovative products. Supply chain vulnerabilities, susceptible to global events, can lead to manufacturing delays and product shortages. Intense competition among manufacturers often leads to price pressures, impacting profit margins. Furthermore, varying reimbursement policies across different healthcare systems can affect the affordability and accessibility of advanced IOLs for patients.
Key Players Shaping the Medical Intraocular Lens Market
- Allergan
- Carl Zeiss
- Six Six Vision
- Haohai Biotechnology
- Essilor
- Novartis
- Aibo Nord (Beijing) Medical Technology
- Wuxi Leiming Shikang Technology
- Henan Universe Intraocular Lens Development
- Tianjin Century Kangtai Biomedical Engineering
- Haohai Biotechnology
Significant Medical Intraocular Lens Industry Milestones
- 2019/08: Launch of a novel extended depth of field (EDOF) IOL by a leading player, expanding the range of spectacle independence.
- 2020/03: Significant supply chain disruptions due to global pandemic impact, leading to temporary shortages of certain IOL components.
- 2021/07: Major merger between two significant IOL manufacturers to consolidate market presence and R&D capabilities, valued at approximately $1.2 billion.
- 2022/01: Introduction of a new generation of toric IOLs with improved astigmatism correction accuracy.
- 2023/05: Regulatory approval for a groundbreaking multifocal IOL designed to reduce glare and halos.
- 2024/02: Increased investment in digital ophthalmology platforms to support IOL selection and patient follow-up.
Future Outlook for Medical Intraocular Lens Market
The future outlook for the Medical Intraocular Lens market is exceptionally bright, driven by ongoing advancements in lens technology and an expanding global demand. The continuous development of premium IOLs offering improved visual performance, such as next-generation EDOF and multifocal designs with enhanced aberration control, will be a key growth catalyst. The increasing adoption of femtosecond laser technology for enhanced surgical precision further bolsters the market. Strategic opportunities lie in penetrating emerging markets with growing healthcare infrastructure and rising disposable incomes. The market is expected to witness sustained growth, driven by the unmet need for comprehensive vision correction solutions in an aging global population and the ongoing pursuit of improved quality of life through enhanced vision.
Medical Intraocular Lens Segmentation
-
1. Application
- 1.1. Hospital
- 1.2. Clinic
- 1.3. Others
-
2. Type
- 2.1. Monofocal Intraocular Lens
- 2.2. Multifocal Intraocular Lens
- 2.3. Toric Intraocular Lens
- 2.4. Extended Depth of Field Intraocular Lens
Medical Intraocular Lens Segmentation By Geography
-
1. North America
- 1.1. United States
- 1.2. Canada
- 1.3. Mexico
-
2. South America
- 2.1. Brazil
- 2.2. Argentina
- 2.3. Rest of South America
-
3. Europe
- 3.1. United Kingdom
- 3.2. Germany
- 3.3. France
- 3.4. Italy
- 3.5. Spain
- 3.6. Russia
- 3.7. Benelux
- 3.8. Nordics
- 3.9. Rest of Europe
-
4. Middle East & Africa
- 4.1. Turkey
- 4.2. Israel
- 4.3. GCC
- 4.4. North Africa
- 4.5. South Africa
- 4.6. Rest of Middle East & Africa
-
5. Asia Pacific
- 5.1. China
- 5.2. India
- 5.3. Japan
- 5.4. South Korea
- 5.5. ASEAN
- 5.6. Oceania
- 5.7. Rest of Asia Pacific

Medical Intraocular Lens Regional Market Share
Geographic Coverage of Medical Intraocular Lens
Medical Intraocular Lens REPORT HIGHLIGHTS
| Aspects | Details |
|---|---|
| Study Period | 2020-2034 |
| Base Year | 2025 |
| Estimated Year | 2026 |
| Forecast Period | 2026-2034 |
| Historical Period | 2020-2025 |
| Growth Rate | CAGR of 6% from 2020-2034 |
| Segmentation |
|
Table of Contents
- 1. Introduction
- 1.1. Research Scope
- 1.2. Market Segmentation
- 1.3. Research Methodology
- 1.4. Definitions and Assumptions
- 2. Executive Summary
- 2.1. Introduction
- 3. Market Dynamics
- 3.1. Introduction
- 3.2. Market Drivers
- 3.3. Market Restrains
- 3.4. Market Trends
- 4. Market Factor Analysis
- 4.1. Porters Five Forces
- 4.2. Supply/Value Chain
- 4.3. PESTEL analysis
- 4.4. Market Entropy
- 4.5. Patent/Trademark Analysis
- 5. Global Medical Intraocular Lens Analysis, Insights and Forecast, 2020-2032
- 5.1. Market Analysis, Insights and Forecast - by Application
- 5.1.1. Hospital
- 5.1.2. Clinic
- 5.1.3. Others
- 5.2. Market Analysis, Insights and Forecast - by Type
- 5.2.1. Monofocal Intraocular Lens
- 5.2.2. Multifocal Intraocular Lens
- 5.2.3. Toric Intraocular Lens
- 5.2.4. Extended Depth of Field Intraocular Lens
- 5.3. Market Analysis, Insights and Forecast - by Region
- 5.3.1. North America
- 5.3.2. South America
- 5.3.3. Europe
- 5.3.4. Middle East & Africa
- 5.3.5. Asia Pacific
- 5.1. Market Analysis, Insights and Forecast - by Application
- 6. North America Medical Intraocular Lens Analysis, Insights and Forecast, 2020-2032
- 6.1. Market Analysis, Insights and Forecast - by Application
- 6.1.1. Hospital
- 6.1.2. Clinic
- 6.1.3. Others
- 6.2. Market Analysis, Insights and Forecast - by Type
- 6.2.1. Monofocal Intraocular Lens
- 6.2.2. Multifocal Intraocular Lens
- 6.2.3. Toric Intraocular Lens
- 6.2.4. Extended Depth of Field Intraocular Lens
- 6.1. Market Analysis, Insights and Forecast - by Application
- 7. South America Medical Intraocular Lens Analysis, Insights and Forecast, 2020-2032
- 7.1. Market Analysis, Insights and Forecast - by Application
- 7.1.1. Hospital
- 7.1.2. Clinic
- 7.1.3. Others
- 7.2. Market Analysis, Insights and Forecast - by Type
- 7.2.1. Monofocal Intraocular Lens
- 7.2.2. Multifocal Intraocular Lens
- 7.2.3. Toric Intraocular Lens
- 7.2.4. Extended Depth of Field Intraocular Lens
- 7.1. Market Analysis, Insights and Forecast - by Application
- 8. Europe Medical Intraocular Lens Analysis, Insights and Forecast, 2020-2032
- 8.1. Market Analysis, Insights and Forecast - by Application
- 8.1.1. Hospital
- 8.1.2. Clinic
- 8.1.3. Others
- 8.2. Market Analysis, Insights and Forecast - by Type
- 8.2.1. Monofocal Intraocular Lens
- 8.2.2. Multifocal Intraocular Lens
- 8.2.3. Toric Intraocular Lens
- 8.2.4. Extended Depth of Field Intraocular Lens
- 8.1. Market Analysis, Insights and Forecast - by Application
- 9. Middle East & Africa Medical Intraocular Lens Analysis, Insights and Forecast, 2020-2032
- 9.1. Market Analysis, Insights and Forecast - by Application
- 9.1.1. Hospital
- 9.1.2. Clinic
- 9.1.3. Others
- 9.2. Market Analysis, Insights and Forecast - by Type
- 9.2.1. Monofocal Intraocular Lens
- 9.2.2. Multifocal Intraocular Lens
- 9.2.3. Toric Intraocular Lens
- 9.2.4. Extended Depth of Field Intraocular Lens
- 9.1. Market Analysis, Insights and Forecast - by Application
- 10. Asia Pacific Medical Intraocular Lens Analysis, Insights and Forecast, 2020-2032
- 10.1. Market Analysis, Insights and Forecast - by Application
- 10.1.1. Hospital
- 10.1.2. Clinic
- 10.1.3. Others
- 10.2. Market Analysis, Insights and Forecast - by Type
- 10.2.1. Monofocal Intraocular Lens
- 10.2.2. Multifocal Intraocular Lens
- 10.2.3. Toric Intraocular Lens
- 10.2.4. Extended Depth of Field Intraocular Lens
- 10.1. Market Analysis, Insights and Forecast - by Application
- 11. Competitive Analysis
- 11.1. Global Market Share Analysis 2025
- 11.2. Company Profiles
- 11.2.1 Allergan
- 11.2.1.1. Overview
- 11.2.1.2. Products
- 11.2.1.3. SWOT Analysis
- 11.2.1.4. Recent Developments
- 11.2.1.5. Financials (Based on Availability)
- 11.2.2 Carl Zeiss
- 11.2.2.1. Overview
- 11.2.2.2. Products
- 11.2.2.3. SWOT Analysis
- 11.2.2.4. Recent Developments
- 11.2.2.5. Financials (Based on Availability)
- 11.2.3 Six Six Vision
- 11.2.3.1. Overview
- 11.2.3.2. Products
- 11.2.3.3. SWOT Analysis
- 11.2.3.4. Recent Developments
- 11.2.3.5. Financials (Based on Availability)
- 11.2.4 Haohai Biotechnology
- 11.2.4.1. Overview
- 11.2.4.2. Products
- 11.2.4.3. SWOT Analysis
- 11.2.4.4. Recent Developments
- 11.2.4.5. Financials (Based on Availability)
- 11.2.5 Essilor
- 11.2.5.1. Overview
- 11.2.5.2. Products
- 11.2.5.3. SWOT Analysis
- 11.2.5.4. Recent Developments
- 11.2.5.5. Financials (Based on Availability)
- 11.2.6 Novartis
- 11.2.6.1. Overview
- 11.2.6.2. Products
- 11.2.6.3. SWOT Analysis
- 11.2.6.4. Recent Developments
- 11.2.6.5. Financials (Based on Availability)
- 11.2.7 Aibo Nord (Beijing) Medical Technology
- 11.2.7.1. Overview
- 11.2.7.2. Products
- 11.2.7.3. SWOT Analysis
- 11.2.7.4. Recent Developments
- 11.2.7.5. Financials (Based on Availability)
- 11.2.8 Wuxi Leiming Shikang Technology
- 11.2.8.1. Overview
- 11.2.8.2. Products
- 11.2.8.3. SWOT Analysis
- 11.2.8.4. Recent Developments
- 11.2.8.5. Financials (Based on Availability)
- 11.2.9 Henan Universe Intraocular Lens Development
- 11.2.9.1. Overview
- 11.2.9.2. Products
- 11.2.9.3. SWOT Analysis
- 11.2.9.4. Recent Developments
- 11.2.9.5. Financials (Based on Availability)
- 11.2.10 Tianjin Century Kangtai Biomedical Engineering
- 11.2.10.1. Overview
- 11.2.10.2. Products
- 11.2.10.3. SWOT Analysis
- 11.2.10.4. Recent Developments
- 11.2.10.5. Financials (Based on Availability)
- 11.2.11 Haohai Biotechnology
- 11.2.11.1. Overview
- 11.2.11.2. Products
- 11.2.11.3. SWOT Analysis
- 11.2.11.4. Recent Developments
- 11.2.11.5. Financials (Based on Availability)
- 11.2.1 Allergan
List of Figures
- Figure 1: Global Medical Intraocular Lens Revenue Breakdown (undefined, %) by Region 2025 & 2033
- Figure 2: Global Medical Intraocular Lens Volume Breakdown (K, %) by Region 2025 & 2033
- Figure 3: North America Medical Intraocular Lens Revenue (undefined), by Application 2025 & 2033
- Figure 4: North America Medical Intraocular Lens Volume (K), by Application 2025 & 2033
- Figure 5: North America Medical Intraocular Lens Revenue Share (%), by Application 2025 & 2033
- Figure 6: North America Medical Intraocular Lens Volume Share (%), by Application 2025 & 2033
- Figure 7: North America Medical Intraocular Lens Revenue (undefined), by Type 2025 & 2033
- Figure 8: North America Medical Intraocular Lens Volume (K), by Type 2025 & 2033
- Figure 9: North America Medical Intraocular Lens Revenue Share (%), by Type 2025 & 2033
- Figure 10: North America Medical Intraocular Lens Volume Share (%), by Type 2025 & 2033
- Figure 11: North America Medical Intraocular Lens Revenue (undefined), by Country 2025 & 2033
- Figure 12: North America Medical Intraocular Lens Volume (K), by Country 2025 & 2033
- Figure 13: North America Medical Intraocular Lens Revenue Share (%), by Country 2025 & 2033
- Figure 14: North America Medical Intraocular Lens Volume Share (%), by Country 2025 & 2033
- Figure 15: South America Medical Intraocular Lens Revenue (undefined), by Application 2025 & 2033
- Figure 16: South America Medical Intraocular Lens Volume (K), by Application 2025 & 2033
- Figure 17: South America Medical Intraocular Lens Revenue Share (%), by Application 2025 & 2033
- Figure 18: South America Medical Intraocular Lens Volume Share (%), by Application 2025 & 2033
- Figure 19: South America Medical Intraocular Lens Revenue (undefined), by Type 2025 & 2033
- Figure 20: South America Medical Intraocular Lens Volume (K), by Type 2025 & 2033
- Figure 21: South America Medical Intraocular Lens Revenue Share (%), by Type 2025 & 2033
- Figure 22: South America Medical Intraocular Lens Volume Share (%), by Type 2025 & 2033
- Figure 23: South America Medical Intraocular Lens Revenue (undefined), by Country 2025 & 2033
- Figure 24: South America Medical Intraocular Lens Volume (K), by Country 2025 & 2033
- Figure 25: South America Medical Intraocular Lens Revenue Share (%), by Country 2025 & 2033
- Figure 26: South America Medical Intraocular Lens Volume Share (%), by Country 2025 & 2033
- Figure 27: Europe Medical Intraocular Lens Revenue (undefined), by Application 2025 & 2033
- Figure 28: Europe Medical Intraocular Lens Volume (K), by Application 2025 & 2033
- Figure 29: Europe Medical Intraocular Lens Revenue Share (%), by Application 2025 & 2033
- Figure 30: Europe Medical Intraocular Lens Volume Share (%), by Application 2025 & 2033
- Figure 31: Europe Medical Intraocular Lens Revenue (undefined), by Type 2025 & 2033
- Figure 32: Europe Medical Intraocular Lens Volume (K), by Type 2025 & 2033
- Figure 33: Europe Medical Intraocular Lens Revenue Share (%), by Type 2025 & 2033
- Figure 34: Europe Medical Intraocular Lens Volume Share (%), by Type 2025 & 2033
- Figure 35: Europe Medical Intraocular Lens Revenue (undefined), by Country 2025 & 2033
- Figure 36: Europe Medical Intraocular Lens Volume (K), by Country 2025 & 2033
- Figure 37: Europe Medical Intraocular Lens Revenue Share (%), by Country 2025 & 2033
- Figure 38: Europe Medical Intraocular Lens Volume Share (%), by Country 2025 & 2033
- Figure 39: Middle East & Africa Medical Intraocular Lens Revenue (undefined), by Application 2025 & 2033
- Figure 40: Middle East & Africa Medical Intraocular Lens Volume (K), by Application 2025 & 2033
- Figure 41: Middle East & Africa Medical Intraocular Lens Revenue Share (%), by Application 2025 & 2033
- Figure 42: Middle East & Africa Medical Intraocular Lens Volume Share (%), by Application 2025 & 2033
- Figure 43: Middle East & Africa Medical Intraocular Lens Revenue (undefined), by Type 2025 & 2033
- Figure 44: Middle East & Africa Medical Intraocular Lens Volume (K), by Type 2025 & 2033
- Figure 45: Middle East & Africa Medical Intraocular Lens Revenue Share (%), by Type 2025 & 2033
- Figure 46: Middle East & Africa Medical Intraocular Lens Volume Share (%), by Type 2025 & 2033
- Figure 47: Middle East & Africa Medical Intraocular Lens Revenue (undefined), by Country 2025 & 2033
- Figure 48: Middle East & Africa Medical Intraocular Lens Volume (K), by Country 2025 & 2033
- Figure 49: Middle East & Africa Medical Intraocular Lens Revenue Share (%), by Country 2025 & 2033
- Figure 50: Middle East & Africa Medical Intraocular Lens Volume Share (%), by Country 2025 & 2033
- Figure 51: Asia Pacific Medical Intraocular Lens Revenue (undefined), by Application 2025 & 2033
- Figure 52: Asia Pacific Medical Intraocular Lens Volume (K), by Application 2025 & 2033
- Figure 53: Asia Pacific Medical Intraocular Lens Revenue Share (%), by Application 2025 & 2033
- Figure 54: Asia Pacific Medical Intraocular Lens Volume Share (%), by Application 2025 & 2033
- Figure 55: Asia Pacific Medical Intraocular Lens Revenue (undefined), by Type 2025 & 2033
- Figure 56: Asia Pacific Medical Intraocular Lens Volume (K), by Type 2025 & 2033
- Figure 57: Asia Pacific Medical Intraocular Lens Revenue Share (%), by Type 2025 & 2033
- Figure 58: Asia Pacific Medical Intraocular Lens Volume Share (%), by Type 2025 & 2033
- Figure 59: Asia Pacific Medical Intraocular Lens Revenue (undefined), by Country 2025 & 2033
- Figure 60: Asia Pacific Medical Intraocular Lens Volume (K), by Country 2025 & 2033
- Figure 61: Asia Pacific Medical Intraocular Lens Revenue Share (%), by Country 2025 & 2033
- Figure 62: Asia Pacific Medical Intraocular Lens Volume Share (%), by Country 2025 & 2033
List of Tables
- Table 1: Global Medical Intraocular Lens Revenue undefined Forecast, by Application 2020 & 2033
- Table 2: Global Medical Intraocular Lens Volume K Forecast, by Application 2020 & 2033
- Table 3: Global Medical Intraocular Lens Revenue undefined Forecast, by Type 2020 & 2033
- Table 4: Global Medical Intraocular Lens Volume K Forecast, by Type 2020 & 2033
- Table 5: Global Medical Intraocular Lens Revenue undefined Forecast, by Region 2020 & 2033
- Table 6: Global Medical Intraocular Lens Volume K Forecast, by Region 2020 & 2033
- Table 7: Global Medical Intraocular Lens Revenue undefined Forecast, by Application 2020 & 2033
- Table 8: Global Medical Intraocular Lens Volume K Forecast, by Application 2020 & 2033
- Table 9: Global Medical Intraocular Lens Revenue undefined Forecast, by Type 2020 & 2033
- Table 10: Global Medical Intraocular Lens Volume K Forecast, by Type 2020 & 2033
- Table 11: Global Medical Intraocular Lens Revenue undefined Forecast, by Country 2020 & 2033
- Table 12: Global Medical Intraocular Lens Volume K Forecast, by Country 2020 & 2033
- Table 13: United States Medical Intraocular Lens Revenue (undefined) Forecast, by Application 2020 & 2033
- Table 14: United States Medical Intraocular Lens Volume (K) Forecast, by Application 2020 & 2033
- Table 15: Canada Medical Intraocular Lens Revenue (undefined) Forecast, by Application 2020 & 2033
- Table 16: Canada Medical Intraocular Lens Volume (K) Forecast, by Application 2020 & 2033
- Table 17: Mexico Medical Intraocular Lens Revenue (undefined) Forecast, by Application 2020 & 2033
- Table 18: Mexico Medical Intraocular Lens Volume (K) Forecast, by Application 2020 & 2033
- Table 19: Global Medical Intraocular Lens Revenue undefined Forecast, by Application 2020 & 2033
- Table 20: Global Medical Intraocular Lens Volume K Forecast, by Application 2020 & 2033
- Table 21: Global Medical Intraocular Lens Revenue undefined Forecast, by Type 2020 & 2033
- Table 22: Global Medical Intraocular Lens Volume K Forecast, by Type 2020 & 2033
- Table 23: Global Medical Intraocular Lens Revenue undefined Forecast, by Country 2020 & 2033
- Table 24: Global Medical Intraocular Lens Volume K Forecast, by Country 2020 & 2033
- Table 25: Brazil Medical Intraocular Lens Revenue (undefined) Forecast, by Application 2020 & 2033
- Table 26: Brazil Medical Intraocular Lens Volume (K) Forecast, by Application 2020 & 2033
- Table 27: Argentina Medical Intraocular Lens Revenue (undefined) Forecast, by Application 2020 & 2033
- Table 28: Argentina Medical Intraocular Lens Volume (K) Forecast, by Application 2020 & 2033
- Table 29: Rest of South America Medical Intraocular Lens Revenue (undefined) Forecast, by Application 2020 & 2033
- Table 30: Rest of South America Medical Intraocular Lens Volume (K) Forecast, by Application 2020 & 2033
- Table 31: Global Medical Intraocular Lens Revenue undefined Forecast, by Application 2020 & 2033
- Table 32: Global Medical Intraocular Lens Volume K Forecast, by Application 2020 & 2033
- Table 33: Global Medical Intraocular Lens Revenue undefined Forecast, by Type 2020 & 2033
- Table 34: Global Medical Intraocular Lens Volume K Forecast, by Type 2020 & 2033
- Table 35: Global Medical Intraocular Lens Revenue undefined Forecast, by Country 2020 & 2033
- Table 36: Global Medical Intraocular Lens Volume K Forecast, by Country 2020 & 2033
- Table 37: United Kingdom Medical Intraocular Lens Revenue (undefined) Forecast, by Application 2020 & 2033
- Table 38: United Kingdom Medical Intraocular Lens Volume (K) Forecast, by Application 2020 & 2033
- Table 39: Germany Medical Intraocular Lens Revenue (undefined) Forecast, by Application 2020 & 2033
- Table 40: Germany Medical Intraocular Lens Volume (K) Forecast, by Application 2020 & 2033
- Table 41: France Medical Intraocular Lens Revenue (undefined) Forecast, by Application 2020 & 2033
- Table 42: France Medical Intraocular Lens Volume (K) Forecast, by Application 2020 & 2033
- Table 43: Italy Medical Intraocular Lens Revenue (undefined) Forecast, by Application 2020 & 2033
- Table 44: Italy Medical Intraocular Lens Volume (K) Forecast, by Application 2020 & 2033
- Table 45: Spain Medical Intraocular Lens Revenue (undefined) Forecast, by Application 2020 & 2033
- Table 46: Spain Medical Intraocular Lens Volume (K) Forecast, by Application 2020 & 2033
- Table 47: Russia Medical Intraocular Lens Revenue (undefined) Forecast, by Application 2020 & 2033
- Table 48: Russia Medical Intraocular Lens Volume (K) Forecast, by Application 2020 & 2033
- Table 49: Benelux Medical Intraocular Lens Revenue (undefined) Forecast, by Application 2020 & 2033
- Table 50: Benelux Medical Intraocular Lens Volume (K) Forecast, by Application 2020 & 2033
- Table 51: Nordics Medical Intraocular Lens Revenue (undefined) Forecast, by Application 2020 & 2033
- Table 52: Nordics Medical Intraocular Lens Volume (K) Forecast, by Application 2020 & 2033
- Table 53: Rest of Europe Medical Intraocular Lens Revenue (undefined) Forecast, by Application 2020 & 2033
- Table 54: Rest of Europe Medical Intraocular Lens Volume (K) Forecast, by Application 2020 & 2033
- Table 55: Global Medical Intraocular Lens Revenue undefined Forecast, by Application 2020 & 2033
- Table 56: Global Medical Intraocular Lens Volume K Forecast, by Application 2020 & 2033
- Table 57: Global Medical Intraocular Lens Revenue undefined Forecast, by Type 2020 & 2033
- Table 58: Global Medical Intraocular Lens Volume K Forecast, by Type 2020 & 2033
- Table 59: Global Medical Intraocular Lens Revenue undefined Forecast, by Country 2020 & 2033
- Table 60: Global Medical Intraocular Lens Volume K Forecast, by Country 2020 & 2033
- Table 61: Turkey Medical Intraocular Lens Revenue (undefined) Forecast, by Application 2020 & 2033
- Table 62: Turkey Medical Intraocular Lens Volume (K) Forecast, by Application 2020 & 2033
- Table 63: Israel Medical Intraocular Lens Revenue (undefined) Forecast, by Application 2020 & 2033
- Table 64: Israel Medical Intraocular Lens Volume (K) Forecast, by Application 2020 & 2033
- Table 65: GCC Medical Intraocular Lens Revenue (undefined) Forecast, by Application 2020 & 2033
- Table 66: GCC Medical Intraocular Lens Volume (K) Forecast, by Application 2020 & 2033
- Table 67: North Africa Medical Intraocular Lens Revenue (undefined) Forecast, by Application 2020 & 2033
- Table 68: North Africa Medical Intraocular Lens Volume (K) Forecast, by Application 2020 & 2033
- Table 69: South Africa Medical Intraocular Lens Revenue (undefined) Forecast, by Application 2020 & 2033
- Table 70: South Africa Medical Intraocular Lens Volume (K) Forecast, by Application 2020 & 2033
- Table 71: Rest of Middle East & Africa Medical Intraocular Lens Revenue (undefined) Forecast, by Application 2020 & 2033
- Table 72: Rest of Middle East & Africa Medical Intraocular Lens Volume (K) Forecast, by Application 2020 & 2033
- Table 73: Global Medical Intraocular Lens Revenue undefined Forecast, by Application 2020 & 2033
- Table 74: Global Medical Intraocular Lens Volume K Forecast, by Application 2020 & 2033
- Table 75: Global Medical Intraocular Lens Revenue undefined Forecast, by Type 2020 & 2033
- Table 76: Global Medical Intraocular Lens Volume K Forecast, by Type 2020 & 2033
- Table 77: Global Medical Intraocular Lens Revenue undefined Forecast, by Country 2020 & 2033
- Table 78: Global Medical Intraocular Lens Volume K Forecast, by Country 2020 & 2033
- Table 79: China Medical Intraocular Lens Revenue (undefined) Forecast, by Application 2020 & 2033
- Table 80: China Medical Intraocular Lens Volume (K) Forecast, by Application 2020 & 2033
- Table 81: India Medical Intraocular Lens Revenue (undefined) Forecast, by Application 2020 & 2033
- Table 82: India Medical Intraocular Lens Volume (K) Forecast, by Application 2020 & 2033
- Table 83: Japan Medical Intraocular Lens Revenue (undefined) Forecast, by Application 2020 & 2033
- Table 84: Japan Medical Intraocular Lens Volume (K) Forecast, by Application 2020 & 2033
- Table 85: South Korea Medical Intraocular Lens Revenue (undefined) Forecast, by Application 2020 & 2033
- Table 86: South Korea Medical Intraocular Lens Volume (K) Forecast, by Application 2020 & 2033
- Table 87: ASEAN Medical Intraocular Lens Revenue (undefined) Forecast, by Application 2020 & 2033
- Table 88: ASEAN Medical Intraocular Lens Volume (K) Forecast, by Application 2020 & 2033
- Table 89: Oceania Medical Intraocular Lens Revenue (undefined) Forecast, by Application 2020 & 2033
- Table 90: Oceania Medical Intraocular Lens Volume (K) Forecast, by Application 2020 & 2033
- Table 91: Rest of Asia Pacific Medical Intraocular Lens Revenue (undefined) Forecast, by Application 2020 & 2033
- Table 92: Rest of Asia Pacific Medical Intraocular Lens Volume (K) Forecast, by Application 2020 & 2033
Frequently Asked Questions
1. What is the projected Compound Annual Growth Rate (CAGR) of the Medical Intraocular Lens?
The projected CAGR is approximately 6%.
2. Which companies are prominent players in the Medical Intraocular Lens?
Key companies in the market include Allergan, Carl Zeiss, Six Six Vision, Haohai Biotechnology, Essilor, Novartis, Aibo Nord (Beijing) Medical Technology, Wuxi Leiming Shikang Technology, Henan Universe Intraocular Lens Development, Tianjin Century Kangtai Biomedical Engineering, Haohai Biotechnology.
3. What are the main segments of the Medical Intraocular Lens?
The market segments include Application, Type.
4. Can you provide details about the market size?
The market size is estimated to be USD XXX N/A as of 2022.
5. What are some drivers contributing to market growth?
N/A
6. What are the notable trends driving market growth?
N/A
7. Are there any restraints impacting market growth?
N/A
8. Can you provide examples of recent developments in the market?
N/A
9. What pricing options are available for accessing the report?
Pricing options include single-user, multi-user, and enterprise licenses priced at USD 3950.00, USD 5925.00, and USD 7900.00 respectively.
10. Is the market size provided in terms of value or volume?
The market size is provided in terms of value, measured in N/A and volume, measured in K.
11. Are there any specific market keywords associated with the report?
Yes, the market keyword associated with the report is "Medical Intraocular Lens," which aids in identifying and referencing the specific market segment covered.
12. How do I determine which pricing option suits my needs best?
The pricing options vary based on user requirements and access needs. Individual users may opt for single-user licenses, while businesses requiring broader access may choose multi-user or enterprise licenses for cost-effective access to the report.
13. Are there any additional resources or data provided in the Medical Intraocular Lens report?
While the report offers comprehensive insights, it's advisable to review the specific contents or supplementary materials provided to ascertain if additional resources or data are available.
14. How can I stay updated on further developments or reports in the Medical Intraocular Lens?
To stay informed about further developments, trends, and reports in the Medical Intraocular Lens, consider subscribing to industry newsletters, following relevant companies and organizations, or regularly checking reputable industry news sources and publications.
Methodology
Step 1 - Identification of Relevant Samples Size from Population Database


Step 2 - Approaches for Defining Global Market Size (Value, Volume* & Price*)

Note*: In applicable scenarios
Step 3 - Data Sources
Primary Research
- Web Analytics
- Survey Reports
- Research Institute
- Latest Research Reports
- Opinion Leaders
Secondary Research
- Annual Reports
- White Paper
- Latest Press Release
- Industry Association
- Paid Database
- Investor Presentations

Step 4 - Data Triangulation
Involves using different sources of information in order to increase the validity of a study
These sources are likely to be stakeholders in a program - participants, other researchers, program staff, other community members, and so on.
Then we put all data in single framework & apply various statistical tools to find out the dynamic on the market.
During the analysis stage, feedback from the stakeholder groups would be compared to determine areas of agreement as well as areas of divergence