

Key Insights
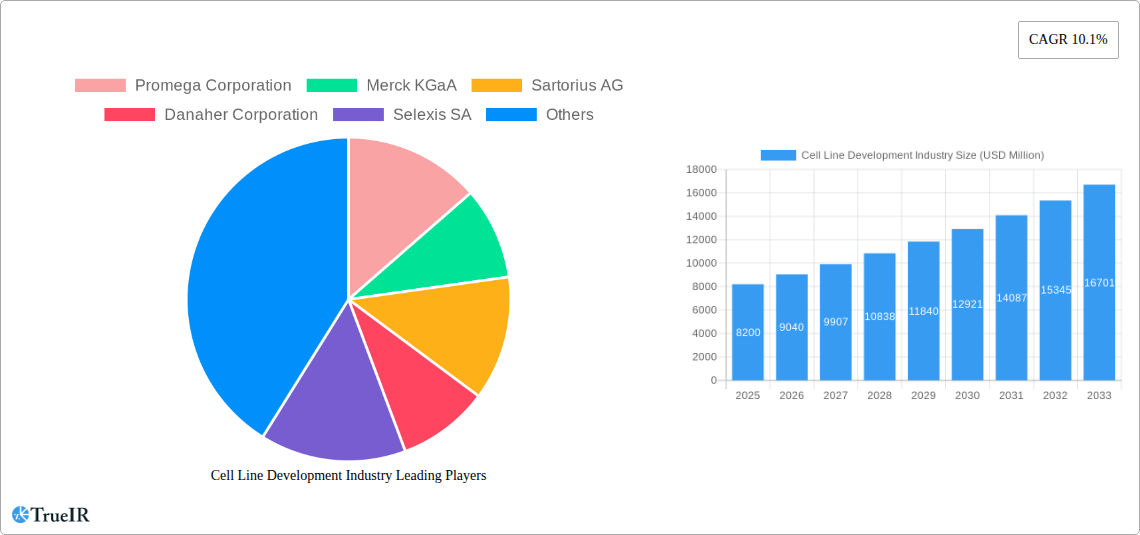
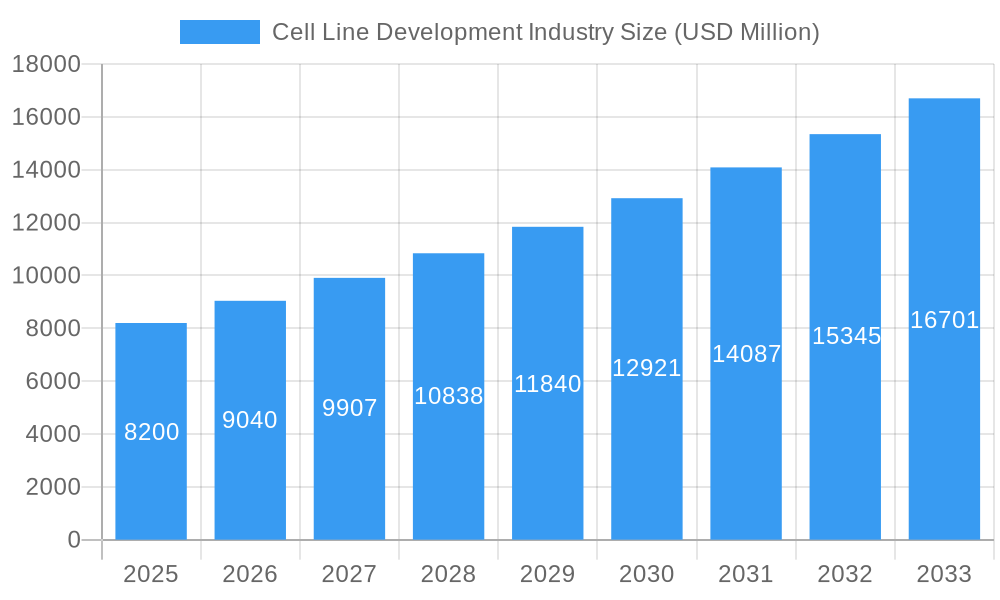
The global Cell Line Development industry is poised for significant expansion, projected to reach an estimated $8.2 billion in 2025. This robust growth is fueled by a compelling CAGR of 10.2% anticipated throughout the forecast period of 2025-2033. The increasing demand for biologics, including therapeutic proteins and vaccines, is a primary driver. Advancements in biotechnology, such as gene editing technologies and sophisticated cell culture techniques, are enabling more efficient and higher-yield cell line development, thereby lowering production costs and accelerating drug development timelines. The industry is witnessing a surge in investment in research and development, particularly within the biopharmaceutical sector, to address unmet medical needs and develop novel therapies. Furthermore, the rising prevalence of chronic diseases globally necessitates the development of advanced biopharmaceuticals, directly contributing to the growth of the cell line development market.
Cell Line Development Industry Market Size (In Billion)
The market segments are characterized by a strong performance in Reagent and Media and Equipment, essential components for effective cell line development. The Mammalian Cell Line segment continues to dominate owing to its suitability for producing complex therapeutic proteins. Key applications like Recombinant Protein Expression and Drug Discovery are at the forefront, reflecting the industry's focus on novel biopharmaceutical development. The Biotech and Pharmaceutical Companies remain the largest end-user segment, leveraging cell line development for their R&D and manufacturing pipelines. Geographically, North America and Europe currently lead the market due to established healthcare infrastructure and significant R&D investments. However, the Asia Pacific region is exhibiting the fastest growth, driven by increasing government support for biotech innovation, a growing pharmaceutical industry, and a large patient pool. Restraints such as the high cost of R&D and stringent regulatory hurdles are being mitigated by technological innovations and strategic collaborations.
Cell Line Development Industry Company Market Share
This comprehensive report delves into the dynamic Cell Line Development Industry, a critical sector fueling advancements in biopharmaceuticals and therapies. With a Study Period of 2019–2033, this analysis provides deep insights into market dynamics, technological innovations, and competitive strategies. The Base Year is 2025, with an Estimated Year also in 2025, and the Forecast Period extends from 2025–2033, building upon a Historical Period of 2019–2024. Our robust analysis leverages high-volume keywords to empower stakeholders with actionable intelligence, covering everything from cutting-edge recombinant protein expression and drug discovery to vaccine production and hybridoma technology. Discover the immense market opportunities within mammalian cell lines and non-mammalian cell lines, and understand the strategic advantages offered by leading companies like Promega Corporation, Merck KGaA, Sartorius AG, Danaher Corporation, Selexis SA, Fujifilm Corporation (Fujifilm Diosynth Biotechnologies), American Type Culture Collection (ATCC), WuXi Biologics, Thermo Fisher Scientific, and Corning Incorporated. This report is an indispensable resource for biotech and pharmaceutical companies, academic and research institutes, and all players navigating the billions-dollar cell line development market.
Cell Line Development Industry Market Structure & Competitive Landscape
The Cell Line Development Industry exhibits a moderately consolidated market structure, with a few dominant players holding significant market share. This concentration is driven by substantial investments in research and development, the complex regulatory landscape, and the specialized nature of cell line engineering. Innovation remains a primary driver, fueled by advancements in gene editing technologies like CRISPR-Cas9 and synthetic biology, enabling the development of more robust and productive cell lines. Regulatory impacts, while stringent, also shape the market by mandating high standards for safety and efficacy, thus favoring companies with proven track records and robust quality control systems. The threat of product substitutes is relatively low due to the unique and essential role of custom-developed cell lines in biopharmaceutical production.
- Market Concentration: Key players like Thermo Fisher Scientific, Merck KGaA, and WuXi Biologics command a substantial portion of the market, driven by their broad product portfolios and extensive service offerings.
- Innovation Drivers: Advancements in gene editing, high-throughput screening, and process optimization technologies are continuously pushing the boundaries of cell line productivity and stability.
- Regulatory Impacts: Stringent guidelines from regulatory bodies such as the FDA and EMA necessitate significant investment in quality assurance and compliance, acting as a barrier to entry for smaller players.
- Product Substitutes: While alternative methods for protein production exist, custom-developed cell lines remain the gold standard for complex biologics and therapeutic proteins.
- End-User Segmentation: Biotech and pharmaceutical companies constitute the largest end-user segment, followed by academic and research institutes.
- M&A Trends: The industry has witnessed several strategic mergers and acquisitions aimed at expanding service offerings, acquiring novel technologies, and increasing market reach. For instance, the acquisition of Selexis SA by Bio-Rad Laboratories significantly bolstered its cell line development capabilities. Recent collaborations, such as the one between ProBioGen and Granite Bio in July 2022, highlight the ongoing trend of strategic partnerships to enhance GMP manufacturing and cell line development services, impacting market dynamics and competition.
Cell Line Development Industry Market Trends & Opportunities
The Cell Line Development Industry is experiencing robust growth, projected to reach billions of dollars in market value. This expansion is fueled by an escalating demand for biologics, novel therapeutics, and vaccines. The market is characterized by a sustained Compound Annual Growth Rate (CAGR) of approximately 10-12% over the forecast period. Technological advancements are at the forefront of market trends, with a significant shift towards the utilization of advanced gene editing tools, such as CRISPR-Cas9, and high-throughput screening platforms. These innovations are dramatically improving the efficiency, speed, and quality of cell line development, enabling the creation of cell lines with enhanced productivity and stability for complex protein expression.
Consumer preferences are increasingly leaning towards personalized medicine and targeted therapies, necessitating the development of highly specific and potent biologics. This trend directly translates into a higher demand for sophisticated cell line development services capable of producing intricate therapeutic molecules. The competitive landscape is dynamic, with established players continuously investing in R&D and expanding their service portfolios. Furthermore, the emergence of novel drug discovery platforms and the increasing focus on rare diseases and orphan drugs are opening up new avenues for cell line development applications.
The market is also witnessing a growing trend towards outsourcing cell line development to Contract Development and Manufacturing Organizations (CDMOs). Companies are seeking specialized expertise and cost-effective solutions, leading to substantial growth for CDMOs like WuXi Biologics and Fujifilm Diosynth Biotechnologies. The strategic investment of USD 1.6 billion by FUJIFILM Corporation in June 2022 to enhance the cell culture manufacturing services of FUJIFILM Diosynth Biotechnologies exemplifies this trend and the commitment to scaling up production capacities to meet rising global demand.
Opportunities abound in the development of cell lines for next-generation biotherapeutics, including antibody-drug conjugates (ADCs), gene therapies, and cell therapies. The increasing prevalence of chronic diseases and the aging global population are further accelerating the demand for biologics, creating a sustained need for efficient and reliable cell line development solutions. The integration of artificial intelligence (AI) and machine learning (ML) in cell line engineering is another significant emerging trend, promising to optimize cell line selection, predict productivity, and reduce development timelines, thereby presenting substantial growth opportunities. The continuous pursuit of novel therapeutic targets and the expanding pipeline of biopharmaceuticals are ensuring a consistent demand for high-quality, well-characterized cell lines.
Dominant Markets & Segments in Cell Line Development Industry
The Cell Line Development Industry is characterized by dominant markets and segments driven by specific technological needs and application demands. The Mammalian Cell Line source segment holds a commanding position, accounting for over 75% of the market share. This dominance is attributed to the ability of mammalian cells, particularly CHO (Chinese Hamster Ovary) cells, to perform complex post-translational modifications essential for the proper folding, function, and therapeutic efficacy of many biologics.
Dominant Source:
- Mammalian Cell Line: This segment is the largest due to its superior capacity for producing complex glycoproteins, antibodies, and other therapeutic proteins that require human-like post-translational modifications. The market for mammalian cell line development is valued in the billions of dollars.
- Key Growth Drivers: Advancements in protein engineering, the increasing prevalence of monoclonal antibody-based therapies, and the need for high-yield, stable cell lines for biopharmaceutical manufacturing.
- Detailed Analysis: The reliance of the biopharmaceutical industry on recombinant proteins and complex biologics, such as monoclonal antibodies for cancer treatment and autoimmune diseases, solidifies the dominance of mammalian cell lines. Companies are continuously optimizing transfection technologies and selection methods to enhance productivity and reduce the time to generate master cell banks.
- Mammalian Cell Line: This segment is the largest due to its superior capacity for producing complex glycoproteins, antibodies, and other therapeutic proteins that require human-like post-translational modifications. The market for mammalian cell line development is valued in the billions of dollars.
Dominant Application:
- Recombinant Protein Expression: This application segment is the primary driver of the cell line development market, representing over 40% of the total market revenue. The demand for recombinant proteins as therapeutics, diagnostics, and research tools is immense.
- Key Growth Drivers: The expanding pipeline of biopharmaceuticals, the growing demand for biosimilars, and the increasing use of recombinant proteins in industrial enzymes and diagnostics.
- Detailed Analysis: The ability to produce therapeutic proteins like insulin, growth hormones, and enzymes with high purity and yield makes recombinant protein expression a cornerstone of the cell line development industry. The development of novel expression systems and optimization of media and feeding strategies are key to maximizing productivity in this segment.
- Recombinant Protein Expression: This application segment is the primary driver of the cell line development market, representing over 40% of the total market revenue. The demand for recombinant proteins as therapeutics, diagnostics, and research tools is immense.
Dominant End User:
- Biotech and Pharmaceutical Companies: This segment represents the largest end-user group, accounting for approximately 65% of the market share. These companies are the primary developers and manufacturers of biopharmaceuticals and therapeutic biologics.
- Key Growth Drivers: The robust pipeline of drug candidates in preclinical and clinical trials, the growing market for biologics, and the increasing trend of outsourcing manufacturing and development activities.
- Detailed Analysis: The constant need for innovative cell lines to produce novel therapeutic entities drives significant investment from biotech and pharma companies in cell line development services. Their focus on bringing new drugs to market fuels demand for efficient, scalable, and regulatory-compliant cell line creation.
- Biotech and Pharmaceutical Companies: This segment represents the largest end-user group, accounting for approximately 65% of the market share. These companies are the primary developers and manufacturers of biopharmaceuticals and therapeutic biologics.
Dominant Product:
- Reagent and Media: While equipment and finished cells are crucial, the reagents and media used in the cell line development process represent a substantial and consistently growing segment, valued in the billions of dollars.
- Key Growth Drivers: The development of specialized cell culture media designed for high-density perfusion cultures, the demand for chemically defined and animal-component-free media to meet regulatory requirements, and innovation in transfection reagents for efficient gene delivery.
- Detailed Analysis: The continuous innovation in cell culture media formulations, aimed at enhancing cell viability, growth rates, and productivity, is a key factor in this segment's growth. The development of specialized reagents for gene integration and selection processes also contributes significantly.
- Reagent and Media: While equipment and finished cells are crucial, the reagents and media used in the cell line development process represent a substantial and consistently growing segment, valued in the billions of dollars.
Cell Line Development Industry Product Analysis
The Cell Line Development Industry is characterized by a diverse product portfolio, with Reagent and Media emerging as a key segment. Innovations in chemically defined, serum-free media formulations are paramount, enabling higher cell densities and improved recombinant protein yields. Advanced transfection reagents and viral vectors are crucial for efficient gene integration and stable cell line generation. Furthermore, specialized Finished Cells, including master and working cell banks, are vital for downstream manufacturing. The development of high-throughput screening equipment and advanced bioinformatics tools further streamlines the selection and characterization of optimal cell lines, providing a competitive advantage through speed and precision.
Key Drivers, Barriers & Challenges in Cell Line Development Industry
The Cell Line Development Industry is propelled by several key drivers, including the escalating demand for biologics and advanced therapies, coupled with rapid technological advancements in gene editing and synthetic biology. The growing pipeline of biopharmaceutical drugs, particularly monoclonal antibodies and gene therapies, directly fuels the need for efficient cell line development. Economic factors, such as increasing healthcare spending and the lucrative nature of the biopharmaceutical market, also contribute significantly.
- Key Drivers:
- Increasing Demand for Biologics: Driven by chronic diseases and personalized medicine.
- Technological Advancements: CRISPR, synthetic biology, and high-throughput screening.
- Expanding Biopharmaceutical Pipeline: Novel therapies in development.
- Outsourcing Trends: Growing reliance on CDMOs.
However, the industry faces significant barriers and challenges. Stringent regulatory requirements from bodies like the FDA and EMA demand extensive validation and quality control, increasing development time and costs. Supply chain disruptions, particularly for specialized reagents and cell culture components, can impact production timelines. Intense competition among established players and emerging CDMOs also exerts pressure on pricing and innovation.
- Challenges and Restraints:
- Regulatory Hurdles: Strict compliance requirements and lengthy approval processes.
- Supply Chain Vulnerabilities: Dependence on specialized raw materials.
- High Development Costs: Significant investment in R&D and infrastructure.
- Intellectual Property Landscape: Navigating complex patent protections.
Growth Drivers in the Cell Line Development Industry Market
The Cell Line Development Industry is experiencing significant growth driven by several interconnected factors. Technologically, the widespread adoption of gene editing tools like CRISPR-Cas9, alongside advancements in synthetic biology and high-throughput screening, is accelerating the development of more efficient and productive cell lines. Economically, the burgeoning global demand for biologics, including monoclonal antibodies, gene therapies, and vaccines, coupled with increasing healthcare expenditure worldwide, is creating a robust market. Regulatory tailwinds, such as expedited approval pathways for novel therapies and an increasing acceptance of biosimilars, also contribute positively. The growing trend of outsourcing by biotech and pharmaceutical companies to specialized CDMOs further amplifies growth opportunities.
Challenges Impacting Cell Line Development Industry Growth
Despite its robust growth, the Cell Line Development Industry faces several challenges. Regulatory complexities remain a significant barrier, with stringent requirements for safety, efficacy, and manufacturing consistency demanding substantial investment in validation and compliance. Supply chain issues, particularly concerning the availability of critical raw materials and specialized reagents, can lead to production delays and increased costs. The competitive pressure from a growing number of CDMOs and technology providers can also impact pricing strategies and profit margins. Furthermore, the high cost of developing and optimizing cell lines, coupled with the inherent risks associated with biopharmaceutical development, presents a substantial financial hurdle for many companies.
Key Players Shaping the Cell Line Development Industry Market
- Promega Corporation
- Merck KGaA
- Sartorius AG
- Danaher Corporation
- Selexis SA
- Fujifilm Corporation (Fujifilm Diosynth Biotechnologies)
- American Type Culture Collection (ATCC)
- WuXi Biologics
- Thermo Fisher Scientific
- Corning Incorporated
Significant Cell Line Development Industry Industry Milestones
- July 2022: ProBioGen and Granite Bio collaborated to provide GMP manufacturing and cell line development services. Granite Bio's novel monoclonal antibody, developed using the DirectedLuck transposase, is a leading candidate for treating autoimmune diseases and specific cancer indications, showcasing advancements in antibody development and platform technologies.
- June 2022: FUJIFILM Corporation announced an investment of USD 1.6 billion to enhance and expand the cell culture manufacturing services of FUJIFILM Diosynth Biotechnologies. This significant investment underscores the growing demand for contract development and manufacturing services and the company's commitment to scaling up its capabilities to meet global needs.
Future Outlook for Cell Line Development Industry Market
The future outlook for the Cell Line Development Industry is exceptionally bright, driven by an ever-expanding pipeline of innovative biotherapeutics and the increasing global demand for biologics. Strategic opportunities lie in the development of cell lines for next-generation therapies, including gene therapies, cell therapies, and advanced antibody-drug conjugates (ADCs). The continued integration of AI and machine learning in cell line engineering promises to further optimize development timelines and improve productivity, making the process more efficient and cost-effective. The ongoing trend of outsourcing, coupled with significant investments in expanding manufacturing capacity by leading CDMOs, indicates sustained market growth and a robust future for this critical industry sector.
Cell Line Development Industry Segmentation
-
1. Product
- 1.1. Reagent and Media
- 1.2. Equipment
- 1.3. Finished Cells
- 1.4. Other Products
-
2. Source
- 2.1. Mammalian Cell Line
- 2.2. Non-mammalian Cell Line
-
3. Application
- 3.1. Recombinant Protein Expression
- 3.2. Hybridomas Technology
- 3.3. Vaccine Production
- 3.4. Drug Discovery
- 3.5. Other Applications
-
4. End User
- 4.1. Biotech and Pharmaceutical Companies
- 4.2. Academics and Research Institutes
- 4.3. Other End Users
Cell Line Development Industry Segmentation By Geography
-
1. North America
- 1.1. United States
- 1.2. Canada
- 1.3. Mexico
-
2. Europe
- 2.1. Germany
- 2.2. United Kingdom
- 2.3. France
- 2.4. Italy
- 2.5. Spain
- 2.6. Rest of Europe
-
3. Asia Pacific
- 3.1. China
- 3.2. Japan
- 3.3. India
- 3.4. Australia
- 3.5. South Korea
- 3.6. Rest of Asia Pacific
-
4. Middle East and Africa
- 4.1. GCC
- 4.2. South Africa
- 4.3. Rest of Middle East and Africa
-
5. South America
- 5.1. Brazil
- 5.2. Argentina
- 5.3. Rest of South America
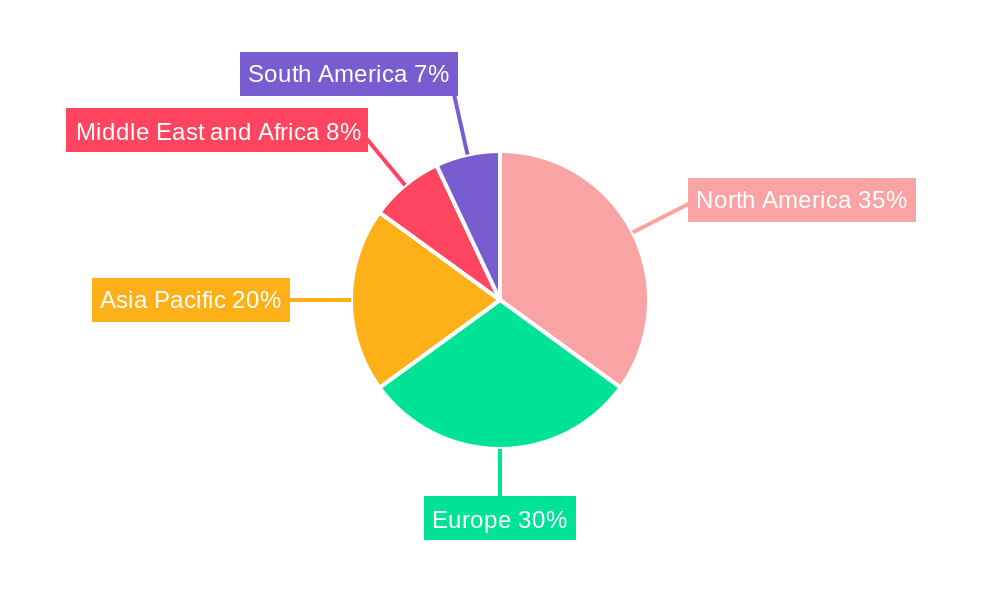
Cell Line Development Industry Regional Market Share
Geographic Coverage of Cell Line Development Industry
Cell Line Development Industry REPORT HIGHLIGHTS
| Aspects | Details |
|---|---|
| Study Period | 2020-2034 |
| Base Year | 2025 |
| Estimated Year | 2026 |
| Forecast Period | 2026-2034 |
| Historical Period | 2020-2025 |
| Growth Rate | CAGR of 6.4% from 2020-2034 |
| Segmentation |
|
Table of Contents
- 1. Introduction
- 1.1. Research Scope
- 1.2. Market Segmentation
- 1.3. Research Objective
- 1.4. Definitions and Assumptions
- 2. Executive Summary
- 2.1. Market Snapshot
- 3. Market Dynamics
- 3.1. Market Drivers
- 3.2. Market Restrains
- 3.3. Market Trends
- 3.4. Market Opportunities
- 4. Market Factor Analysis
- 4.1. Porters Five Forces
- 4.1.1. Bargaining Power of Suppliers
- 4.1.2. Bargaining Power of Buyers
- 4.1.3. Threat of New Entrants
- 4.1.4. Threat of Substitutes
- 4.1.5. Competitive Rivalry
- 4.2. PESTEL analysis
- 4.3. BCG Analysis
- 4.3.1. Stars (High Growth, High Market Share)
- 4.3.2. Cash Cows (Low Growth, High Market Share)
- 4.3.3. Question Mark (High Growth, Low Market Share)
- 4.3.4. Dogs (Low Growth, Low Market Share)
- 4.4. Ansoff Matrix Analysis
- 4.5. Supply Chain Analysis
- 4.6. Regulatory Landscape
- 4.7. Current Market Potential and Opportunity Assessment (TAM–SAM–SOM Framework)
- 4.8. TIR Analyst Note
- 4.1. Porters Five Forces
- 5. Market Analysis, Insights and Forecast 2021-2033
- 5.1. Market Analysis, Insights and Forecast - by Product
- 5.1.1. Reagent and Media
- 5.1.2. Equipment
- 5.1.3. Finished Cells
- 5.1.4. Other Products
- 5.2. Market Analysis, Insights and Forecast - by Source
- 5.2.1. Mammalian Cell Line
- 5.2.2. Non-mammalian Cell Line
- 5.3. Market Analysis, Insights and Forecast - by Application
- 5.3.1. Recombinant Protein Expression
- 5.3.2. Hybridomas Technology
- 5.3.3. Vaccine Production
- 5.3.4. Drug Discovery
- 5.3.5. Other Applications
- 5.4. Market Analysis, Insights and Forecast - by End User
- 5.4.1. Biotech and Pharmaceutical Companies
- 5.4.2. Academics and Research Institutes
- 5.4.3. Other End Users
- 5.5. Market Analysis, Insights and Forecast - by Region
- 5.5.1. North America
- 5.5.2. Europe
- 5.5.3. Asia Pacific
- 5.5.4. Middle East and Africa
- 5.5.5. South America
- 5.1. Market Analysis, Insights and Forecast - by Product
- 6. Global Cell Line Development Industry Analysis, Insights and Forecast, 2021-2033
- 6.1. Market Analysis, Insights and Forecast - by Product
- 6.1.1. Reagent and Media
- 6.1.2. Equipment
- 6.1.3. Finished Cells
- 6.1.4. Other Products
- 6.2. Market Analysis, Insights and Forecast - by Source
- 6.2.1. Mammalian Cell Line
- 6.2.2. Non-mammalian Cell Line
- 6.3. Market Analysis, Insights and Forecast - by Application
- 6.3.1. Recombinant Protein Expression
- 6.3.2. Hybridomas Technology
- 6.3.3. Vaccine Production
- 6.3.4. Drug Discovery
- 6.3.5. Other Applications
- 6.4. Market Analysis, Insights and Forecast - by End User
- 6.4.1. Biotech and Pharmaceutical Companies
- 6.4.2. Academics and Research Institutes
- 6.4.3. Other End Users
- 6.1. Market Analysis, Insights and Forecast - by Product
- 7. North America Cell Line Development Industry Analysis, Insights and Forecast, 2020-2032
- 7.1. Market Analysis, Insights and Forecast - by Product
- 7.1.1. Reagent and Media
- 7.1.2. Equipment
- 7.1.3. Finished Cells
- 7.1.4. Other Products
- 7.2. Market Analysis, Insights and Forecast - by Source
- 7.2.1. Mammalian Cell Line
- 7.2.2. Non-mammalian Cell Line
- 7.3. Market Analysis, Insights and Forecast - by Application
- 7.3.1. Recombinant Protein Expression
- 7.3.2. Hybridomas Technology
- 7.3.3. Vaccine Production
- 7.3.4. Drug Discovery
- 7.3.5. Other Applications
- 7.4. Market Analysis, Insights and Forecast - by End User
- 7.4.1. Biotech and Pharmaceutical Companies
- 7.4.2. Academics and Research Institutes
- 7.4.3. Other End Users
- 7.1. Market Analysis, Insights and Forecast - by Product
- 8. Europe Cell Line Development Industry Analysis, Insights and Forecast, 2020-2032
- 8.1. Market Analysis, Insights and Forecast - by Product
- 8.1.1. Reagent and Media
- 8.1.2. Equipment
- 8.1.3. Finished Cells
- 8.1.4. Other Products
- 8.2. Market Analysis, Insights and Forecast - by Source
- 8.2.1. Mammalian Cell Line
- 8.2.2. Non-mammalian Cell Line
- 8.3. Market Analysis, Insights and Forecast - by Application
- 8.3.1. Recombinant Protein Expression
- 8.3.2. Hybridomas Technology
- 8.3.3. Vaccine Production
- 8.3.4. Drug Discovery
- 8.3.5. Other Applications
- 8.4. Market Analysis, Insights and Forecast - by End User
- 8.4.1. Biotech and Pharmaceutical Companies
- 8.4.2. Academics and Research Institutes
- 8.4.3. Other End Users
- 8.1. Market Analysis, Insights and Forecast - by Product
- 9. Asia Pacific Cell Line Development Industry Analysis, Insights and Forecast, 2020-2032
- 9.1. Market Analysis, Insights and Forecast - by Product
- 9.1.1. Reagent and Media
- 9.1.2. Equipment
- 9.1.3. Finished Cells
- 9.1.4. Other Products
- 9.2. Market Analysis, Insights and Forecast - by Source
- 9.2.1. Mammalian Cell Line
- 9.2.2. Non-mammalian Cell Line
- 9.3. Market Analysis, Insights and Forecast - by Application
- 9.3.1. Recombinant Protein Expression
- 9.3.2. Hybridomas Technology
- 9.3.3. Vaccine Production
- 9.3.4. Drug Discovery
- 9.3.5. Other Applications
- 9.4. Market Analysis, Insights and Forecast - by End User
- 9.4.1. Biotech and Pharmaceutical Companies
- 9.4.2. Academics and Research Institutes
- 9.4.3. Other End Users
- 9.1. Market Analysis, Insights and Forecast - by Product
- 10. Middle East and Africa Cell Line Development Industry Analysis, Insights and Forecast, 2020-2032
- 10.1. Market Analysis, Insights and Forecast - by Product
- 10.1.1. Reagent and Media
- 10.1.2. Equipment
- 10.1.3. Finished Cells
- 10.1.4. Other Products
- 10.2. Market Analysis, Insights and Forecast - by Source
- 10.2.1. Mammalian Cell Line
- 10.2.2. Non-mammalian Cell Line
- 10.3. Market Analysis, Insights and Forecast - by Application
- 10.3.1. Recombinant Protein Expression
- 10.3.2. Hybridomas Technology
- 10.3.3. Vaccine Production
- 10.3.4. Drug Discovery
- 10.3.5. Other Applications
- 10.4. Market Analysis, Insights and Forecast - by End User
- 10.4.1. Biotech and Pharmaceutical Companies
- 10.4.2. Academics and Research Institutes
- 10.4.3. Other End Users
- 10.1. Market Analysis, Insights and Forecast - by Product
- 11. South America Cell Line Development Industry Analysis, Insights and Forecast, 2020-2032
- 11.1. Market Analysis, Insights and Forecast - by Product
- 11.1.1. Reagent and Media
- 11.1.2. Equipment
- 11.1.3. Finished Cells
- 11.1.4. Other Products
- 11.2. Market Analysis, Insights and Forecast - by Source
- 11.2.1. Mammalian Cell Line
- 11.2.2. Non-mammalian Cell Line
- 11.3. Market Analysis, Insights and Forecast - by Application
- 11.3.1. Recombinant Protein Expression
- 11.3.2. Hybridomas Technology
- 11.3.3. Vaccine Production
- 11.3.4. Drug Discovery
- 11.3.5. Other Applications
- 11.4. Market Analysis, Insights and Forecast - by End User
- 11.4.1. Biotech and Pharmaceutical Companies
- 11.4.2. Academics and Research Institutes
- 11.4.3. Other End Users
- 11.1. Market Analysis, Insights and Forecast - by Product
- 12. Competitive Analysis
- 12.1. Company Profiles
- 12.1.1 Promega Corporation
- 12.1.1.1. Company Overview
- 12.1.1.2. Products
- 12.1.1.3. Company Financials
- 12.1.1.4. SWOT Analysis
- 12.1.2 Merck KGaA
- 12.1.2.1. Company Overview
- 12.1.2.2. Products
- 12.1.2.3. Company Financials
- 12.1.2.4. SWOT Analysis
- 12.1.3 Sartorius AG
- 12.1.3.1. Company Overview
- 12.1.3.2. Products
- 12.1.3.3. Company Financials
- 12.1.3.4. SWOT Analysis
- 12.1.4 Danaher Corporation
- 12.1.4.1. Company Overview
- 12.1.4.2. Products
- 12.1.4.3. Company Financials
- 12.1.4.4. SWOT Analysis
- 12.1.5 Selexis SA
- 12.1.5.1. Company Overview
- 12.1.5.2. Products
- 12.1.5.3. Company Financials
- 12.1.5.4. SWOT Analysis
- 12.1.6 Fujifilm Corporation (Fujifilm Diosynth Biotechnologies)
- 12.1.6.1. Company Overview
- 12.1.6.2. Products
- 12.1.6.3. Company Financials
- 12.1.6.4. SWOT Analysis
- 12.1.7 American Type Culture Collection (ATCC)
- 12.1.7.1. Company Overview
- 12.1.7.2. Products
- 12.1.7.3. Company Financials
- 12.1.7.4. SWOT Analysis
- 12.1.8 WuXi Biologics
- 12.1.8.1. Company Overview
- 12.1.8.2. Products
- 12.1.8.3. Company Financials
- 12.1.8.4. SWOT Analysis
- 12.1.9 Thermo Fisher Scientific
- 12.1.9.1. Company Overview
- 12.1.9.2. Products
- 12.1.9.3. Company Financials
- 12.1.9.4. SWOT Analysis
- 12.1.10 Corning Incorporated
- 12.1.10.1. Company Overview
- 12.1.10.2. Products
- 12.1.10.3. Company Financials
- 12.1.10.4. SWOT Analysis
- 12.1.1 Promega Corporation
- 12.2. Market Entropy
- 12.2.1 Company's Key Areas Served
- 12.2.2 Recent Developments
- 12.3. Company Market Share Analysis 2025
- 12.3.1 Top 5 Companies Market Share Analysis
- 12.3.2 Top 3 Companies Market Share Analysis
- 12.4. List of Potential Customers
- 13. Research Methodology
List of Figures
- Figure 1: Global Cell Line Development Industry Revenue Breakdown (billion, %) by Region 2025 & 2033
- Figure 2: Global Cell Line Development Industry Volume Breakdown (K Unit, %) by Region 2025 & 2033
- Figure 3: North America Cell Line Development Industry Revenue (billion), by Product 2025 & 2033
- Figure 4: North America Cell Line Development Industry Volume (K Unit), by Product 2025 & 2033
- Figure 5: North America Cell Line Development Industry Revenue Share (%), by Product 2025 & 2033
- Figure 6: North America Cell Line Development Industry Volume Share (%), by Product 2025 & 2033
- Figure 7: North America Cell Line Development Industry Revenue (billion), by Source 2025 & 2033
- Figure 8: North America Cell Line Development Industry Volume (K Unit), by Source 2025 & 2033
- Figure 9: North America Cell Line Development Industry Revenue Share (%), by Source 2025 & 2033
- Figure 10: North America Cell Line Development Industry Volume Share (%), by Source 2025 & 2033
- Figure 11: North America Cell Line Development Industry Revenue (billion), by Application 2025 & 2033
- Figure 12: North America Cell Line Development Industry Volume (K Unit), by Application 2025 & 2033
- Figure 13: North America Cell Line Development Industry Revenue Share (%), by Application 2025 & 2033
- Figure 14: North America Cell Line Development Industry Volume Share (%), by Application 2025 & 2033
- Figure 15: North America Cell Line Development Industry Revenue (billion), by End User 2025 & 2033
- Figure 16: North America Cell Line Development Industry Volume (K Unit), by End User 2025 & 2033
- Figure 17: North America Cell Line Development Industry Revenue Share (%), by End User 2025 & 2033
- Figure 18: North America Cell Line Development Industry Volume Share (%), by End User 2025 & 2033
- Figure 19: North America Cell Line Development Industry Revenue (billion), by Country 2025 & 2033
- Figure 20: North America Cell Line Development Industry Volume (K Unit), by Country 2025 & 2033
- Figure 21: North America Cell Line Development Industry Revenue Share (%), by Country 2025 & 2033
- Figure 22: North America Cell Line Development Industry Volume Share (%), by Country 2025 & 2033
- Figure 23: Europe Cell Line Development Industry Revenue (billion), by Product 2025 & 2033
- Figure 24: Europe Cell Line Development Industry Volume (K Unit), by Product 2025 & 2033
- Figure 25: Europe Cell Line Development Industry Revenue Share (%), by Product 2025 & 2033
- Figure 26: Europe Cell Line Development Industry Volume Share (%), by Product 2025 & 2033
- Figure 27: Europe Cell Line Development Industry Revenue (billion), by Source 2025 & 2033
- Figure 28: Europe Cell Line Development Industry Volume (K Unit), by Source 2025 & 2033
- Figure 29: Europe Cell Line Development Industry Revenue Share (%), by Source 2025 & 2033
- Figure 30: Europe Cell Line Development Industry Volume Share (%), by Source 2025 & 2033
- Figure 31: Europe Cell Line Development Industry Revenue (billion), by Application 2025 & 2033
- Figure 32: Europe Cell Line Development Industry Volume (K Unit), by Application 2025 & 2033
- Figure 33: Europe Cell Line Development Industry Revenue Share (%), by Application 2025 & 2033
- Figure 34: Europe Cell Line Development Industry Volume Share (%), by Application 2025 & 2033
- Figure 35: Europe Cell Line Development Industry Revenue (billion), by End User 2025 & 2033
- Figure 36: Europe Cell Line Development Industry Volume (K Unit), by End User 2025 & 2033
- Figure 37: Europe Cell Line Development Industry Revenue Share (%), by End User 2025 & 2033
- Figure 38: Europe Cell Line Development Industry Volume Share (%), by End User 2025 & 2033
- Figure 39: Europe Cell Line Development Industry Revenue (billion), by Country 2025 & 2033
- Figure 40: Europe Cell Line Development Industry Volume (K Unit), by Country 2025 & 2033
- Figure 41: Europe Cell Line Development Industry Revenue Share (%), by Country 2025 & 2033
- Figure 42: Europe Cell Line Development Industry Volume Share (%), by Country 2025 & 2033
- Figure 43: Asia Pacific Cell Line Development Industry Revenue (billion), by Product 2025 & 2033
- Figure 44: Asia Pacific Cell Line Development Industry Volume (K Unit), by Product 2025 & 2033
- Figure 45: Asia Pacific Cell Line Development Industry Revenue Share (%), by Product 2025 & 2033
- Figure 46: Asia Pacific Cell Line Development Industry Volume Share (%), by Product 2025 & 2033
- Figure 47: Asia Pacific Cell Line Development Industry Revenue (billion), by Source 2025 & 2033
- Figure 48: Asia Pacific Cell Line Development Industry Volume (K Unit), by Source 2025 & 2033
- Figure 49: Asia Pacific Cell Line Development Industry Revenue Share (%), by Source 2025 & 2033
- Figure 50: Asia Pacific Cell Line Development Industry Volume Share (%), by Source 2025 & 2033
- Figure 51: Asia Pacific Cell Line Development Industry Revenue (billion), by Application 2025 & 2033
- Figure 52: Asia Pacific Cell Line Development Industry Volume (K Unit), by Application 2025 & 2033
- Figure 53: Asia Pacific Cell Line Development Industry Revenue Share (%), by Application 2025 & 2033
- Figure 54: Asia Pacific Cell Line Development Industry Volume Share (%), by Application 2025 & 2033
- Figure 55: Asia Pacific Cell Line Development Industry Revenue (billion), by End User 2025 & 2033
- Figure 56: Asia Pacific Cell Line Development Industry Volume (K Unit), by End User 2025 & 2033
- Figure 57: Asia Pacific Cell Line Development Industry Revenue Share (%), by End User 2025 & 2033
- Figure 58: Asia Pacific Cell Line Development Industry Volume Share (%), by End User 2025 & 2033
- Figure 59: Asia Pacific Cell Line Development Industry Revenue (billion), by Country 2025 & 2033
- Figure 60: Asia Pacific Cell Line Development Industry Volume (K Unit), by Country 2025 & 2033
- Figure 61: Asia Pacific Cell Line Development Industry Revenue Share (%), by Country 2025 & 2033
- Figure 62: Asia Pacific Cell Line Development Industry Volume Share (%), by Country 2025 & 2033
- Figure 63: Middle East and Africa Cell Line Development Industry Revenue (billion), by Product 2025 & 2033
- Figure 64: Middle East and Africa Cell Line Development Industry Volume (K Unit), by Product 2025 & 2033
- Figure 65: Middle East and Africa Cell Line Development Industry Revenue Share (%), by Product 2025 & 2033
- Figure 66: Middle East and Africa Cell Line Development Industry Volume Share (%), by Product 2025 & 2033
- Figure 67: Middle East and Africa Cell Line Development Industry Revenue (billion), by Source 2025 & 2033
- Figure 68: Middle East and Africa Cell Line Development Industry Volume (K Unit), by Source 2025 & 2033
- Figure 69: Middle East and Africa Cell Line Development Industry Revenue Share (%), by Source 2025 & 2033
- Figure 70: Middle East and Africa Cell Line Development Industry Volume Share (%), by Source 2025 & 2033
- Figure 71: Middle East and Africa Cell Line Development Industry Revenue (billion), by Application 2025 & 2033
- Figure 72: Middle East and Africa Cell Line Development Industry Volume (K Unit), by Application 2025 & 2033
- Figure 73: Middle East and Africa Cell Line Development Industry Revenue Share (%), by Application 2025 & 2033
- Figure 74: Middle East and Africa Cell Line Development Industry Volume Share (%), by Application 2025 & 2033
- Figure 75: Middle East and Africa Cell Line Development Industry Revenue (billion), by End User 2025 & 2033
- Figure 76: Middle East and Africa Cell Line Development Industry Volume (K Unit), by End User 2025 & 2033
- Figure 77: Middle East and Africa Cell Line Development Industry Revenue Share (%), by End User 2025 & 2033
- Figure 78: Middle East and Africa Cell Line Development Industry Volume Share (%), by End User 2025 & 2033
- Figure 79: Middle East and Africa Cell Line Development Industry Revenue (billion), by Country 2025 & 2033
- Figure 80: Middle East and Africa Cell Line Development Industry Volume (K Unit), by Country 2025 & 2033
- Figure 81: Middle East and Africa Cell Line Development Industry Revenue Share (%), by Country 2025 & 2033
- Figure 82: Middle East and Africa Cell Line Development Industry Volume Share (%), by Country 2025 & 2033
- Figure 83: South America Cell Line Development Industry Revenue (billion), by Product 2025 & 2033
- Figure 84: South America Cell Line Development Industry Volume (K Unit), by Product 2025 & 2033
- Figure 85: South America Cell Line Development Industry Revenue Share (%), by Product 2025 & 2033
- Figure 86: South America Cell Line Development Industry Volume Share (%), by Product 2025 & 2033
- Figure 87: South America Cell Line Development Industry Revenue (billion), by Source 2025 & 2033
- Figure 88: South America Cell Line Development Industry Volume (K Unit), by Source 2025 & 2033
- Figure 89: South America Cell Line Development Industry Revenue Share (%), by Source 2025 & 2033
- Figure 90: South America Cell Line Development Industry Volume Share (%), by Source 2025 & 2033
- Figure 91: South America Cell Line Development Industry Revenue (billion), by Application 2025 & 2033
- Figure 92: South America Cell Line Development Industry Volume (K Unit), by Application 2025 & 2033
- Figure 93: South America Cell Line Development Industry Revenue Share (%), by Application 2025 & 2033
- Figure 94: South America Cell Line Development Industry Volume Share (%), by Application 2025 & 2033
- Figure 95: South America Cell Line Development Industry Revenue (billion), by End User 2025 & 2033
- Figure 96: South America Cell Line Development Industry Volume (K Unit), by End User 2025 & 2033
- Figure 97: South America Cell Line Development Industry Revenue Share (%), by End User 2025 & 2033
- Figure 98: South America Cell Line Development Industry Volume Share (%), by End User 2025 & 2033
- Figure 99: South America Cell Line Development Industry Revenue (billion), by Country 2025 & 2033
- Figure 100: South America Cell Line Development Industry Volume (K Unit), by Country 2025 & 2033
- Figure 101: South America Cell Line Development Industry Revenue Share (%), by Country 2025 & 2033
- Figure 102: South America Cell Line Development Industry Volume Share (%), by Country 2025 & 2033
List of Tables
- Table 1: Global Cell Line Development Industry Revenue billion Forecast, by Product 2020 & 2033
- Table 2: Global Cell Line Development Industry Volume K Unit Forecast, by Product 2020 & 2033
- Table 3: Global Cell Line Development Industry Revenue billion Forecast, by Source 2020 & 2033
- Table 4: Global Cell Line Development Industry Volume K Unit Forecast, by Source 2020 & 2033
- Table 5: Global Cell Line Development Industry Revenue billion Forecast, by Application 2020 & 2033
- Table 6: Global Cell Line Development Industry Volume K Unit Forecast, by Application 2020 & 2033
- Table 7: Global Cell Line Development Industry Revenue billion Forecast, by End User 2020 & 2033
- Table 8: Global Cell Line Development Industry Volume K Unit Forecast, by End User 2020 & 2033
- Table 9: Global Cell Line Development Industry Revenue billion Forecast, by Region 2020 & 2033
- Table 10: Global Cell Line Development Industry Volume K Unit Forecast, by Region 2020 & 2033
- Table 11: Global Cell Line Development Industry Revenue billion Forecast, by Product 2020 & 2033
- Table 12: Global Cell Line Development Industry Volume K Unit Forecast, by Product 2020 & 2033
- Table 13: Global Cell Line Development Industry Revenue billion Forecast, by Source 2020 & 2033
- Table 14: Global Cell Line Development Industry Volume K Unit Forecast, by Source 2020 & 2033
- Table 15: Global Cell Line Development Industry Revenue billion Forecast, by Application 2020 & 2033
- Table 16: Global Cell Line Development Industry Volume K Unit Forecast, by Application 2020 & 2033
- Table 17: Global Cell Line Development Industry Revenue billion Forecast, by End User 2020 & 2033
- Table 18: Global Cell Line Development Industry Volume K Unit Forecast, by End User 2020 & 2033
- Table 19: Global Cell Line Development Industry Revenue billion Forecast, by Country 2020 & 2033
- Table 20: Global Cell Line Development Industry Volume K Unit Forecast, by Country 2020 & 2033
- Table 21: United States Cell Line Development Industry Revenue (billion) Forecast, by Application 2020 & 2033
- Table 22: United States Cell Line Development Industry Volume (K Unit) Forecast, by Application 2020 & 2033
- Table 23: Canada Cell Line Development Industry Revenue (billion) Forecast, by Application 2020 & 2033
- Table 24: Canada Cell Line Development Industry Volume (K Unit) Forecast, by Application 2020 & 2033
- Table 25: Mexico Cell Line Development Industry Revenue (billion) Forecast, by Application 2020 & 2033
- Table 26: Mexico Cell Line Development Industry Volume (K Unit) Forecast, by Application 2020 & 2033
- Table 27: Global Cell Line Development Industry Revenue billion Forecast, by Product 2020 & 2033
- Table 28: Global Cell Line Development Industry Volume K Unit Forecast, by Product 2020 & 2033
- Table 29: Global Cell Line Development Industry Revenue billion Forecast, by Source 2020 & 2033
- Table 30: Global Cell Line Development Industry Volume K Unit Forecast, by Source 2020 & 2033
- Table 31: Global Cell Line Development Industry Revenue billion Forecast, by Application 2020 & 2033
- Table 32: Global Cell Line Development Industry Volume K Unit Forecast, by Application 2020 & 2033
- Table 33: Global Cell Line Development Industry Revenue billion Forecast, by End User 2020 & 2033
- Table 34: Global Cell Line Development Industry Volume K Unit Forecast, by End User 2020 & 2033
- Table 35: Global Cell Line Development Industry Revenue billion Forecast, by Country 2020 & 2033
- Table 36: Global Cell Line Development Industry Volume K Unit Forecast, by Country 2020 & 2033
- Table 37: Germany Cell Line Development Industry Revenue (billion) Forecast, by Application 2020 & 2033
- Table 38: Germany Cell Line Development Industry Volume (K Unit) Forecast, by Application 2020 & 2033
- Table 39: United Kingdom Cell Line Development Industry Revenue (billion) Forecast, by Application 2020 & 2033
- Table 40: United Kingdom Cell Line Development Industry Volume (K Unit) Forecast, by Application 2020 & 2033
- Table 41: France Cell Line Development Industry Revenue (billion) Forecast, by Application 2020 & 2033
- Table 42: France Cell Line Development Industry Volume (K Unit) Forecast, by Application 2020 & 2033
- Table 43: Italy Cell Line Development Industry Revenue (billion) Forecast, by Application 2020 & 2033
- Table 44: Italy Cell Line Development Industry Volume (K Unit) Forecast, by Application 2020 & 2033
- Table 45: Spain Cell Line Development Industry Revenue (billion) Forecast, by Application 2020 & 2033
- Table 46: Spain Cell Line Development Industry Volume (K Unit) Forecast, by Application 2020 & 2033
- Table 47: Rest of Europe Cell Line Development Industry Revenue (billion) Forecast, by Application 2020 & 2033
- Table 48: Rest of Europe Cell Line Development Industry Volume (K Unit) Forecast, by Application 2020 & 2033
- Table 49: Global Cell Line Development Industry Revenue billion Forecast, by Product 2020 & 2033
- Table 50: Global Cell Line Development Industry Volume K Unit Forecast, by Product 2020 & 2033
- Table 51: Global Cell Line Development Industry Revenue billion Forecast, by Source 2020 & 2033
- Table 52: Global Cell Line Development Industry Volume K Unit Forecast, by Source 2020 & 2033
- Table 53: Global Cell Line Development Industry Revenue billion Forecast, by Application 2020 & 2033
- Table 54: Global Cell Line Development Industry Volume K Unit Forecast, by Application 2020 & 2033
- Table 55: Global Cell Line Development Industry Revenue billion Forecast, by End User 2020 & 2033
- Table 56: Global Cell Line Development Industry Volume K Unit Forecast, by End User 2020 & 2033
- Table 57: Global Cell Line Development Industry Revenue billion Forecast, by Country 2020 & 2033
- Table 58: Global Cell Line Development Industry Volume K Unit Forecast, by Country 2020 & 2033
- Table 59: China Cell Line Development Industry Revenue (billion) Forecast, by Application 2020 & 2033
- Table 60: China Cell Line Development Industry Volume (K Unit) Forecast, by Application 2020 & 2033
- Table 61: Japan Cell Line Development Industry Revenue (billion) Forecast, by Application 2020 & 2033
- Table 62: Japan Cell Line Development Industry Volume (K Unit) Forecast, by Application 2020 & 2033
- Table 63: India Cell Line Development Industry Revenue (billion) Forecast, by Application 2020 & 2033
- Table 64: India Cell Line Development Industry Volume (K Unit) Forecast, by Application 2020 & 2033
- Table 65: Australia Cell Line Development Industry Revenue (billion) Forecast, by Application 2020 & 2033
- Table 66: Australia Cell Line Development Industry Volume (K Unit) Forecast, by Application 2020 & 2033
- Table 67: South Korea Cell Line Development Industry Revenue (billion) Forecast, by Application 2020 & 2033
- Table 68: South Korea Cell Line Development Industry Volume (K Unit) Forecast, by Application 2020 & 2033
- Table 69: Rest of Asia Pacific Cell Line Development Industry Revenue (billion) Forecast, by Application 2020 & 2033
- Table 70: Rest of Asia Pacific Cell Line Development Industry Volume (K Unit) Forecast, by Application 2020 & 2033
- Table 71: Global Cell Line Development Industry Revenue billion Forecast, by Product 2020 & 2033
- Table 72: Global Cell Line Development Industry Volume K Unit Forecast, by Product 2020 & 2033
- Table 73: Global Cell Line Development Industry Revenue billion Forecast, by Source 2020 & 2033
- Table 74: Global Cell Line Development Industry Volume K Unit Forecast, by Source 2020 & 2033
- Table 75: Global Cell Line Development Industry Revenue billion Forecast, by Application 2020 & 2033
- Table 76: Global Cell Line Development Industry Volume K Unit Forecast, by Application 2020 & 2033
- Table 77: Global Cell Line Development Industry Revenue billion Forecast, by End User 2020 & 2033
- Table 78: Global Cell Line Development Industry Volume K Unit Forecast, by End User 2020 & 2033
- Table 79: Global Cell Line Development Industry Revenue billion Forecast, by Country 2020 & 2033
- Table 80: Global Cell Line Development Industry Volume K Unit Forecast, by Country 2020 & 2033
- Table 81: GCC Cell Line Development Industry Revenue (billion) Forecast, by Application 2020 & 2033
- Table 82: GCC Cell Line Development Industry Volume (K Unit) Forecast, by Application 2020 & 2033
- Table 83: South Africa Cell Line Development Industry Revenue (billion) Forecast, by Application 2020 & 2033
- Table 84: South Africa Cell Line Development Industry Volume (K Unit) Forecast, by Application 2020 & 2033
- Table 85: Rest of Middle East and Africa Cell Line Development Industry Revenue (billion) Forecast, by Application 2020 & 2033
- Table 86: Rest of Middle East and Africa Cell Line Development Industry Volume (K Unit) Forecast, by Application 2020 & 2033
- Table 87: Global Cell Line Development Industry Revenue billion Forecast, by Product 2020 & 2033
- Table 88: Global Cell Line Development Industry Volume K Unit Forecast, by Product 2020 & 2033
- Table 89: Global Cell Line Development Industry Revenue billion Forecast, by Source 2020 & 2033
- Table 90: Global Cell Line Development Industry Volume K Unit Forecast, by Source 2020 & 2033
- Table 91: Global Cell Line Development Industry Revenue billion Forecast, by Application 2020 & 2033
- Table 92: Global Cell Line Development Industry Volume K Unit Forecast, by Application 2020 & 2033
- Table 93: Global Cell Line Development Industry Revenue billion Forecast, by End User 2020 & 2033
- Table 94: Global Cell Line Development Industry Volume K Unit Forecast, by End User 2020 & 2033
- Table 95: Global Cell Line Development Industry Revenue billion Forecast, by Country 2020 & 2033
- Table 96: Global Cell Line Development Industry Volume K Unit Forecast, by Country 2020 & 2033
- Table 97: Brazil Cell Line Development Industry Revenue (billion) Forecast, by Application 2020 & 2033
- Table 98: Brazil Cell Line Development Industry Volume (K Unit) Forecast, by Application 2020 & 2033
- Table 99: Argentina Cell Line Development Industry Revenue (billion) Forecast, by Application 2020 & 2033
- Table 100: Argentina Cell Line Development Industry Volume (K Unit) Forecast, by Application 2020 & 2033
- Table 101: Rest of South America Cell Line Development Industry Revenue (billion) Forecast, by Application 2020 & 2033
- Table 102: Rest of South America Cell Line Development Industry Volume (K Unit) Forecast, by Application 2020 & 2033
Frequently Asked Questions
1. What is the projected Compound Annual Growth Rate (CAGR) of the Cell Line Development Industry?
The projected CAGR is approximately 6.4%.
2. Which companies are prominent players in the Cell Line Development Industry?
Key companies in the market include Promega Corporation, Merck KGaA, Sartorius AG, Danaher Corporation, Selexis SA, Fujifilm Corporation (Fujifilm Diosynth Biotechnologies), American Type Culture Collection (ATCC), WuXi Biologics, Thermo Fisher Scientific, Corning Incorporated.
3. What are the main segments of the Cell Line Development Industry?
The market segments include Product, Source, Application, End User.
4. Can you provide details about the market size?
The market size is estimated to be USD 4.2 billion as of 2022.
5. What are some drivers contributing to market growth?
Growing Biopharmaceutical Industry; Rising Demand for Monoclonal Antibodies and Cancer Therapeutics; Growing Production of Biosimilars Due to the Patent Expiry of Branded Therapeutics.
6. What are the notable trends driving market growth?
Mammalian Cell Line Development is Expected to Register Rapid Growth Over the Forecast Period.
7. Are there any restraints impacting market growth?
Strict Regulations; Time Taking Process.
8. Can you provide examples of recent developments in the market?
In July 2022, ProBioGen and Granite Bio Collaborate to Provide GMP Manufacturing and Cell Line Development Services. A novel monoclonal antibody developed by Granite Bio is the company's top contender for the treatment of autoimmune and specific cancer indications. By using the DirectedLuck transposase.
9. What pricing options are available for accessing the report?
Pricing options include single-user, multi-user, and enterprise licenses priced at USD 4750, USD 5250, and USD 8750 respectively.
10. Is the market size provided in terms of value or volume?
The market size is provided in terms of value, measured in billion and volume, measured in K Unit.
11. Are there any specific market keywords associated with the report?
Yes, the market keyword associated with the report is "Cell Line Development Industry," which aids in identifying and referencing the specific market segment covered.
12. How do I determine which pricing option suits my needs best?
The pricing options vary based on user requirements and access needs. Individual users may opt for single-user licenses, while businesses requiring broader access may choose multi-user or enterprise licenses for cost-effective access to the report.
13. Are there any additional resources or data provided in the Cell Line Development Industry report?
While the report offers comprehensive insights, it's advisable to review the specific contents or supplementary materials provided to ascertain if additional resources or data are available.
14. How can I stay updated on further developments or reports in the Cell Line Development Industry?
To stay informed about further developments, trends, and reports in the Cell Line Development Industry, consider subscribing to industry newsletters, following relevant companies and organizations, or regularly checking reputable industry news sources and publications.
Methodology
Step 1 - Identification of Relevant Samples Size from Population Database


Step 2 - Approaches for Defining Global Market Size (Value, Volume* & Price*)

Note*: In applicable scenarios
Step 3 - Data Sources
Primary Research
- Web Analytics
- Survey Reports
- Research Institute
- Latest Research Reports
- Opinion Leaders
Secondary Research
- Annual Reports
- White Paper
- Latest Press Release
- Industry Association
- Paid Database
- Investor Presentations

Step 4 - Data Triangulation
Involves using different sources of information in order to increase the validity of a study
These sources are likely to be stakeholders in a program - participants, other researchers, program staff, other community members, and so on.
Then we put all data in single framework & apply various statistical tools to find out the dynamic on the market.
During the analysis stage, feedback from the stakeholder groups would be compared to determine areas of agreement as well as areas of divergence