

Key Insights
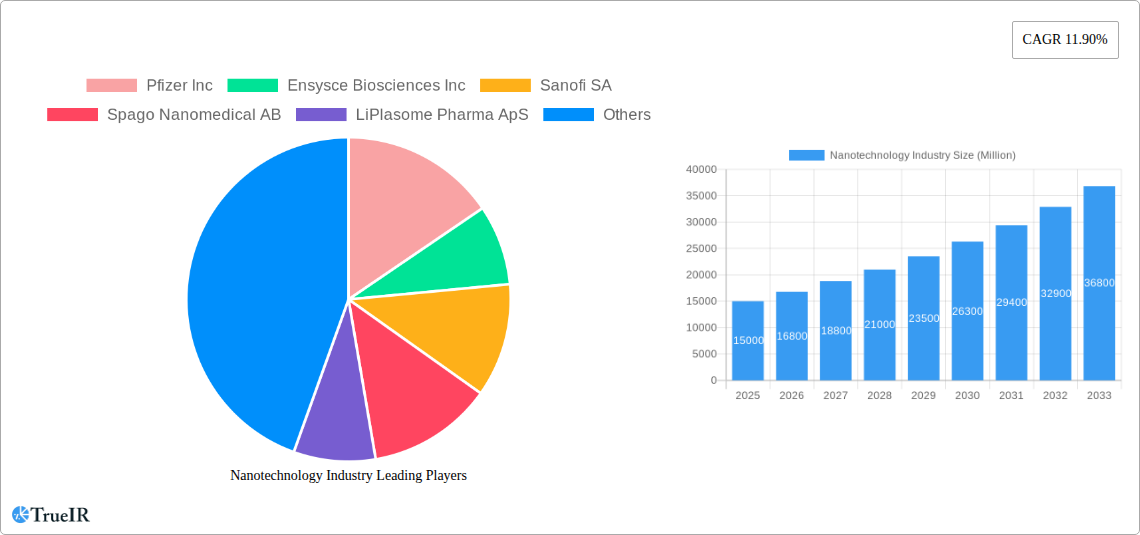
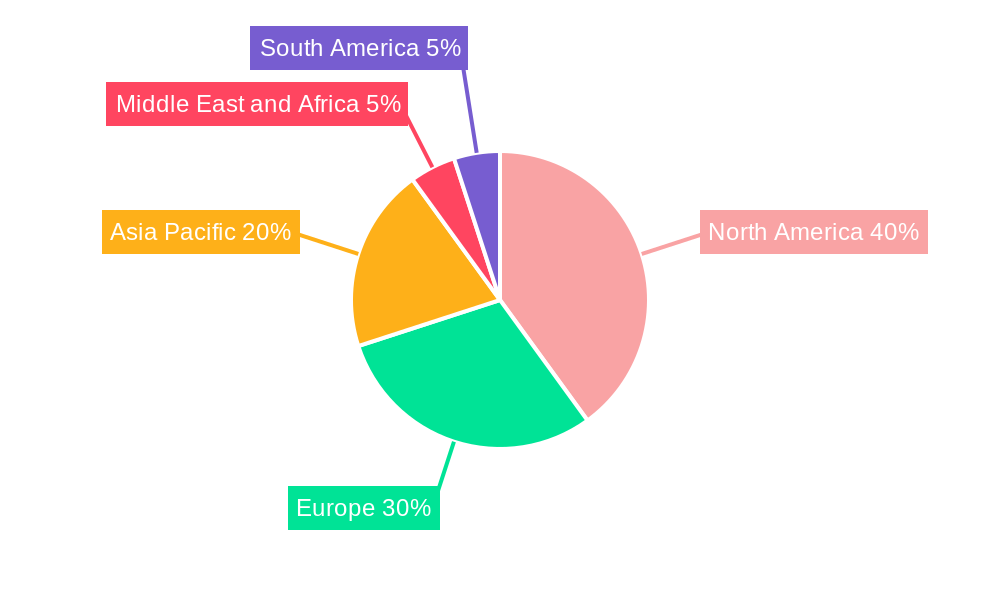
The nanotechnology industry is experiencing robust growth, projected to reach a substantial market size driven by its diverse applications across various sectors. The 11.90% CAGR from 2019-2033 indicates a significant expansion, fueled by advancements in drug delivery systems, biomaterials, and medical imaging. The rising prevalence of chronic diseases like cardiovascular diseases, oncological diseases, and neurological disorders is a major catalyst for growth, as nanotechnology offers targeted therapies and improved diagnostic tools. Specifically, the drug delivery segment is anticipated to lead the market due to its potential to enhance therapeutic efficacy and reduce side effects. Biomaterials applications, particularly in tissue regeneration and active implants, are also experiencing rapid expansion. Geographic segmentation shows North America currently holding a significant market share, followed by Europe and the Asia-Pacific region. However, rapidly growing economies in Asia-Pacific, fueled by increasing healthcare spending and technological advancements, are expected to drive substantial market growth in this region over the forecast period. While regulatory hurdles and potential safety concerns represent challenges, ongoing research and development efforts are continuously addressing these issues, paving the way for wider adoption and market penetration. Leading players like Pfizer, Sanofi, and Johnson & Johnson are actively investing in nanotechnology research and development, further contributing to the industry's expansion and innovation.
The competitive landscape is characterized by a mix of large pharmaceutical companies and specialized nanotechnology firms, fostering both innovation and strategic collaborations. The forecast period (2025-2033) promises continued growth, with the industry expected to witness further diversification in applications and geographical expansion. Technological advancements in areas such as targeted drug delivery, advanced imaging techniques, and personalized medicine will further propel market expansion. While the market faces challenges related to high research and development costs, and the need for robust regulatory frameworks, the immense potential of nanotechnology across diverse medical applications makes it a highly attractive and promising sector for future investment and growth. The increasing focus on personalized medicine and the growing demand for advanced diagnostic tools will ensure a positive outlook for the foreseeable future.
Nanotechnology Industry: A Comprehensive Market Report (2019-2033)
This dynamic report provides a comprehensive analysis of the Nanotechnology Industry, offering invaluable insights for investors, researchers, and industry professionals. With a focus on key market segments and leading players, this study covers the historical period (2019-2024), base year (2025), and forecast period (2025-2033), projecting a multi-billion dollar market opportunity. The report leverages extensive data analysis to uncover crucial trends, drivers, and challenges shaping the future of nanotechnology in medicine.
Nanotechnology Industry Market Structure & Competitive Landscape
The nanotechnology industry is characterized by a moderately concentrated market structure, with a few large multinational corporations and a multitude of smaller specialized firms. The Herfindahl-Hirschman Index (HHI) for the global medical nanotechnology market is estimated at 1,500 in 2025, indicating a moderately concentrated market. This concentration is primarily driven by significant investments from major pharmaceutical companies in R&D and commercialization of nanotechnology-based products. However, the landscape is highly dynamic, fueled by continuous innovation, strategic partnerships, and mergers & acquisitions (M&A). The total value of M&A activity in the medical nanotechnology sector reached approximately $XX Million in 2024.
- Innovation Drivers: Significant advancements in nanomaterials synthesis, characterization, and functionalization are pushing the boundaries of medical applications.
- Regulatory Impacts: Stringent regulatory approvals for nanotechnology-based medical products present challenges, but also ensure patient safety and market stability. The FDA's evolving guidelines play a significant role in shaping industry development.
- Product Substitutes: Traditional therapies and alternative approaches compete with nanotechnology-based solutions, creating a dynamic competitive landscape.
- End-User Segmentation: The market is primarily driven by healthcare providers, pharmaceutical companies, and research institutions. Growing demand from individual consumers and personalized medicine further shapes market segments.
- M&A Trends: Strategic acquisitions by major players are consolidating the market, leading to increased efficiency and streamlined product development. The focus is shifting toward acquisitions of companies with promising nanotechnology platforms and pipeline products.
Nanotechnology Industry Market Trends & Opportunities
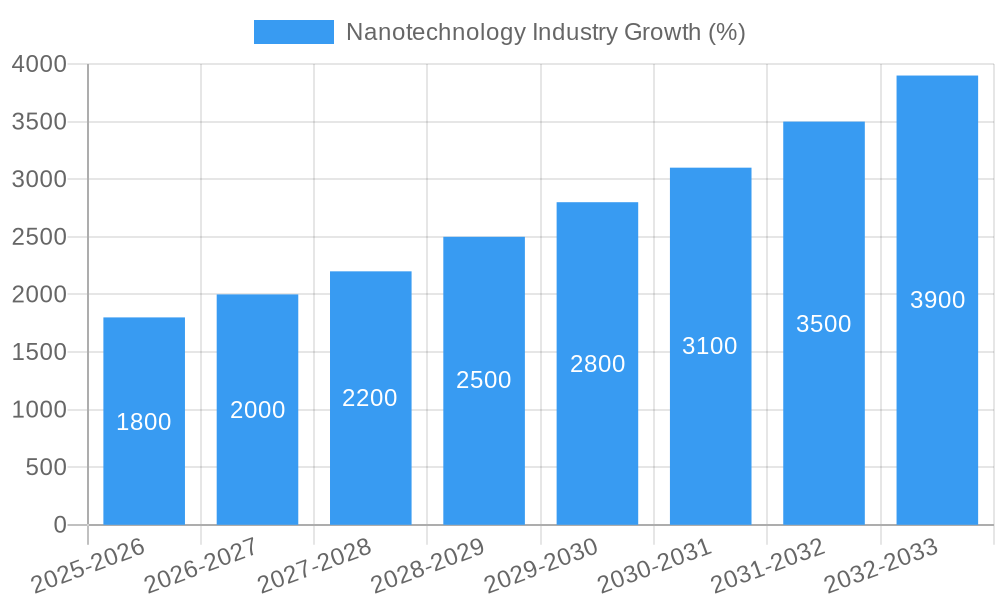
The global nanotechnology industry is experiencing significant growth, projected to reach $XX Million by 2033, with a Compound Annual Growth Rate (CAGR) of XX% during the forecast period (2025-2033). Market penetration rates vary significantly across different applications and therapeutic areas. Drug delivery systems are currently leading the way, capturing the highest market share; however, diagnostic imaging and tissue regeneration are also experiencing rapid growth, driven by technological advancements and rising healthcare expenditure. Technological shifts, including the development of advanced nanomaterials with enhanced biocompatibility and targeted drug delivery capabilities, are driving market expansion. Consumer preferences are also playing a crucial role, with increased demand for minimally invasive procedures and personalized therapies. The competitive dynamics are largely shaped by intellectual property rights, R&D investments, and regulatory approvals.
Dominant Markets & Segments in Nanotechnology Industry
The North American region currently dominates the global medical nanotechnology market, accounting for approximately XX% of the total revenue in 2025. This dominance is attributed to several factors:
- Drug Delivery: The highest market share stems from advancements in targeted drug delivery systems enhancing treatment efficacy and minimizing side effects.
- Oncological Diseases: The significant unmet need and high prevalence of cancer are driving the adoption of nanotechnology-based therapies for targeted drug delivery and improved diagnostics.
Key Growth Drivers:
- Robust Research and Development Infrastructure: Significant investments in academic and industrial research are fostering innovation in the field.
- Favorable Regulatory Environment: Government initiatives and funding programs support the development and commercialization of nanotechnology-based products.
- Strong Healthcare Infrastructure: High-quality healthcare infrastructure is essential for the successful adoption and application of advanced nanomedicine technologies.
Other major regions like Europe and Asia-Pacific are also experiencing substantial growth, driven by increased R&D investments and supportive government policies. The market for nanotechnology in cardiovascular diseases and neurological diseases is also projected to expand rapidly in the coming years, with the highest growth expected in Asia-Pacific.
Nanotechnology Industry Product Analysis
The nanotechnology industry offers a wide range of innovative products, including targeted drug delivery systems, advanced biomaterials, active implants, diagnostic imaging agents, and tissue engineering scaffolds. These products are characterized by their enhanced efficacy, reduced side effects, and improved patient outcomes. Competitive advantages are primarily determined by superior performance characteristics, intellectual property protection, and established market presence. Technological advancements focus on improving the biocompatibility, stability, and targetability of nanomaterials, leading to more efficient and effective medical therapies. The integration of nanotechnology with other emerging technologies, such as artificial intelligence and big data analytics, is further enhancing the capabilities of these products.
Key Drivers, Barriers & Challenges in Nanotechnology Industry
Key Drivers:
- Technological Advancements: Continuous innovation in nanomaterials synthesis and functionalization is driving the development of novel medical applications.
- Rising Healthcare Expenditure: Growing healthcare spending globally is fueling demand for advanced and effective medical therapies.
- Government Support and Funding: Government initiatives and funding programs promote research and development in the nanotechnology sector.
Challenges & Restraints:
- Regulatory Hurdles: The stringent regulatory pathways for nanotechnology-based products pose significant challenges to market entry. FDA approval processes can be lengthy and complex, increasing development costs.
- Supply Chain Issues: The complex supply chains involved in the production of nanomaterials can be vulnerable to disruptions, impacting market availability and pricing.
- Toxicity Concerns: Potential toxicity of certain nanomaterials is a concern that needs to be thoroughly addressed to ensure patient safety.
Growth Drivers in the Nanotechnology Industry Market
The nanotechnology industry's growth is driven by factors such as technological advancements leading to better drug delivery, improved diagnostics, and regenerative medicine capabilities. Strong government support through funding and research initiatives also contributes, along with rising healthcare spending and increasing demand for minimally invasive procedures.
Challenges Impacting Nanotechnology Industry Growth
High regulatory hurdles and the complexity of the approval processes for nanotechnology-based medical products significantly impede growth. Supply chain vulnerabilities and the associated production difficulties also present substantial challenges. Furthermore, concerns about the potential toxicity of certain nanomaterials affect market acceptance and create barriers to growth.
Key Players Shaping the Nanotechnology Industry Market
- Pfizer Inc
- Ensysce Biosciences Inc
- Sanofi SA
- Spago Nanomedical AB
- LiPlasome Pharma ApS
- CytImmune Sciences
- Genetic Immunity
- NanoCarrier Co Ltd
- Copernicus Therapeutics Inc
- Merck & Co Inc
- Nanobiotix
- Nanospectra Biosciences
- CytImmune Sciences Inc
- Starpharma Holdings Limited
- Nami Therapeutics Corp
- Taiwan Liposome Company Ltd
- Johnson & Johnson
- Ocuphire Pharma Inc
- Luminex Corporation
- Bristol-Myers Squibb Company
Significant Nanotechnology Industry Milestones
- January 2022: NaNotics LLC initiates a research collaboration with the Mayo Clinic to develop a nano-therapy targeting PD-L1.
- March 2021: A collaborative research project between Barcelona institutions and the University of Manchester receives EUR 12 Million in funding for European medical nanotechnology advancements.
Future Outlook for Nanotechnology Industry Market
The nanotechnology industry is poised for continued robust growth, driven by ongoing technological innovation, increasing healthcare spending, and favorable regulatory environments in key markets. Strategic partnerships and M&A activity will further consolidate the market, leading to the development of more sophisticated and effective nanotechnology-based medical products. The integration of artificial intelligence and big data analytics promises to unlock new opportunities and accelerate the translation of research findings into commercially viable therapies. The market's potential is enormous, extending to diverse applications that will profoundly impact healthcare in the coming years.
Nanotechnology Industry Segmentation
-
1. Application
- 1.1. Drug Delivery
- 1.2. Biomaterials
- 1.3. Active Implants
- 1.4. Diagnostic Imaging
- 1.5. Tissue Regeneration
-
2. Disease
- 2.1. Cardiovascular Diseases
- 2.2. Oncological Diseases
- 2.3. Neurological Diseases
- 2.4. Orthopedic Diseases
- 2.5. Infectious Diseases
- 2.6. Other Diseases
Nanotechnology Industry Segmentation By Geography
-
1. North America
- 1.1. United States
- 1.2. Canada
- 1.3. Mexico
-
2. Europe
- 2.1. France
- 2.2. Germany
- 2.3. United Kingdom
- 2.4. Italy
- 2.5. Spain
- 2.6. Rest of Europe
-
3. Asia Pacific
- 3.1. China
- 3.2. Japan
- 3.3. India
- 3.4. Australia
- 3.5. South Korea
- 3.6. Rest of Asia Pacific
-
4. Middle East and Africa
- 4.1. GCC
- 4.2. South Africa
- 4.3. Rest of Middle East and Africa
-
5. South America
- 5.1. Brazil
- 5.2. Argentina
- 5.3. Rest of South America
Nanotechnology Industry REPORT HIGHLIGHTS
| Aspects | Details |
|---|---|
| Study Period | 2019-2033 |
| Base Year | 2024 |
| Estimated Year | 2025 |
| Forecast Period | 2025-2033 |
| Historical Period | 2019-2024 |
| Growth Rate | CAGR of 11.90% from 2019-2033 |
| Segmentation |
|
Table of Contents
- 1. Introduction
- 1.1. Research Scope
- 1.2. Market Segmentation
- 1.3. Research Methodology
- 1.4. Definitions and Assumptions
- 2. Executive Summary
- 2.1. Introduction
- 3. Market Dynamics
- 3.1. Introduction
- 3.2. Market Drivers
- 3.2.1. Growing Prevalence of Cancer and Genetic and Cardiovascular Diseases; Increasing Advancements in Nanoscale Technologies for Diagnostic Procedures; Growing Preference for Personalized Medicines
- 3.3. Market Restrains
- 3.3.1. High Costs; Stringent Regulations for Commercial Introduction
- 3.4. Market Trends
- 3.4.1. The Oncological Diseases Segment is Expected to Show Better Growth During the Forecast Period
- 4. Market Factor Analysis
- 4.1. Porters Five Forces
- 4.2. Supply/Value Chain
- 4.3. PESTEL analysis
- 4.4. Market Entropy
- 4.5. Patent/Trademark Analysis
- 5. Global Nanotechnology Industry Analysis, Insights and Forecast, 2019-2031
- 5.1. Market Analysis, Insights and Forecast - by Application
- 5.1.1. Drug Delivery
- 5.1.2. Biomaterials
- 5.1.3. Active Implants
- 5.1.4. Diagnostic Imaging
- 5.1.5. Tissue Regeneration
- 5.2. Market Analysis, Insights and Forecast - by Disease
- 5.2.1. Cardiovascular Diseases
- 5.2.2. Oncological Diseases
- 5.2.3. Neurological Diseases
- 5.2.4. Orthopedic Diseases
- 5.2.5. Infectious Diseases
- 5.2.6. Other Diseases
- 5.3. Market Analysis, Insights and Forecast - by Region
- 5.3.1. North America
- 5.3.2. Europe
- 5.3.3. Asia Pacific
- 5.3.4. Middle East and Africa
- 5.3.5. South America
- 5.1. Market Analysis, Insights and Forecast - by Application
- 6. North America Nanotechnology Industry Analysis, Insights and Forecast, 2019-2031
- 6.1. Market Analysis, Insights and Forecast - by Application
- 6.1.1. Drug Delivery
- 6.1.2. Biomaterials
- 6.1.3. Active Implants
- 6.1.4. Diagnostic Imaging
- 6.1.5. Tissue Regeneration
- 6.2. Market Analysis, Insights and Forecast - by Disease
- 6.2.1. Cardiovascular Diseases
- 6.2.2. Oncological Diseases
- 6.2.3. Neurological Diseases
- 6.2.4. Orthopedic Diseases
- 6.2.5. Infectious Diseases
- 6.2.6. Other Diseases
- 6.1. Market Analysis, Insights and Forecast - by Application
- 7. Europe Nanotechnology Industry Analysis, Insights and Forecast, 2019-2031
- 7.1. Market Analysis, Insights and Forecast - by Application
- 7.1.1. Drug Delivery
- 7.1.2. Biomaterials
- 7.1.3. Active Implants
- 7.1.4. Diagnostic Imaging
- 7.1.5. Tissue Regeneration
- 7.2. Market Analysis, Insights and Forecast - by Disease
- 7.2.1. Cardiovascular Diseases
- 7.2.2. Oncological Diseases
- 7.2.3. Neurological Diseases
- 7.2.4. Orthopedic Diseases
- 7.2.5. Infectious Diseases
- 7.2.6. Other Diseases
- 7.1. Market Analysis, Insights and Forecast - by Application
- 8. Asia Pacific Nanotechnology Industry Analysis, Insights and Forecast, 2019-2031
- 8.1. Market Analysis, Insights and Forecast - by Application
- 8.1.1. Drug Delivery
- 8.1.2. Biomaterials
- 8.1.3. Active Implants
- 8.1.4. Diagnostic Imaging
- 8.1.5. Tissue Regeneration
- 8.2. Market Analysis, Insights and Forecast - by Disease
- 8.2.1. Cardiovascular Diseases
- 8.2.2. Oncological Diseases
- 8.2.3. Neurological Diseases
- 8.2.4. Orthopedic Diseases
- 8.2.5. Infectious Diseases
- 8.2.6. Other Diseases
- 8.1. Market Analysis, Insights and Forecast - by Application
- 9. Middle East and Africa Nanotechnology Industry Analysis, Insights and Forecast, 2019-2031
- 9.1. Market Analysis, Insights and Forecast - by Application
- 9.1.1. Drug Delivery
- 9.1.2. Biomaterials
- 9.1.3. Active Implants
- 9.1.4. Diagnostic Imaging
- 9.1.5. Tissue Regeneration
- 9.2. Market Analysis, Insights and Forecast - by Disease
- 9.2.1. Cardiovascular Diseases
- 9.2.2. Oncological Diseases
- 9.2.3. Neurological Diseases
- 9.2.4. Orthopedic Diseases
- 9.2.5. Infectious Diseases
- 9.2.6. Other Diseases
- 9.1. Market Analysis, Insights and Forecast - by Application
- 10. South America Nanotechnology Industry Analysis, Insights and Forecast, 2019-2031
- 10.1. Market Analysis, Insights and Forecast - by Application
- 10.1.1. Drug Delivery
- 10.1.2. Biomaterials
- 10.1.3. Active Implants
- 10.1.4. Diagnostic Imaging
- 10.1.5. Tissue Regeneration
- 10.2. Market Analysis, Insights and Forecast - by Disease
- 10.2.1. Cardiovascular Diseases
- 10.2.2. Oncological Diseases
- 10.2.3. Neurological Diseases
- 10.2.4. Orthopedic Diseases
- 10.2.5. Infectious Diseases
- 10.2.6. Other Diseases
- 10.1. Market Analysis, Insights and Forecast - by Application
- 11. North America Nanotechnology Industry Analysis, Insights and Forecast, 2019-2031
- 11.1. Market Analysis, Insights and Forecast - By Country/Sub-region
- 11.1.1 United States
- 11.1.2 Canada
- 11.1.3 Mexico
- 12. Europe Nanotechnology Industry Analysis, Insights and Forecast, 2019-2031
- 12.1. Market Analysis, Insights and Forecast - By Country/Sub-region
- 12.1.1 France
- 12.1.2 Germany
- 12.1.3 United Kingdom
- 12.1.4 Italy
- 12.1.5 Spain
- 12.1.6 Rest of Europe
- 13. Asia Pacific Nanotechnology Industry Analysis, Insights and Forecast, 2019-2031
- 13.1. Market Analysis, Insights and Forecast - By Country/Sub-region
- 13.1.1 China
- 13.1.2 Japan
- 13.1.3 India
- 13.1.4 Australia
- 13.1.5 South Korea
- 13.1.6 Rest of Asia Pacific
- 14. Middle East and Africa Nanotechnology Industry Analysis, Insights and Forecast, 2019-2031
- 14.1. Market Analysis, Insights and Forecast - By Country/Sub-region
- 14.1.1 GCC
- 14.1.2 South Africa
- 14.1.3 Rest of Middle East and Africa
- 15. South America Nanotechnology Industry Analysis, Insights and Forecast, 2019-2031
- 15.1. Market Analysis, Insights and Forecast - By Country/Sub-region
- 15.1.1 Brazil
- 15.1.2 Argentina
- 15.1.3 Rest of South America
- 16. Competitive Analysis
- 16.1. Global Market Share Analysis 2024
- 16.2. Company Profiles
- 16.2.1 Pfizer Inc
- 16.2.1.1. Overview
- 16.2.1.2. Products
- 16.2.1.3. SWOT Analysis
- 16.2.1.4. Recent Developments
- 16.2.1.5. Financials (Based on Availability)
- 16.2.2 Ensysce Biosciences Inc
- 16.2.2.1. Overview
- 16.2.2.2. Products
- 16.2.2.3. SWOT Analysis
- 16.2.2.4. Recent Developments
- 16.2.2.5. Financials (Based on Availability)
- 16.2.3 Sanofi SA
- 16.2.3.1. Overview
- 16.2.3.2. Products
- 16.2.3.3. SWOT Analysis
- 16.2.3.4. Recent Developments
- 16.2.3.5. Financials (Based on Availability)
- 16.2.4 Spago Nanomedical AB
- 16.2.4.1. Overview
- 16.2.4.2. Products
- 16.2.4.3. SWOT Analysis
- 16.2.4.4. Recent Developments
- 16.2.4.5. Financials (Based on Availability)
- 16.2.5 LiPlasome Pharma ApS
- 16.2.5.1. Overview
- 16.2.5.2. Products
- 16.2.5.3. SWOT Analysis
- 16.2.5.4. Recent Developments
- 16.2.5.5. Financials (Based on Availability)
- 16.2.6 CytImmune Sciences
- 16.2.6.1. Overview
- 16.2.6.2. Products
- 16.2.6.3. SWOT Analysis
- 16.2.6.4. Recent Developments
- 16.2.6.5. Financials (Based on Availability)
- 16.2.7 Genetic Immunity
- 16.2.7.1. Overview
- 16.2.7.2. Products
- 16.2.7.3. SWOT Analysis
- 16.2.7.4. Recent Developments
- 16.2.7.5. Financials (Based on Availability)
- 16.2.8 NanoCarrier Co Ltd
- 16.2.8.1. Overview
- 16.2.8.2. Products
- 16.2.8.3. SWOT Analysis
- 16.2.8.4. Recent Developments
- 16.2.8.5. Financials (Based on Availability)
- 16.2.9 Copernicus Therapeutics Inc
- 16.2.9.1. Overview
- 16.2.9.2. Products
- 16.2.9.3. SWOT Analysis
- 16.2.9.4. Recent Developments
- 16.2.9.5. Financials (Based on Availability)
- 16.2.10 Merck & Co Inc
- 16.2.10.1. Overview
- 16.2.10.2. Products
- 16.2.10.3. SWOT Analysis
- 16.2.10.4. Recent Developments
- 16.2.10.5. Financials (Based on Availability)
- 16.2.11 Nanobiotix
- 16.2.11.1. Overview
- 16.2.11.2. Products
- 16.2.11.3. SWOT Analysis
- 16.2.11.4. Recent Developments
- 16.2.11.5. Financials (Based on Availability)
- 16.2.12 Nanospectra Biosciences
- 16.2.12.1. Overview
- 16.2.12.2. Products
- 16.2.12.3. SWOT Analysis
- 16.2.12.4. Recent Developments
- 16.2.12.5. Financials (Based on Availability)
- 16.2.13 CytImmune Sciences Inc
- 16.2.13.1. Overview
- 16.2.13.2. Products
- 16.2.13.3. SWOT Analysis
- 16.2.13.4. Recent Developments
- 16.2.13.5. Financials (Based on Availability)
- 16.2.14 Starpharma Holdings Limited
- 16.2.14.1. Overview
- 16.2.14.2. Products
- 16.2.14.3. SWOT Analysis
- 16.2.14.4. Recent Developments
- 16.2.14.5. Financials (Based on Availability)
- 16.2.15 Nami Therapeutics Corp
- 16.2.15.1. Overview
- 16.2.15.2. Products
- 16.2.15.3. SWOT Analysis
- 16.2.15.4. Recent Developments
- 16.2.15.5. Financials (Based on Availability)
- 16.2.16 Taiwan Liposome Company Ltd
- 16.2.16.1. Overview
- 16.2.16.2. Products
- 16.2.16.3. SWOT Analysis
- 16.2.16.4. Recent Developments
- 16.2.16.5. Financials (Based on Availability)
- 16.2.17 Johnson & Johnson
- 16.2.17.1. Overview
- 16.2.17.2. Products
- 16.2.17.3. SWOT Analysis
- 16.2.17.4. Recent Developments
- 16.2.17.5. Financials (Based on Availability)
- 16.2.18 Ocuphire Pharma Inc
- 16.2.18.1. Overview
- 16.2.18.2. Products
- 16.2.18.3. SWOT Analysis
- 16.2.18.4. Recent Developments
- 16.2.18.5. Financials (Based on Availability)
- 16.2.19 Luminex Corporation
- 16.2.19.1. Overview
- 16.2.19.2. Products
- 16.2.19.3. SWOT Analysis
- 16.2.19.4. Recent Developments
- 16.2.19.5. Financials (Based on Availability)
- 16.2.20 Bristol-Myers Squibb Company
- 16.2.20.1. Overview
- 16.2.20.2. Products
- 16.2.20.3. SWOT Analysis
- 16.2.20.4. Recent Developments
- 16.2.20.5. Financials (Based on Availability)
- 16.2.1 Pfizer Inc
List of Figures
- Figure 1: Global Nanotechnology Industry Revenue Breakdown (Million, %) by Region 2024 & 2032
- Figure 2: North America Nanotechnology Industry Revenue (Million), by Country 2024 & 2032
- Figure 3: North America Nanotechnology Industry Revenue Share (%), by Country 2024 & 2032
- Figure 4: Europe Nanotechnology Industry Revenue (Million), by Country 2024 & 2032
- Figure 5: Europe Nanotechnology Industry Revenue Share (%), by Country 2024 & 2032
- Figure 6: Asia Pacific Nanotechnology Industry Revenue (Million), by Country 2024 & 2032
- Figure 7: Asia Pacific Nanotechnology Industry Revenue Share (%), by Country 2024 & 2032
- Figure 8: Middle East and Africa Nanotechnology Industry Revenue (Million), by Country 2024 & 2032
- Figure 9: Middle East and Africa Nanotechnology Industry Revenue Share (%), by Country 2024 & 2032
- Figure 10: South America Nanotechnology Industry Revenue (Million), by Country 2024 & 2032
- Figure 11: South America Nanotechnology Industry Revenue Share (%), by Country 2024 & 2032
- Figure 12: North America Nanotechnology Industry Revenue (Million), by Application 2024 & 2032
- Figure 13: North America Nanotechnology Industry Revenue Share (%), by Application 2024 & 2032
- Figure 14: North America Nanotechnology Industry Revenue (Million), by Disease 2024 & 2032
- Figure 15: North America Nanotechnology Industry Revenue Share (%), by Disease 2024 & 2032
- Figure 16: North America Nanotechnology Industry Revenue (Million), by Country 2024 & 2032
- Figure 17: North America Nanotechnology Industry Revenue Share (%), by Country 2024 & 2032
- Figure 18: Europe Nanotechnology Industry Revenue (Million), by Application 2024 & 2032
- Figure 19: Europe Nanotechnology Industry Revenue Share (%), by Application 2024 & 2032
- Figure 20: Europe Nanotechnology Industry Revenue (Million), by Disease 2024 & 2032
- Figure 21: Europe Nanotechnology Industry Revenue Share (%), by Disease 2024 & 2032
- Figure 22: Europe Nanotechnology Industry Revenue (Million), by Country 2024 & 2032
- Figure 23: Europe Nanotechnology Industry Revenue Share (%), by Country 2024 & 2032
- Figure 24: Asia Pacific Nanotechnology Industry Revenue (Million), by Application 2024 & 2032
- Figure 25: Asia Pacific Nanotechnology Industry Revenue Share (%), by Application 2024 & 2032
- Figure 26: Asia Pacific Nanotechnology Industry Revenue (Million), by Disease 2024 & 2032
- Figure 27: Asia Pacific Nanotechnology Industry Revenue Share (%), by Disease 2024 & 2032
- Figure 28: Asia Pacific Nanotechnology Industry Revenue (Million), by Country 2024 & 2032
- Figure 29: Asia Pacific Nanotechnology Industry Revenue Share (%), by Country 2024 & 2032
- Figure 30: Middle East and Africa Nanotechnology Industry Revenue (Million), by Application 2024 & 2032
- Figure 31: Middle East and Africa Nanotechnology Industry Revenue Share (%), by Application 2024 & 2032
- Figure 32: Middle East and Africa Nanotechnology Industry Revenue (Million), by Disease 2024 & 2032
- Figure 33: Middle East and Africa Nanotechnology Industry Revenue Share (%), by Disease 2024 & 2032
- Figure 34: Middle East and Africa Nanotechnology Industry Revenue (Million), by Country 2024 & 2032
- Figure 35: Middle East and Africa Nanotechnology Industry Revenue Share (%), by Country 2024 & 2032
- Figure 36: South America Nanotechnology Industry Revenue (Million), by Application 2024 & 2032
- Figure 37: South America Nanotechnology Industry Revenue Share (%), by Application 2024 & 2032
- Figure 38: South America Nanotechnology Industry Revenue (Million), by Disease 2024 & 2032
- Figure 39: South America Nanotechnology Industry Revenue Share (%), by Disease 2024 & 2032
- Figure 40: South America Nanotechnology Industry Revenue (Million), by Country 2024 & 2032
- Figure 41: South America Nanotechnology Industry Revenue Share (%), by Country 2024 & 2032
List of Tables
- Table 1: Global Nanotechnology Industry Revenue Million Forecast, by Region 2019 & 2032
- Table 2: Global Nanotechnology Industry Revenue Million Forecast, by Application 2019 & 2032
- Table 3: Global Nanotechnology Industry Revenue Million Forecast, by Disease 2019 & 2032
- Table 4: Global Nanotechnology Industry Revenue Million Forecast, by Region 2019 & 2032
- Table 5: Global Nanotechnology Industry Revenue Million Forecast, by Country 2019 & 2032
- Table 6: United States Nanotechnology Industry Revenue (Million) Forecast, by Application 2019 & 2032
- Table 7: Canada Nanotechnology Industry Revenue (Million) Forecast, by Application 2019 & 2032
- Table 8: Mexico Nanotechnology Industry Revenue (Million) Forecast, by Application 2019 & 2032
- Table 9: Global Nanotechnology Industry Revenue Million Forecast, by Country 2019 & 2032
- Table 10: France Nanotechnology Industry Revenue (Million) Forecast, by Application 2019 & 2032
- Table 11: Germany Nanotechnology Industry Revenue (Million) Forecast, by Application 2019 & 2032
- Table 12: United Kingdom Nanotechnology Industry Revenue (Million) Forecast, by Application 2019 & 2032
- Table 13: Italy Nanotechnology Industry Revenue (Million) Forecast, by Application 2019 & 2032
- Table 14: Spain Nanotechnology Industry Revenue (Million) Forecast, by Application 2019 & 2032
- Table 15: Rest of Europe Nanotechnology Industry Revenue (Million) Forecast, by Application 2019 & 2032
- Table 16: Global Nanotechnology Industry Revenue Million Forecast, by Country 2019 & 2032
- Table 17: China Nanotechnology Industry Revenue (Million) Forecast, by Application 2019 & 2032
- Table 18: Japan Nanotechnology Industry Revenue (Million) Forecast, by Application 2019 & 2032
- Table 19: India Nanotechnology Industry Revenue (Million) Forecast, by Application 2019 & 2032
- Table 20: Australia Nanotechnology Industry Revenue (Million) Forecast, by Application 2019 & 2032
- Table 21: South Korea Nanotechnology Industry Revenue (Million) Forecast, by Application 2019 & 2032
- Table 22: Rest of Asia Pacific Nanotechnology Industry Revenue (Million) Forecast, by Application 2019 & 2032
- Table 23: Global Nanotechnology Industry Revenue Million Forecast, by Country 2019 & 2032
- Table 24: GCC Nanotechnology Industry Revenue (Million) Forecast, by Application 2019 & 2032
- Table 25: South Africa Nanotechnology Industry Revenue (Million) Forecast, by Application 2019 & 2032
- Table 26: Rest of Middle East and Africa Nanotechnology Industry Revenue (Million) Forecast, by Application 2019 & 2032
- Table 27: Global Nanotechnology Industry Revenue Million Forecast, by Country 2019 & 2032
- Table 28: Brazil Nanotechnology Industry Revenue (Million) Forecast, by Application 2019 & 2032
- Table 29: Argentina Nanotechnology Industry Revenue (Million) Forecast, by Application 2019 & 2032
- Table 30: Rest of South America Nanotechnology Industry Revenue (Million) Forecast, by Application 2019 & 2032
- Table 31: Global Nanotechnology Industry Revenue Million Forecast, by Application 2019 & 2032
- Table 32: Global Nanotechnology Industry Revenue Million Forecast, by Disease 2019 & 2032
- Table 33: Global Nanotechnology Industry Revenue Million Forecast, by Country 2019 & 2032
- Table 34: United States Nanotechnology Industry Revenue (Million) Forecast, by Application 2019 & 2032
- Table 35: Canada Nanotechnology Industry Revenue (Million) Forecast, by Application 2019 & 2032
- Table 36: Mexico Nanotechnology Industry Revenue (Million) Forecast, by Application 2019 & 2032
- Table 37: Global Nanotechnology Industry Revenue Million Forecast, by Application 2019 & 2032
- Table 38: Global Nanotechnology Industry Revenue Million Forecast, by Disease 2019 & 2032
- Table 39: Global Nanotechnology Industry Revenue Million Forecast, by Country 2019 & 2032
- Table 40: France Nanotechnology Industry Revenue (Million) Forecast, by Application 2019 & 2032
- Table 41: Germany Nanotechnology Industry Revenue (Million) Forecast, by Application 2019 & 2032
- Table 42: United Kingdom Nanotechnology Industry Revenue (Million) Forecast, by Application 2019 & 2032
- Table 43: Italy Nanotechnology Industry Revenue (Million) Forecast, by Application 2019 & 2032
- Table 44: Spain Nanotechnology Industry Revenue (Million) Forecast, by Application 2019 & 2032
- Table 45: Rest of Europe Nanotechnology Industry Revenue (Million) Forecast, by Application 2019 & 2032
- Table 46: Global Nanotechnology Industry Revenue Million Forecast, by Application 2019 & 2032
- Table 47: Global Nanotechnology Industry Revenue Million Forecast, by Disease 2019 & 2032
- Table 48: Global Nanotechnology Industry Revenue Million Forecast, by Country 2019 & 2032
- Table 49: China Nanotechnology Industry Revenue (Million) Forecast, by Application 2019 & 2032
- Table 50: Japan Nanotechnology Industry Revenue (Million) Forecast, by Application 2019 & 2032
- Table 51: India Nanotechnology Industry Revenue (Million) Forecast, by Application 2019 & 2032
- Table 52: Australia Nanotechnology Industry Revenue (Million) Forecast, by Application 2019 & 2032
- Table 53: South Korea Nanotechnology Industry Revenue (Million) Forecast, by Application 2019 & 2032
- Table 54: Rest of Asia Pacific Nanotechnology Industry Revenue (Million) Forecast, by Application 2019 & 2032
- Table 55: Global Nanotechnology Industry Revenue Million Forecast, by Application 2019 & 2032
- Table 56: Global Nanotechnology Industry Revenue Million Forecast, by Disease 2019 & 2032
- Table 57: Global Nanotechnology Industry Revenue Million Forecast, by Country 2019 & 2032
- Table 58: GCC Nanotechnology Industry Revenue (Million) Forecast, by Application 2019 & 2032
- Table 59: South Africa Nanotechnology Industry Revenue (Million) Forecast, by Application 2019 & 2032
- Table 60: Rest of Middle East and Africa Nanotechnology Industry Revenue (Million) Forecast, by Application 2019 & 2032
- Table 61: Global Nanotechnology Industry Revenue Million Forecast, by Application 2019 & 2032
- Table 62: Global Nanotechnology Industry Revenue Million Forecast, by Disease 2019 & 2032
- Table 63: Global Nanotechnology Industry Revenue Million Forecast, by Country 2019 & 2032
- Table 64: Brazil Nanotechnology Industry Revenue (Million) Forecast, by Application 2019 & 2032
- Table 65: Argentina Nanotechnology Industry Revenue (Million) Forecast, by Application 2019 & 2032
- Table 66: Rest of South America Nanotechnology Industry Revenue (Million) Forecast, by Application 2019 & 2032
Frequently Asked Questions
1. What is the projected Compound Annual Growth Rate (CAGR) of the Nanotechnology Industry?
The projected CAGR is approximately 11.90%.
2. Which companies are prominent players in the Nanotechnology Industry?
Key companies in the market include Pfizer Inc, Ensysce Biosciences Inc, Sanofi SA, Spago Nanomedical AB, LiPlasome Pharma ApS, CytImmune Sciences, Genetic Immunity, NanoCarrier Co Ltd, Copernicus Therapeutics Inc, Merck & Co Inc, Nanobiotix, Nanospectra Biosciences, CytImmune Sciences Inc, Starpharma Holdings Limited, Nami Therapeutics Corp, Taiwan Liposome Company Ltd, Johnson & Johnson, Ocuphire Pharma Inc, Luminex Corporation, Bristol-Myers Squibb Company.
3. What are the main segments of the Nanotechnology Industry?
The market segments include Application, Disease.
4. Can you provide details about the market size?
The market size is estimated to be USD XX Million as of 2022.
5. What are some drivers contributing to market growth?
Growing Prevalence of Cancer and Genetic and Cardiovascular Diseases; Increasing Advancements in Nanoscale Technologies for Diagnostic Procedures; Growing Preference for Personalized Medicines.
6. What are the notable trends driving market growth?
The Oncological Diseases Segment is Expected to Show Better Growth During the Forecast Period.
7. Are there any restraints impacting market growth?
High Costs; Stringent Regulations for Commercial Introduction.
8. Can you provide examples of recent developments in the market?
In January 2022, NaNotics LLC entered a research collaboration with Mayo Clinic to develop a NaNot that targets the soluble form of PD-L1, a tumor-generated immune inhibitor.
9. What pricing options are available for accessing the report?
Pricing options include single-user, multi-user, and enterprise licenses priced at USD 4750, USD 5250, and USD 8750 respectively.
10. Is the market size provided in terms of value or volume?
The market size is provided in terms of value, measured in Million.
11. Are there any specific market keywords associated with the report?
Yes, the market keyword associated with the report is "Nanotechnology Industry," which aids in identifying and referencing the specific market segment covered.
12. How do I determine which pricing option suits my needs best?
The pricing options vary based on user requirements and access needs. Individual users may opt for single-user licenses, while businesses requiring broader access may choose multi-user or enterprise licenses for cost-effective access to the report.
13. Are there any additional resources or data provided in the Nanotechnology Industry report?
While the report offers comprehensive insights, it's advisable to review the specific contents or supplementary materials provided to ascertain if additional resources or data are available.
14. How can I stay updated on further developments or reports in the Nanotechnology Industry?
To stay informed about further developments, trends, and reports in the Nanotechnology Industry, consider subscribing to industry newsletters, following relevant companies and organizations, or regularly checking reputable industry news sources and publications.
Methodology
Step 1 - Identification of Relevant Samples Size from Population Database


Step 2 - Approaches for Defining Global Market Size (Value, Volume* & Price*)

Note*: In applicable scenarios
Step 3 - Data Sources
Primary Research
- Web Analytics
- Survey Reports
- Research Institute
- Latest Research Reports
- Opinion Leaders
Secondary Research
- Annual Reports
- White Paper
- Latest Press Release
- Industry Association
- Paid Database
- Investor Presentations

Step 4 - Data Triangulation
Involves using different sources of information in order to increase the validity of a study
These sources are likely to be stakeholders in a program - participants, other researchers, program staff, other community members, and so on.
Then we put all data in single framework & apply various statistical tools to find out the dynamic on the market.
During the analysis stage, feedback from the stakeholder groups would be compared to determine areas of agreement as well as areas of divergence
