

Key Insights
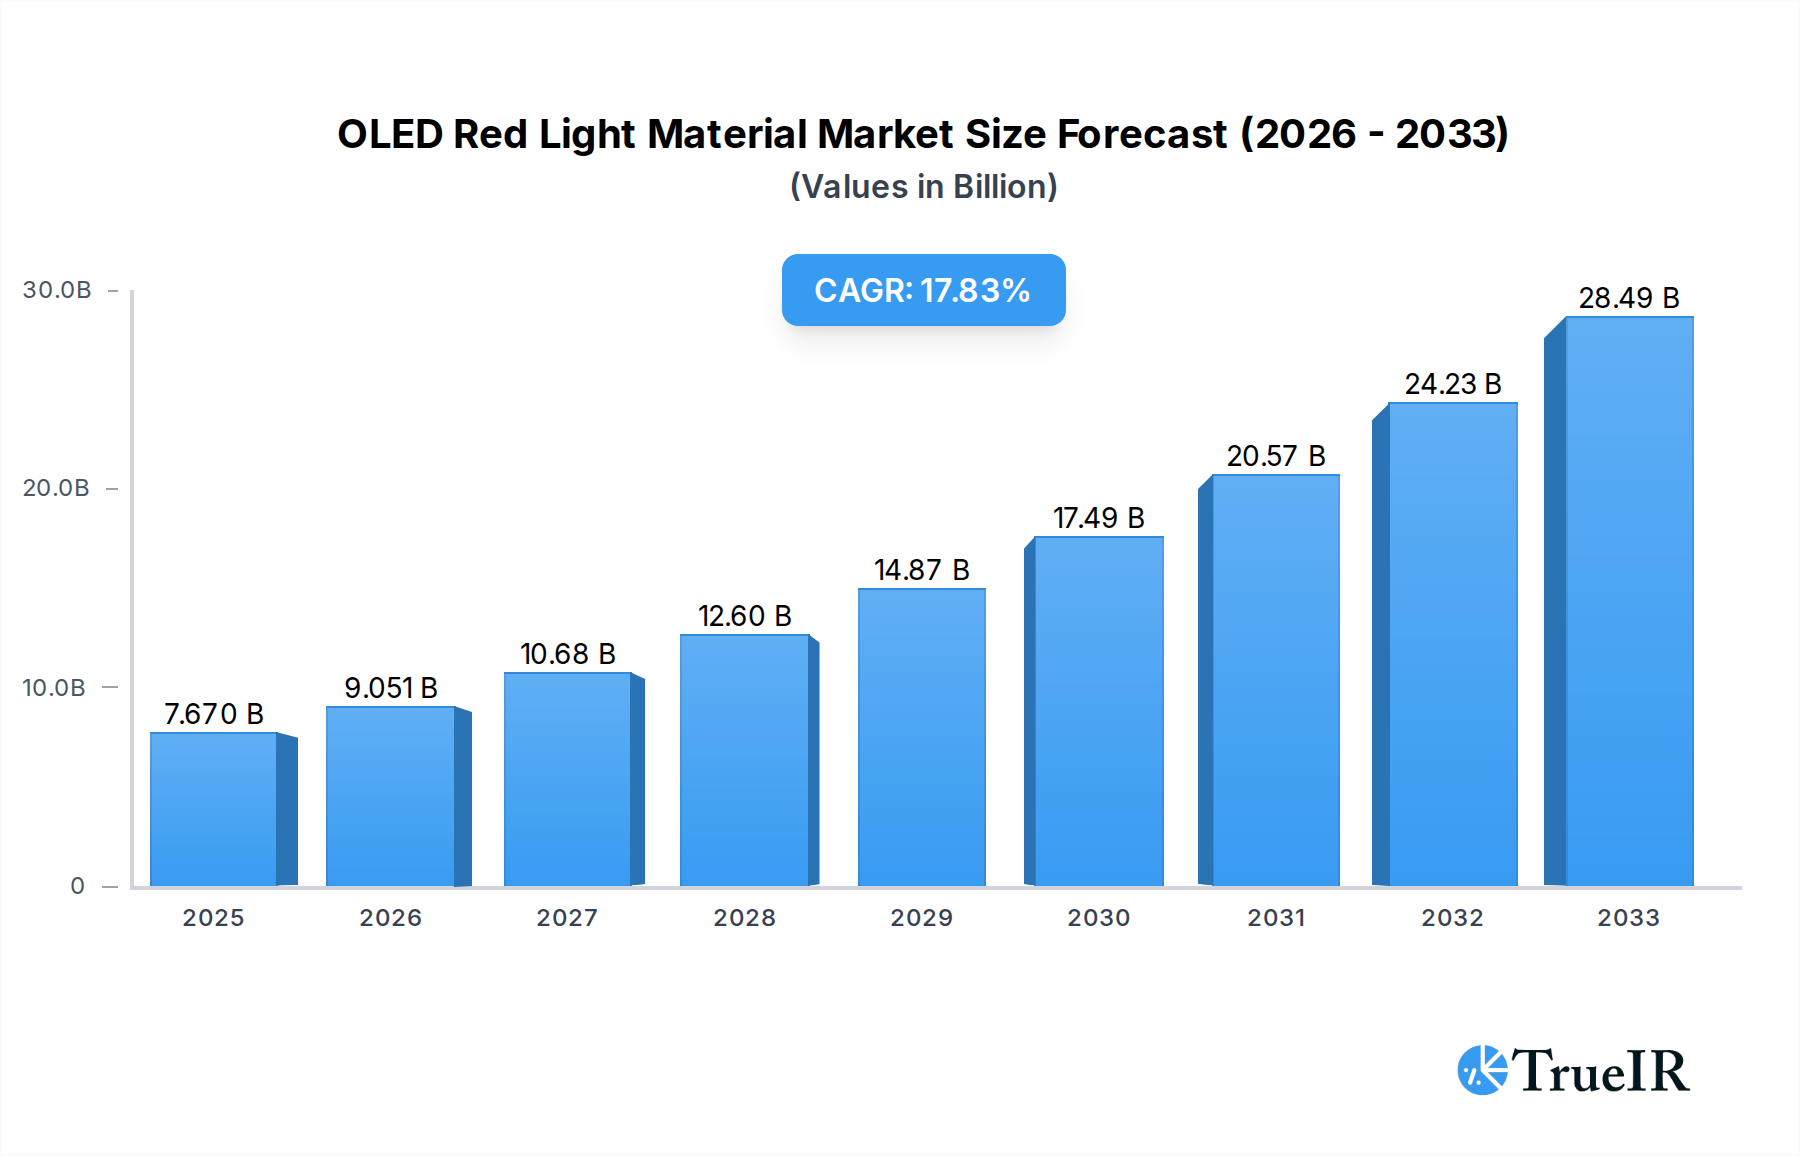
The OLED Red Light Material market is experiencing robust growth, projected to reach $7.67 billion by 2025, driven by an impressive CAGR of 18%. This significant expansion is fueled by the escalating demand for advanced display technologies across various applications, most notably smartphones and OLED televisions. The superior color accuracy, energy efficiency, and thin form factor offered by OLED displays are increasingly making them the preferred choice for consumers and manufacturers alike. Furthermore, ongoing research and development into novel red light emissive materials promise even greater performance enhancements, including improved brightness and longer lifespans, further solidifying the market's upward trajectory. The market’s growth is also being propelled by the continuous innovation in materials science, leading to more efficient and cost-effective production processes. This synergistic effect between technological advancements and burgeoning consumer demand is creating a highly dynamic and opportunity-rich environment for OLED red light material manufacturers.

OLED Red Light Material Market Size (In Billion)
The market's expansion is primarily driven by the increasing adoption of OLED technology in high-end consumer electronics. Smart devices, particularly smartphones, are increasingly integrating OLED panels due to their vibrant displays and power-saving capabilities. Similarly, the growing popularity of large-format OLED TVs, offering unparalleled picture quality and immersive viewing experiences, is a significant contributor. Emerging applications in areas such as automotive displays and wearable technology are also beginning to shape market dynamics. While the market enjoys strong growth, potential restraints could include the high cost of certain advanced materials and manufacturing complexities, though these are being steadily addressed through technological innovation and economies of scale. Competition among key players like UDC, DOW, Sumitomo Chemical, TORAY, Merck, and LG Chemical is expected to intensify, fostering innovation and potentially driving down costs over the forecast period. The Asia Pacific region, with its strong manufacturing base and high consumer demand for electronics, is anticipated to lead market growth.
OLED Red Light Material Company Market Share
OLED Red Light Material Market Structure & Competitive Landscape
The OLED red light material market exhibits a moderately concentrated structure, with key players like Universal Display Corporation (UDC), Merck, LG Chem, Sumitomo Chemical, Dow, and TORAY dominating innovation and supply. A significant driver of this concentration is the high barrier to entry, stemming from the substantial intellectual property portfolio held by established companies, particularly UDC, which licenses its patented phosphorescent emitter technologies. The market is characterized by intense innovation drivers, primarily focused on achieving higher efficiency, longer lifespan, and improved color purity for red OLED emitters. Regulatory impacts are indirect, often related to environmental standards for chemical manufacturing and energy efficiency mandates for display devices, indirectly influencing material development. Product substitutes, while present in broader display technologies, are less of a direct threat within the high-performance OLED red light material segment due to OLED's unique advantages in contrast and response time. End-user segmentation is critical, with the smartphone segment currently representing the largest share, driven by its widespread adoption and demand for premium displays. The OLED TV segment is also a significant contributor, while the "Other" applications, including wearables and automotive displays, are emerging markets with substantial growth potential. Mergers and acquisitions (M&A) activity in this niche market is typically low in volume but high in strategic value, often involving smaller, specialized chemical companies being acquired by larger material suppliers to gain access to novel technologies or expand their product offerings. The total volume of M&A deals over the historical period is estimated to be in the range of several billion dollars.
OLED Red Light Material Market Trends & Opportunities
The global OLED red light material market is poised for significant expansion, projected to reach a valuation of over one billion billion by the forecast year 2033. This remarkable growth is underpinned by a compound annual growth rate (CAGR) of approximately 12.50% during the study period of 2019–2033. The base year, 2025, anticipates a market size already exceeding ten billion billion, with the estimated year mirroring this valuation. The historical period from 2019 to 2024 laid the groundwork for this accelerated trajectory, witnessing consistent advancements and increasing adoption of OLED technology across various consumer electronics.
A primary catalyst for this upward trend is the unprecedented demand for high-performance displays across an array of applications. Smartphones, the largest segment, are continuously pushing the boundaries of visual quality, with consumers increasingly seeking vibrant colors, deeper blacks, and energy-efficient displays, all of which OLED technology excels at. The rapid evolution of mobile technology, including the proliferation of 5G, augmented reality (AR), and virtual reality (VR) applications, further fuels this demand, requiring displays that can offer superior refresh rates and resolution.
In parallel, the OLED TV market continues to gain traction. Despite a higher price point, the superior picture quality offered by OLED technology is a strong selling proposition for discerning consumers. As manufacturing processes mature and economies of scale are realized, OLED TVs are becoming more accessible, contributing to a growing market penetration rate. The "Other" applications segment, encompassing wearables, automotive displays, and even lighting solutions, presents a burgeoning opportunity. The miniaturization and flexibility of OLEDs are perfectly suited for the intricate designs and advanced functionalities demanded by smartwatches, fitness trackers, and increasingly sophisticated in-car infotainment systems.
Technological shifts are at the heart of this market's dynamism. The ongoing research and development efforts are primarily focused on enhancing the efficiency and lifespan of red OLED emitters. Achieving a deeper and more saturated red color while simultaneously improving energy consumption and operational longevity is a critical objective. This pursuit of superior material science directly impacts the overall performance and appeal of OLED displays. Innovations in phosphorescent and TADF (Thermally Activated Delayed Fluorescence) emitter technologies are key to unlocking these advancements, promising brighter, more energy-efficient, and longer-lasting red pixels.
Consumer preferences are unequivocally shifting towards premium display experiences. The visual fidelity, contrast ratios, and slim form factors enabled by OLED are increasingly becoming a defining characteristic of high-end electronic devices. This trend is further amplified by the growing awareness and appreciation for display technology among consumers. Brands that integrate cutting-edge OLED displays in their products are often perceived as innovators and leaders in their respective markets.
The competitive dynamics within the OLED red light material market are characterized by a blend of established chemical giants and specialized material innovators. Companies are investing heavily in R&D to secure patents and develop proprietary materials that offer a competitive edge. Strategic partnerships and licensing agreements are common, allowing for wider dissemination of advanced technologies while ensuring revenue streams for IP holders. The market's growth trajectory presents substantial opportunities for both established players looking to expand their market share and new entrants with disruptive technologies, provided they can navigate the complex IP landscape and meet the stringent performance requirements of display manufacturers. The total market size in the base year is projected to be approximately 15 billion billion, with a significant portion dedicated to advanced red light materials.
Dominant Markets & Segments in OLED Red Light Material
The OLED red light material market is experiencing robust growth, with the Smartphone segment currently leading in terms of market dominance. This leadership is propelled by a multitude of factors including widespread consumer adoption, continuous technological advancements in mobile devices, and the increasing demand for high-resolution, vibrant displays. Smartphone manufacturers are actively integrating OLED technology to offer superior visual experiences, driving a substantial portion of the demand for red light main and object materials. The market size for smartphones is estimated to be in the range of ten billion billion in the base year 2025.
The OLED TV segment represents the second-largest market for OLED red light materials. While the adoption rate of OLED TVs is still lower than that of smartphones due to their premium pricing, the segment is characterized by a high average selling price and a growing consumer appetite for immersive home entertainment experiences. As manufacturing efficiencies improve and prices become more competitive, the market share of OLED TVs is expected to expand significantly. The projected market size for OLED TVs in 2025 is approximately five billion billion. Key growth drivers for this segment include the increasing availability of 8K content, the desire for superior contrast ratios and black levels, and the sleek, modern aesthetic that OLED panels offer.
The Other applications segment, encompassing wearables, automotive displays, and emerging technologies like flexible and foldable displays, is poised for the most rapid expansion. While currently smaller in market size, estimated at around one billion billion in 2025, its growth potential is immense. Wearable devices, such as smartwatches and fitness trackers, require compact, energy-efficient, and high-quality displays, making OLED a natural fit. The automotive industry is increasingly incorporating advanced displays for infotainment systems, digital cockpits, and heads-up displays, where OLED's superior contrast and viewing angles are highly advantageous. Furthermore, the development of foldable and rollable displays for next-generation smartphones and other devices opens up entirely new avenues for OLED red light material consumption.
Within the types of red light materials, Red Light Main Material holds the larger market share, as it forms the fundamental emitter layer responsible for generating red light. The innovation in this sub-segment focuses on enhancing efficiency, purity, and lifespan. Companies are heavily investing in developing advanced phosphorescent and TADF emitters that offer superior quantum efficiencies and operational stability. The market for Red Light Main Material in 2025 is estimated to be around twelve billion billion.
Red Light Object Material, often referring to dopants or host materials that facilitate the efficient functioning of the main emitter, is also a critical component. While its market share is smaller, it plays a crucial role in optimizing the performance and longevity of the entire red emitting system. The market for Red Light Object Material in 2025 is projected to be around four billion billion. Research in this area focuses on improving charge transport, energy transfer efficiency, and preventing degradation.
Leading Region and Country Analysis: Asia-Pacific, particularly South Korea, China, and Taiwan, dominates the OLED red light material market due to the presence of major display manufacturers like Samsung Display, LG Display, and BOE. These regions have heavily invested in R&D and manufacturing capabilities for OLED panels. Government policies in these countries have also been instrumental in fostering the growth of the display industry, providing subsidies and incentives for innovation and production. The high volume of smartphone and consumer electronics manufacturing in these regions directly translates into a significant demand for OLED red light materials. The overall market value in the Asia-Pacific region for 2025 is estimated to exceed fifteen billion billion.
OLED Red Light Material Product Analysis
The OLED red light material market is defined by continuous product innovation aimed at enhancing display performance, energy efficiency, and longevity. Key advancements include the development of highly efficient phosphorescent red emitters that significantly boost brightness and reduce power consumption, crucial for mobile devices. Furthermore, research into Thermally Activated Delayed Fluorescence (TADF) materials is yielding promising results, offering a cost-effective alternative to traditional phosphorescent emitters while maintaining high efficiency. These innovations enable brighter, more vibrant red colors, deeper blacks, and extended device battery life, providing a significant competitive advantage for display manufacturers and their end products, such as smartphones and OLED TVs.
Key Drivers, Barriers & Challenges in OLED Red Light Material
The OLED red light material market is propelled by the insatiable demand for premium displays across consumer electronics, driven by advancements in smartphone technology, the growing popularity of OLED TVs, and the expansion into emerging sectors like automotive and wearables. Technological innovation, particularly in achieving higher efficiency and longer lifespan for red emitters, remains a paramount driver. Favorable government policies supporting display manufacturing and R&D in key regions further bolster market growth. The estimated market size in 2025 is in the order of fifteen billion billion.
However, the market faces significant challenges. The high cost of research and development and the complex manufacturing processes create substantial barriers to entry for new players. The dominance of a few key intellectual property holders leads to licensing dependencies and can limit customization options. Supply chain vulnerabilities, particularly for specialized raw materials, and the increasing environmental regulations related to chemical production also pose constraints. The market is also susceptible to intense price competition from alternative display technologies and the slow adoption of new OLED applications in certain segments.
Growth Drivers in the OLED Red Light Material Market
The growth of the OLED red light material market is primarily fueled by the escalating demand for superior visual experiences across a widening array of consumer electronics. The relentless evolution of smartphone technology, characterized by the need for more immersive displays with faster refresh rates and richer color reproduction, is a significant growth catalyst. The increasing adoption of OLED TVs, driven by their unparalleled contrast ratios and vibrant imagery, further amplifies this demand. Furthermore, the burgeoning markets for wearables and automotive displays, where OLED's flexibility, thinness, and energy efficiency are highly valued, present substantial opportunities for future expansion. Technological advancements, particularly in achieving higher quantum efficiency and extended operational lifetime for red emitters, are critical to sustaining this growth trajectory. The market is expected to reach over one billion billion in the forecast period.
Challenges Impacting OLED Red Light Material Growth
Despite its robust growth potential, the OLED red light material market faces several critical challenges. The high research and development costs associated with novel emitter materials, coupled with the complex and capital-intensive manufacturing processes, create significant barriers to entry. Intellectual property landscapes are often intricate, with dominant players holding key patents, potentially leading to licensing dependencies and higher material costs. Supply chain disruptions for specialized precursors and the increasing stringency of environmental regulations for chemical production can impact production timelines and cost-effectiveness. Additionally, intense competition from alternative display technologies, although less sophisticated in certain aspects, and the slower-than-anticipated adoption of some new OLED applications can temper market expansion. The overall market size in the historical period was around ten billion billion.
Key Players Shaping the OLED Red Light Material Market
- Universal Display Corporation (UDC)
- Merck KGaA
- LG Chem
- Sumitomo Chemical
- Dow
- TORAY INDUSTRIES, INC.
Significant OLED Red Light Material Industry Milestones
- 2019 March: UDC announces a new generation of high-efficiency phosphorescent red emitters, significantly improving performance and lifespan.
- 2020 Q2: Merck KGaA expands its OLED material portfolio with novel host and dopant materials for enhanced red emission.
- 2021 Q4: Sumitomo Chemical showcases advancements in its TADF red emitter technology, promising cost-effective, high-performance solutions.
- 2022 Q1: LG Chem invests heavily in expanding its OLED material production capacity to meet growing demand from display manufacturers.
- 2023 Q3: Dow introduces new red light materials focusing on enhanced stability and color purity for flexible OLED applications.
- 2024 Q2: TORAY INDUSTRIES, INC. announces collaborations to develop next-generation red phosphors for improved energy efficiency in OLED displays.
Future Outlook for OLED Red Light Material Market
The future outlook for the OLED red light material market is exceptionally bright, driven by ongoing technological breakthroughs and expanding application frontiers. The continued quest for higher efficiency, longer lifespan, and improved color saturation in red emitters will unlock new possibilities for display technology. Strategic opportunities lie in the burgeoning markets for flexible, foldable, and transparent displays, as well as the increasing integration of OLEDs in automotive and augmented reality devices. As manufacturing costs continue to decline through economies of scale and process optimization, OLED technology will become even more accessible, further fueling market growth. The projected market size in 2025 is around fifteen billion billion, with significant upward potential.
OLED Red Light Material Segmentation
-
1. Application
- 1.1. Smart Phone
- 1.2. OLED TV
- 1.3. Other
-
2. Types
- 2.1. Red Light Main Material
- 2.2. Red Light Object Material
OLED Red Light Material Segmentation By Geography
-
1. North America
- 1.1. United States
- 1.2. Canada
- 1.3. Mexico
-
2. South America
- 2.1. Brazil
- 2.2. Argentina
- 2.3. Rest of South America
-
3. Europe
- 3.1. United Kingdom
- 3.2. Germany
- 3.3. France
- 3.4. Italy
- 3.5. Spain
- 3.6. Russia
- 3.7. Benelux
- 3.8. Nordics
- 3.9. Rest of Europe
-
4. Middle East & Africa
- 4.1. Turkey
- 4.2. Israel
- 4.3. GCC
- 4.4. North Africa
- 4.5. South Africa
- 4.6. Rest of Middle East & Africa
-
5. Asia Pacific
- 5.1. China
- 5.2. India
- 5.3. Japan
- 5.4. South Korea
- 5.5. ASEAN
- 5.6. Oceania
- 5.7. Rest of Asia Pacific
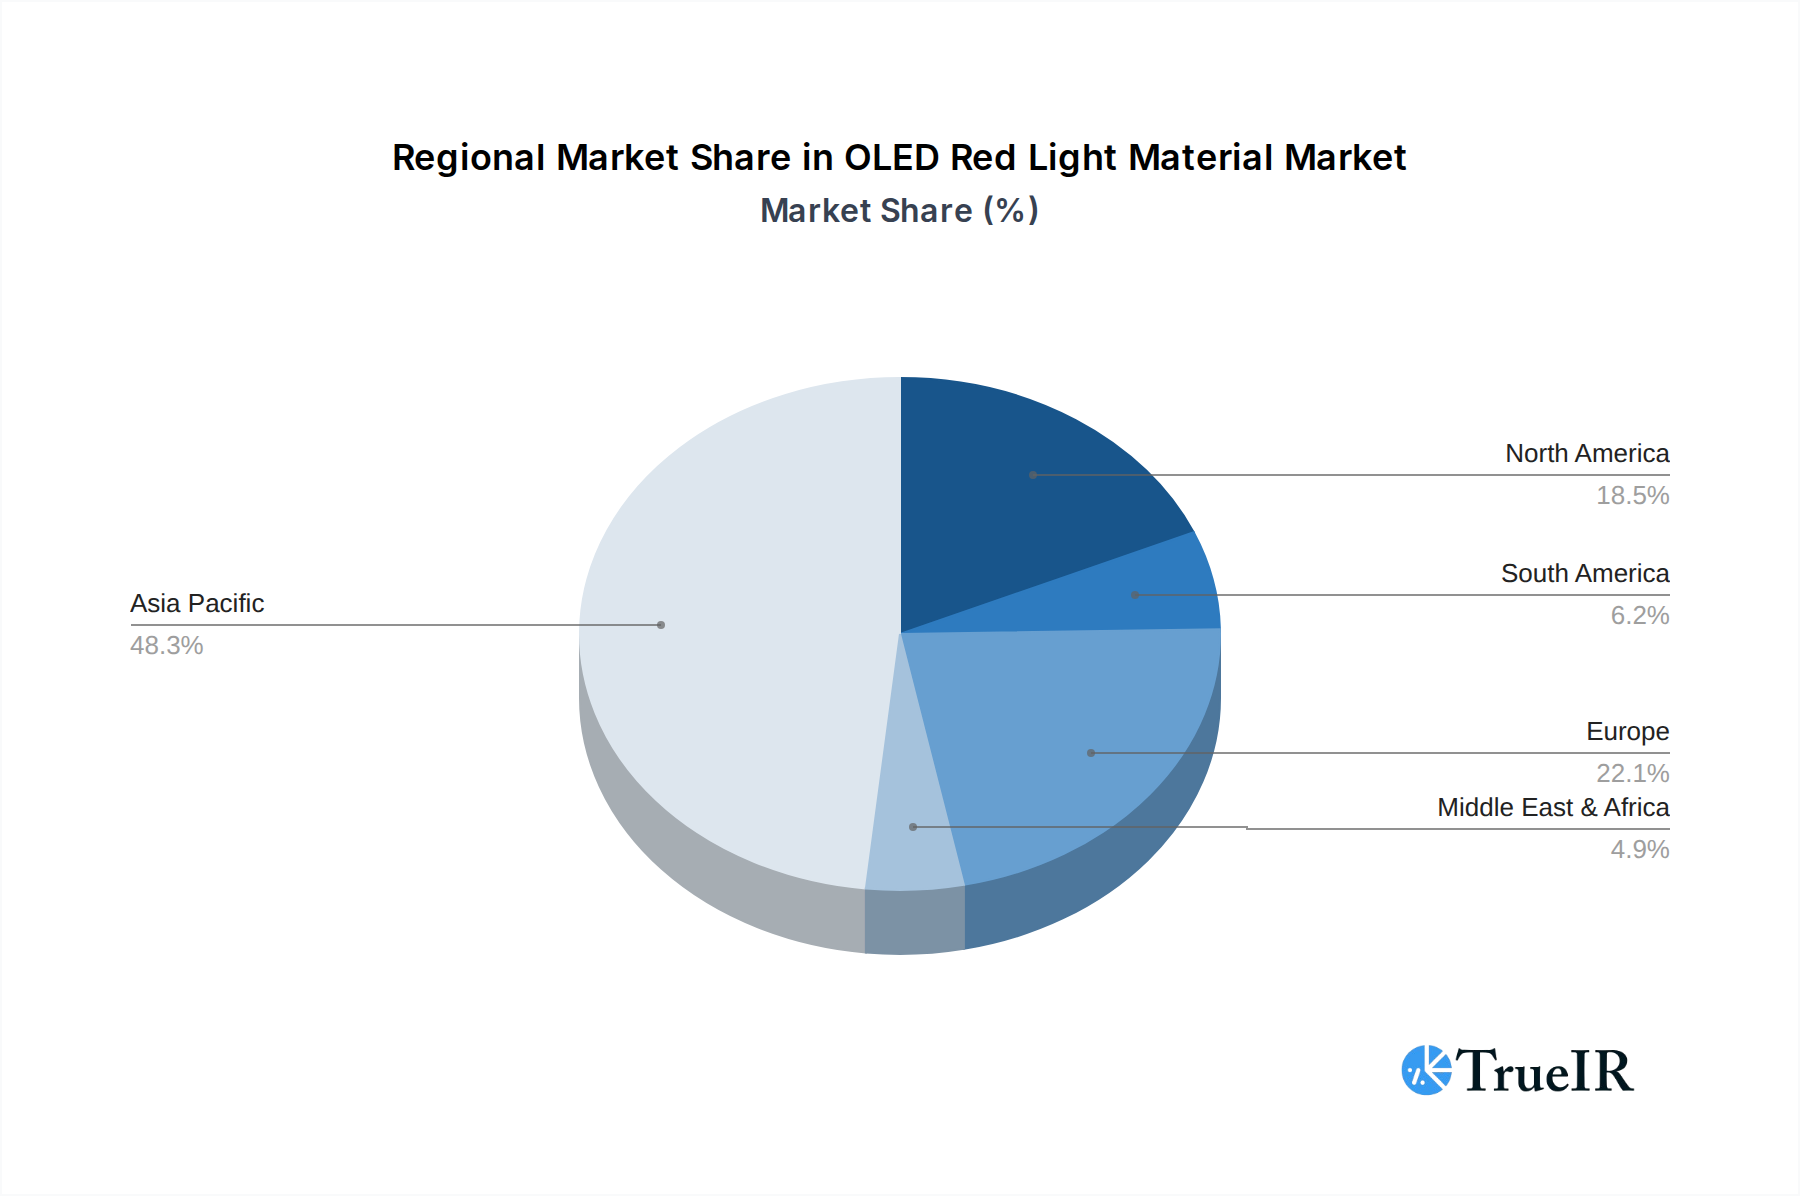
OLED Red Light Material Regional Market Share
Geographic Coverage of OLED Red Light Material
OLED Red Light Material REPORT HIGHLIGHTS
| Aspects | Details |
|---|---|
| Study Period | 2020-2034 |
| Base Year | 2025 |
| Estimated Year | 2026 |
| Forecast Period | 2026-2034 |
| Historical Period | 2020-2025 |
| Growth Rate | CAGR of 18% from 2020-2034 |
| Segmentation |
|
Table of Contents
- 1. Introduction
- 1.1. Research Scope
- 1.2. Market Segmentation
- 1.3. Research Methodology
- 1.4. Definitions and Assumptions
- 2. Executive Summary
- 2.1. Introduction
- 3. Market Dynamics
- 3.1. Introduction
- 3.2. Market Drivers
- 3.3. Market Restrains
- 3.4. Market Trends
- 4. Market Factor Analysis
- 4.1. Porters Five Forces
- 4.2. Supply/Value Chain
- 4.3. PESTEL analysis
- 4.4. Market Entropy
- 4.5. Patent/Trademark Analysis
- 5. Global OLED Red Light Material Analysis, Insights and Forecast, 2020-2032
- 5.1. Market Analysis, Insights and Forecast - by Application
- 5.1.1. Smart Phone
- 5.1.2. OLED TV
- 5.1.3. Other
- 5.2. Market Analysis, Insights and Forecast - by Types
- 5.2.1. Red Light Main Material
- 5.2.2. Red Light Object Material
- 5.3. Market Analysis, Insights and Forecast - by Region
- 5.3.1. North America
- 5.3.2. South America
- 5.3.3. Europe
- 5.3.4. Middle East & Africa
- 5.3.5. Asia Pacific
- 5.1. Market Analysis, Insights and Forecast - by Application
- 6. North America OLED Red Light Material Analysis, Insights and Forecast, 2020-2032
- 6.1. Market Analysis, Insights and Forecast - by Application
- 6.1.1. Smart Phone
- 6.1.2. OLED TV
- 6.1.3. Other
- 6.2. Market Analysis, Insights and Forecast - by Types
- 6.2.1. Red Light Main Material
- 6.2.2. Red Light Object Material
- 6.1. Market Analysis, Insights and Forecast - by Application
- 7. South America OLED Red Light Material Analysis, Insights and Forecast, 2020-2032
- 7.1. Market Analysis, Insights and Forecast - by Application
- 7.1.1. Smart Phone
- 7.1.2. OLED TV
- 7.1.3. Other
- 7.2. Market Analysis, Insights and Forecast - by Types
- 7.2.1. Red Light Main Material
- 7.2.2. Red Light Object Material
- 7.1. Market Analysis, Insights and Forecast - by Application
- 8. Europe OLED Red Light Material Analysis, Insights and Forecast, 2020-2032
- 8.1. Market Analysis, Insights and Forecast - by Application
- 8.1.1. Smart Phone
- 8.1.2. OLED TV
- 8.1.3. Other
- 8.2. Market Analysis, Insights and Forecast - by Types
- 8.2.1. Red Light Main Material
- 8.2.2. Red Light Object Material
- 8.1. Market Analysis, Insights and Forecast - by Application
- 9. Middle East & Africa OLED Red Light Material Analysis, Insights and Forecast, 2020-2032
- 9.1. Market Analysis, Insights and Forecast - by Application
- 9.1.1. Smart Phone
- 9.1.2. OLED TV
- 9.1.3. Other
- 9.2. Market Analysis, Insights and Forecast - by Types
- 9.2.1. Red Light Main Material
- 9.2.2. Red Light Object Material
- 9.1. Market Analysis, Insights and Forecast - by Application
- 10. Asia Pacific OLED Red Light Material Analysis, Insights and Forecast, 2020-2032
- 10.1. Market Analysis, Insights and Forecast - by Application
- 10.1.1. Smart Phone
- 10.1.2. OLED TV
- 10.1.3. Other
- 10.2. Market Analysis, Insights and Forecast - by Types
- 10.2.1. Red Light Main Material
- 10.2.2. Red Light Object Material
- 10.1. Market Analysis, Insights and Forecast - by Application
- 11. Competitive Analysis
- 11.1. Global Market Share Analysis 2025
- 11.2. Company Profiles
- 11.2.1 UDC
- 11.2.1.1. Overview
- 11.2.1.2. Products
- 11.2.1.3. SWOT Analysis
- 11.2.1.4. Recent Developments
- 11.2.1.5. Financials (Based on Availability)
- 11.2.2 DOW
- 11.2.2.1. Overview
- 11.2.2.2. Products
- 11.2.2.3. SWOT Analysis
- 11.2.2.4. Recent Developments
- 11.2.2.5. Financials (Based on Availability)
- 11.2.3 Sumitomo Chemical
- 11.2.3.1. Overview
- 11.2.3.2. Products
- 11.2.3.3. SWOT Analysis
- 11.2.3.4. Recent Developments
- 11.2.3.5. Financials (Based on Availability)
- 11.2.4 TORAY
- 11.2.4.1. Overview
- 11.2.4.2. Products
- 11.2.4.3. SWOT Analysis
- 11.2.4.4. Recent Developments
- 11.2.4.5. Financials (Based on Availability)
- 11.2.5 Merck
- 11.2.5.1. Overview
- 11.2.5.2. Products
- 11.2.5.3. SWOT Analysis
- 11.2.5.4. Recent Developments
- 11.2.5.5. Financials (Based on Availability)
- 11.2.6 LG Chemical
- 11.2.6.1. Overview
- 11.2.6.2. Products
- 11.2.6.3. SWOT Analysis
- 11.2.6.4. Recent Developments
- 11.2.6.5. Financials (Based on Availability)
- 11.2.1 UDC
List of Figures
- Figure 1: Global OLED Red Light Material Revenue Breakdown (undefined, %) by Region 2025 & 2033
- Figure 2: North America OLED Red Light Material Revenue (undefined), by Application 2025 & 2033
- Figure 3: North America OLED Red Light Material Revenue Share (%), by Application 2025 & 2033
- Figure 4: North America OLED Red Light Material Revenue (undefined), by Types 2025 & 2033
- Figure 5: North America OLED Red Light Material Revenue Share (%), by Types 2025 & 2033
- Figure 6: North America OLED Red Light Material Revenue (undefined), by Country 2025 & 2033
- Figure 7: North America OLED Red Light Material Revenue Share (%), by Country 2025 & 2033
- Figure 8: South America OLED Red Light Material Revenue (undefined), by Application 2025 & 2033
- Figure 9: South America OLED Red Light Material Revenue Share (%), by Application 2025 & 2033
- Figure 10: South America OLED Red Light Material Revenue (undefined), by Types 2025 & 2033
- Figure 11: South America OLED Red Light Material Revenue Share (%), by Types 2025 & 2033
- Figure 12: South America OLED Red Light Material Revenue (undefined), by Country 2025 & 2033
- Figure 13: South America OLED Red Light Material Revenue Share (%), by Country 2025 & 2033
- Figure 14: Europe OLED Red Light Material Revenue (undefined), by Application 2025 & 2033
- Figure 15: Europe OLED Red Light Material Revenue Share (%), by Application 2025 & 2033
- Figure 16: Europe OLED Red Light Material Revenue (undefined), by Types 2025 & 2033
- Figure 17: Europe OLED Red Light Material Revenue Share (%), by Types 2025 & 2033
- Figure 18: Europe OLED Red Light Material Revenue (undefined), by Country 2025 & 2033
- Figure 19: Europe OLED Red Light Material Revenue Share (%), by Country 2025 & 2033
- Figure 20: Middle East & Africa OLED Red Light Material Revenue (undefined), by Application 2025 & 2033
- Figure 21: Middle East & Africa OLED Red Light Material Revenue Share (%), by Application 2025 & 2033
- Figure 22: Middle East & Africa OLED Red Light Material Revenue (undefined), by Types 2025 & 2033
- Figure 23: Middle East & Africa OLED Red Light Material Revenue Share (%), by Types 2025 & 2033
- Figure 24: Middle East & Africa OLED Red Light Material Revenue (undefined), by Country 2025 & 2033
- Figure 25: Middle East & Africa OLED Red Light Material Revenue Share (%), by Country 2025 & 2033
- Figure 26: Asia Pacific OLED Red Light Material Revenue (undefined), by Application 2025 & 2033
- Figure 27: Asia Pacific OLED Red Light Material Revenue Share (%), by Application 2025 & 2033
- Figure 28: Asia Pacific OLED Red Light Material Revenue (undefined), by Types 2025 & 2033
- Figure 29: Asia Pacific OLED Red Light Material Revenue Share (%), by Types 2025 & 2033
- Figure 30: Asia Pacific OLED Red Light Material Revenue (undefined), by Country 2025 & 2033
- Figure 31: Asia Pacific OLED Red Light Material Revenue Share (%), by Country 2025 & 2033
List of Tables
- Table 1: Global OLED Red Light Material Revenue undefined Forecast, by Application 2020 & 2033
- Table 2: Global OLED Red Light Material Revenue undefined Forecast, by Types 2020 & 2033
- Table 3: Global OLED Red Light Material Revenue undefined Forecast, by Region 2020 & 2033
- Table 4: Global OLED Red Light Material Revenue undefined Forecast, by Application 2020 & 2033
- Table 5: Global OLED Red Light Material Revenue undefined Forecast, by Types 2020 & 2033
- Table 6: Global OLED Red Light Material Revenue undefined Forecast, by Country 2020 & 2033
- Table 7: United States OLED Red Light Material Revenue (undefined) Forecast, by Application 2020 & 2033
- Table 8: Canada OLED Red Light Material Revenue (undefined) Forecast, by Application 2020 & 2033
- Table 9: Mexico OLED Red Light Material Revenue (undefined) Forecast, by Application 2020 & 2033
- Table 10: Global OLED Red Light Material Revenue undefined Forecast, by Application 2020 & 2033
- Table 11: Global OLED Red Light Material Revenue undefined Forecast, by Types 2020 & 2033
- Table 12: Global OLED Red Light Material Revenue undefined Forecast, by Country 2020 & 2033
- Table 13: Brazil OLED Red Light Material Revenue (undefined) Forecast, by Application 2020 & 2033
- Table 14: Argentina OLED Red Light Material Revenue (undefined) Forecast, by Application 2020 & 2033
- Table 15: Rest of South America OLED Red Light Material Revenue (undefined) Forecast, by Application 2020 & 2033
- Table 16: Global OLED Red Light Material Revenue undefined Forecast, by Application 2020 & 2033
- Table 17: Global OLED Red Light Material Revenue undefined Forecast, by Types 2020 & 2033
- Table 18: Global OLED Red Light Material Revenue undefined Forecast, by Country 2020 & 2033
- Table 19: United Kingdom OLED Red Light Material Revenue (undefined) Forecast, by Application 2020 & 2033
- Table 20: Germany OLED Red Light Material Revenue (undefined) Forecast, by Application 2020 & 2033
- Table 21: France OLED Red Light Material Revenue (undefined) Forecast, by Application 2020 & 2033
- Table 22: Italy OLED Red Light Material Revenue (undefined) Forecast, by Application 2020 & 2033
- Table 23: Spain OLED Red Light Material Revenue (undefined) Forecast, by Application 2020 & 2033
- Table 24: Russia OLED Red Light Material Revenue (undefined) Forecast, by Application 2020 & 2033
- Table 25: Benelux OLED Red Light Material Revenue (undefined) Forecast, by Application 2020 & 2033
- Table 26: Nordics OLED Red Light Material Revenue (undefined) Forecast, by Application 2020 & 2033
- Table 27: Rest of Europe OLED Red Light Material Revenue (undefined) Forecast, by Application 2020 & 2033
- Table 28: Global OLED Red Light Material Revenue undefined Forecast, by Application 2020 & 2033
- Table 29: Global OLED Red Light Material Revenue undefined Forecast, by Types 2020 & 2033
- Table 30: Global OLED Red Light Material Revenue undefined Forecast, by Country 2020 & 2033
- Table 31: Turkey OLED Red Light Material Revenue (undefined) Forecast, by Application 2020 & 2033
- Table 32: Israel OLED Red Light Material Revenue (undefined) Forecast, by Application 2020 & 2033
- Table 33: GCC OLED Red Light Material Revenue (undefined) Forecast, by Application 2020 & 2033
- Table 34: North Africa OLED Red Light Material Revenue (undefined) Forecast, by Application 2020 & 2033
- Table 35: South Africa OLED Red Light Material Revenue (undefined) Forecast, by Application 2020 & 2033
- Table 36: Rest of Middle East & Africa OLED Red Light Material Revenue (undefined) Forecast, by Application 2020 & 2033
- Table 37: Global OLED Red Light Material Revenue undefined Forecast, by Application 2020 & 2033
- Table 38: Global OLED Red Light Material Revenue undefined Forecast, by Types 2020 & 2033
- Table 39: Global OLED Red Light Material Revenue undefined Forecast, by Country 2020 & 2033
- Table 40: China OLED Red Light Material Revenue (undefined) Forecast, by Application 2020 & 2033
- Table 41: India OLED Red Light Material Revenue (undefined) Forecast, by Application 2020 & 2033
- Table 42: Japan OLED Red Light Material Revenue (undefined) Forecast, by Application 2020 & 2033
- Table 43: South Korea OLED Red Light Material Revenue (undefined) Forecast, by Application 2020 & 2033
- Table 44: ASEAN OLED Red Light Material Revenue (undefined) Forecast, by Application 2020 & 2033
- Table 45: Oceania OLED Red Light Material Revenue (undefined) Forecast, by Application 2020 & 2033
- Table 46: Rest of Asia Pacific OLED Red Light Material Revenue (undefined) Forecast, by Application 2020 & 2033
Frequently Asked Questions
1. What is the projected Compound Annual Growth Rate (CAGR) of the OLED Red Light Material?
The projected CAGR is approximately 18%.
2. Which companies are prominent players in the OLED Red Light Material?
Key companies in the market include UDC, DOW, Sumitomo Chemical, TORAY, Merck, LG Chemical.
3. What are the main segments of the OLED Red Light Material?
The market segments include Application, Types.
4. Can you provide details about the market size?
The market size is estimated to be USD XXX N/A as of 2022.
5. What are some drivers contributing to market growth?
N/A
6. What are the notable trends driving market growth?
N/A
7. Are there any restraints impacting market growth?
N/A
8. Can you provide examples of recent developments in the market?
N/A
9. What pricing options are available for accessing the report?
Pricing options include single-user, multi-user, and enterprise licenses priced at USD 4900.00, USD 7350.00, and USD 9800.00 respectively.
10. Is the market size provided in terms of value or volume?
The market size is provided in terms of value, measured in N/A.
11. Are there any specific market keywords associated with the report?
Yes, the market keyword associated with the report is "OLED Red Light Material," which aids in identifying and referencing the specific market segment covered.
12. How do I determine which pricing option suits my needs best?
The pricing options vary based on user requirements and access needs. Individual users may opt for single-user licenses, while businesses requiring broader access may choose multi-user or enterprise licenses for cost-effective access to the report.
13. Are there any additional resources or data provided in the OLED Red Light Material report?
While the report offers comprehensive insights, it's advisable to review the specific contents or supplementary materials provided to ascertain if additional resources or data are available.
14. How can I stay updated on further developments or reports in the OLED Red Light Material?
To stay informed about further developments, trends, and reports in the OLED Red Light Material, consider subscribing to industry newsletters, following relevant companies and organizations, or regularly checking reputable industry news sources and publications.
Methodology
Step 1 - Identification of Relevant Samples Size from Population Database


Step 2 - Approaches for Defining Global Market Size (Value, Volume* & Price*)

Note*: In applicable scenarios
Step 3 - Data Sources
Primary Research
- Web Analytics
- Survey Reports
- Research Institute
- Latest Research Reports
- Opinion Leaders
Secondary Research
- Annual Reports
- White Paper
- Latest Press Release
- Industry Association
- Paid Database
- Investor Presentations

Step 4 - Data Triangulation
Involves using different sources of information in order to increase the validity of a study
These sources are likely to be stakeholders in a program - participants, other researchers, program staff, other community members, and so on.
Then we put all data in single framework & apply various statistical tools to find out the dynamic on the market.
During the analysis stage, feedback from the stakeholder groups would be compared to determine areas of agreement as well as areas of divergence