

Key Insights
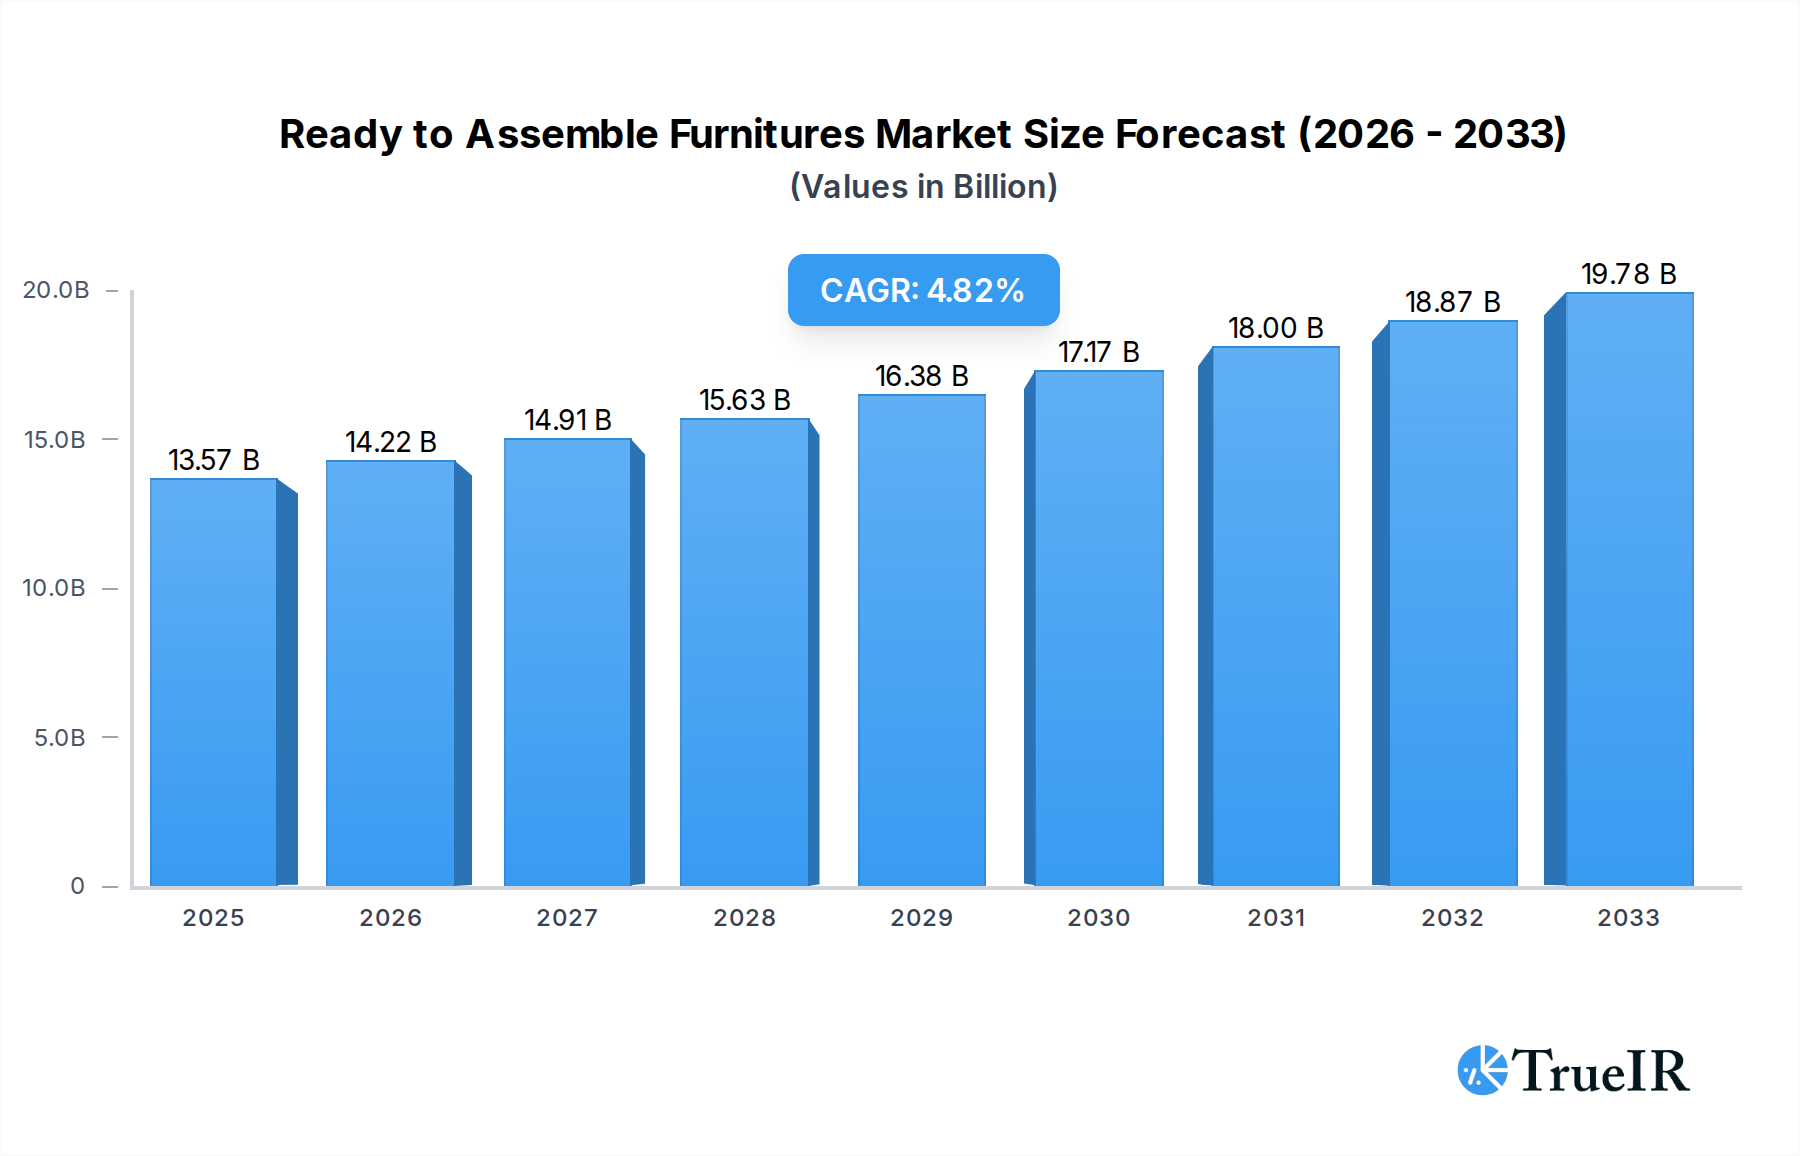
The Ready-to-Assemble (RTA) furniture market is poised for robust growth, projected to reach $13,570 million by 2025, demonstrating a significant market presence. This expansion is underpinned by a Compound Annual Growth Rate (CAGR) of 4.8% from 2019 to 2033, indicating sustained momentum driven by evolving consumer preferences and market dynamics. Key growth drivers include the increasing demand for affordable and stylish home furnishings, particularly among younger demographics and apartment dwellers who prioritize space-saving and cost-effective solutions. The rise of e-commerce platforms has also been instrumental, providing wider accessibility and convenience for consumers to purchase RTA furniture online. Furthermore, the growing emphasis on DIY culture and the inherent ease of assembly associated with RTA products contribute significantly to their popularity. The market is segmenting into Office RTA Furniture and Residential RTA Furniture, with distinct growth trajectories influenced by the resurgence of hybrid work models and the ongoing need for comfortable and functional home office setups.

Ready to Assemble Furnitures Market Size (In Billion)
The RTA furniture market is characterized by a dynamic landscape influenced by several key trends and challenges. While the convenience and affordability of RTA furniture remain strong selling points, market participants are increasingly focusing on product innovation, offering more sophisticated designs, enhanced durability, and improved assembly instructions to cater to a broader consumer base. The "Others (Online)" segment for applications is expected to witness substantial growth, reflecting the dominance of online retail channels in furniture sales. However, potential restraints such as perceived lower quality compared to assembled furniture and the logistical challenges associated with shipping bulky items are areas that manufacturers and retailers are actively addressing. Leading companies like IKEA, Dorel Industries, and Sauder Woodworking are at the forefront of this market, continuously innovating and expanding their product portfolios to capture market share. Geographically, North America and Europe are anticipated to remain dominant regions, driven by established consumer bases and strong online retail infrastructure, while the Asia Pacific region presents a significant growth opportunity due to its burgeoning middle class and increasing urbanization.
Ready to Assemble Furnitures Company Market Share
Ready to Assemble Furnitures Market Structure & Competitive Landscape
The Ready to Assemble (RTA) furniture market is characterized by a moderate to high level of market concentration, with a few dominant players like IKEA, Sauder Woodworking, and Dorel Industries holding significant market shares, estimated to be over 60% of the global RTA furniture market value in the base year 2025. Innovation remains a key driver, fueled by the demand for cost-effective, space-saving, and easily customizable furniture solutions. Regulatory impacts, while not as pronounced as in other sectors, primarily revolve around material sourcing, sustainability standards, and import/export regulations, influencing production costs and market access for companies like Bush Industries and Whalen Furniture. Product substitutes, such as fully assembled furniture and DIY furniture kits, pose a constant competitive threat, necessitating continuous product development and enhanced value propositions from companies like Prepac and South Shore. End-user segmentation reveals a growing preference for Residential RTA Furniture, accounting for approximately 75% of the market, driven by millennial and Gen Z consumers. The Others (Online) segment is experiencing rapid growth, projected to capture over 30% of sales by 2033. Mergers and acquisitions (M&A) activity has been relatively subdued, with an estimated average of 2-3 significant deals annually within the study period, primarily focused on expanding geographical reach and acquiring specialized manufacturing capabilities by players such as Flexsteel (Home Styles) and Homestar North America.
Ready to Assemble Furnitures Market Trends & Opportunities
The global Ready to Assemble (RTA) furniture market is poised for substantial expansion, with an estimated market size projected to reach over $100 million by 2033, exhibiting a Compound Annual Growth Rate (CAGR) of approximately 5.5% during the forecast period of 2025–2033. This robust growth is underpinned by a confluence of evolving consumer preferences, technological advancements, and a dynamic competitive landscape. A significant trend is the increasing demand for eco-friendly and sustainable RTA furniture. Consumers are actively seeking products made from recycled materials, responsibly sourced wood, and those with lower carbon footprints. This shift presents a significant opportunity for manufacturers to innovate in material sourcing and production processes, appealing to a more environmentally conscious demographic. Furthermore, the proliferation of e-commerce platforms and direct-to-consumer (DTC) models has revolutionized the distribution channels for RTA furniture. Online sales are expected to surge, surpassing 35% market penetration by 2030, creating immense opportunities for companies that can effectively leverage digital marketing, efficient logistics, and compelling online product presentations. The "work from home" phenomenon, which gained momentum during the historical period (2019–2024), continues to influence consumer purchasing decisions, driving demand for functional and space-saving Office RTA Furniture. This segment is expected to witness a CAGR of over 6% in the coming years. Technological innovations are also playing a crucial role. The integration of augmented reality (AR) and virtual reality (VR) in online platforms allows consumers to visualize furniture in their own spaces, enhancing the online shopping experience and reducing return rates. Advanced manufacturing techniques, such as automated assembly processes and 3D printing for custom components, are improving efficiency and product customization. The competitive dynamics are intensifying, with both established players and emerging online retailers vying for market share. Companies like IKEA, with its strong brand recognition and extensive product range, continue to dominate, but nimble online retailers are gaining traction by offering niche products and superior customer service. The increasing affordability of RTA furniture, compared to fully assembled counterparts, continues to be a primary growth catalyst, especially among budget-conscious consumers and those living in smaller urban dwellings. Opportunities also lie in the development of modular RTA furniture systems that can be easily reconfigured to adapt to changing living spaces and needs. The market penetration rate for RTA furniture, currently estimated at around 40% of the total furniture market in the base year 2025, is expected to climb steadily as consumer acceptance and convenience factors continue to rise.
Dominant Markets & Segments in Ready to Assemble Furnitures
The Residential RTA Furniture segment is unequivocally the dominant force within the Ready to Assemble (RTA) furniture market, capturing an estimated market share of over 75% in the base year 2025. This dominance is driven by a confluence of factors including evolving housing trends, increasing urbanization, and the growing preference for cost-effective home furnishing solutions among a broad demographic. Key growth drivers within this segment include:
- Millennial and Gen Z Homeownership: Younger generations, often facing affordability challenges and smaller living spaces, are increasingly opting for RTA furniture due to its accessibility and adaptability.
- Rental Market Growth: The expansion of the rental market, particularly in urban areas, fuels demand for furniture that is easy to assemble, disassemble, and move.
- Interior Design Trends: The rise of minimalist and functional interior design aesthetics aligns perfectly with the practical and space-saving nature of RTA furniture.
Geographically, North America is projected to remain the leading market for RTA furniture, accounting for approximately 35% of the global market revenue in 2025. This leadership is attributed to several factors:
- Established Retail Infrastructure: The presence of large furniture retailers and a well-developed e-commerce ecosystem facilitate easy access to RTA furniture.
- Consumer Affordability and Preference: A significant portion of the North American population prioritizes value for money and is accustomed to assembling their own furniture.
- Housing Market Dynamics: The ongoing demand for single-family homes and apartments, coupled with smaller average dwelling sizes, supports the adoption of RTA solutions.
Within the Application segmentation, Others (Online) is emerging as a critical growth driver, projected to see a CAGR of over 7% during the forecast period. This surge is driven by:
- E-commerce Proliferation: The convenience and wide selection offered by online platforms are increasingly appealing to consumers.
- Direct-to-Consumer (DTC) Models: Brands are leveraging DTC strategies to bypass traditional retail markups and connect directly with customers.
- Digital Marketing Effectiveness: Targeted online advertising and social media engagement are proving highly effective in reaching RTA furniture consumers.
Conversely, Office RTA Furniture holds a significant, albeit smaller, segment share, expected to represent around 20% of the market in 2025. Its growth is fueled by the sustained trend of remote and hybrid work arrangements, leading to increased investment in home office setups. Independent Specialist Retailers and Independent Furniture Chains continue to play a vital role in distribution, though their market share is gradually being influenced by the rapid expansion of online channels.
Ready to Assemble Furnitures Product Analysis
The RTA furniture market is witnessing a surge in product innovations focused on enhancing user experience, sustainability, and modularity. Advancements in material science are leading to lighter yet more durable components, simplifying assembly and increasing product longevity. Smart furniture, incorporating integrated charging ports and adjustable features, is gaining traction. Competitive advantages are increasingly derived from intuitive assembly instructions, robust packaging, and a wider array of customization options. The focus on sleek, modern designs that blend seamlessly with various interior aesthetics is a key differentiator for companies like South Shore and Prepac, ensuring market fit and consumer appeal.
Key Drivers, Barriers & Challenges in Ready to Assemble Furnitures
Key Drivers: The RTA furniture market is propelled by several key drivers. Technologically, advancements in online visualization tools (AR/VR) and efficient manufacturing processes reduce production costs and enhance customer engagement. Economically, the affordability of RTA furniture compared to its assembled counterparts, coupled with rising disposable incomes in emerging economies, fuels demand. Policy-driven factors, such as government initiatives promoting sustainable sourcing and affordable housing, indirectly benefit the RTA sector by encouraging efficient and cost-effective furnishing solutions. The growing preference for DIY projects and personalized living spaces also acts as a significant impetus.
Key Barriers & Challenges: Despite positive growth, the RTA furniture market faces several challenges. Supply chain disruptions, as evidenced in recent global events, can impact material availability and lead times, affecting companies like Dorel Industries. Regulatory hurdles related to import/export tariffs and environmental standards can increase operational complexities. Competitive pressures from both established brands like IKEA and a growing number of niche online retailers necessitate continuous innovation and aggressive pricing strategies. Consumer perception regarding the durability and perceived lower quality of RTA furniture remains a challenge, though this is being mitigated by product improvements. Furthermore, the complexity of assembly for some products can lead to negative customer experiences, impacting brand reputation.
Growth Drivers in the Ready to Assemble Furnitures Market
The Ready to Assemble (RTA) furniture market is experiencing robust growth driven by a confluence of technological, economic, and societal factors. Technologically, advancements in design software and 3D printing enable faster product development and customization. Economically, the inherent affordability of RTA furniture, coupled with increasing consumer awareness of its value proposition, makes it an attractive option for a wide demographic. Regulatory frameworks promoting sustainable forestry and recycled materials are also influencing product development, appealing to eco-conscious consumers. The widespread adoption of e-commerce platforms and the rise of direct-to-consumer (DTC) models are further accelerating growth by expanding market reach and reducing distribution costs. The increasing trend of smaller living spaces in urban environments also makes RTA furniture, with its space-saving and modular designs, a highly desirable choice.
Challenges Impacting Ready to Assemble Furnitures Growth
The expansion of the Ready to Assemble (RTA) furniture market is not without its obstacles. Regulatory complexities, particularly concerning international trade agreements and varying import duties, can impact profitability and market access for manufacturers like Bush Industries. Persistent supply chain issues, including volatile shipping costs and material shortages, continue to pose significant challenges, potentially leading to delays and increased production expenses for companies like Sauder Woodworking. Intense competitive pressures from both established giants and agile e-commerce players necessitate continuous innovation and aggressive pricing strategies to maintain market share. Furthermore, the perception of RTA furniture as being less durable or of lower quality than fully assembled items, while diminishing, can still act as a barrier for some consumers. Addressing these challenges effectively will be crucial for sustained market growth.
Key Players Shaping the Ready to Assemble Furnitures Market
- IKEA
- Sauder Woodworking
- Dorel Industries
- Bush Industries
- Whalen Furniture
- Homestar North America
- Flexsteel (Home Styles)
- Simplicity Sofas
- Prepac
- South Shore
Significant Ready to Assemble Furnitures Industry Milestones
- 2020: Widespread adoption of remote work accelerates demand for home office RTA furniture.
- 2021: Increased focus on sustainable and eco-friendly materials in RTA furniture production.
- 2022: Expansion of AR/VR visualization tools by major online retailers enhances customer online shopping experience.
- 2023: Growing trend of modular and customizable RTA furniture solutions catering to diverse consumer needs.
- 2024: Significant investment in e-commerce infrastructure and DTC strategies by RTA furniture manufacturers.
- 2025 (Projected): Continued strong growth in online RTA furniture sales and further integration of smart technology in RTA products.
Future Outlook for Ready to Assemble Furnitures Market
The future outlook for the Ready to Assemble (RTA) furniture market is exceptionally bright, driven by persistent consumer demand for affordability, functionality, and convenience. Strategic opportunities lie in further leveraging digital channels, enhancing the online customer journey with immersive technologies like AR and VR, and expanding product lines to cater to emerging lifestyle trends. The ongoing shift towards sustainability will necessitate continued innovation in material sourcing and manufacturing processes. As urbanization continues and living spaces remain compact, RTA furniture's inherent space-saving benefits will ensure its enduring appeal, positioning the market for sustained growth and evolution.
Ready to Assemble Furnitures Segmentation
-
1. Application
- 1.1. Independent Specialist Retailers
- 1.2. Independent Furniture Chains
- 1.3. Others (Online)
-
2. Types
- 2.1. Office RTA Furniture
- 2.2. Residential RTA Furniture
Ready to Assemble Furnitures Segmentation By Geography
-
1. North America
- 1.1. United States
- 1.2. Canada
- 1.3. Mexico
-
2. South America
- 2.1. Brazil
- 2.2. Argentina
- 2.3. Rest of South America
-
3. Europe
- 3.1. United Kingdom
- 3.2. Germany
- 3.3. France
- 3.4. Italy
- 3.5. Spain
- 3.6. Russia
- 3.7. Benelux
- 3.8. Nordics
- 3.9. Rest of Europe
-
4. Middle East & Africa
- 4.1. Turkey
- 4.2. Israel
- 4.3. GCC
- 4.4. North Africa
- 4.5. South Africa
- 4.6. Rest of Middle East & Africa
-
5. Asia Pacific
- 5.1. China
- 5.2. India
- 5.3. Japan
- 5.4. South Korea
- 5.5. ASEAN
- 5.6. Oceania
- 5.7. Rest of Asia Pacific
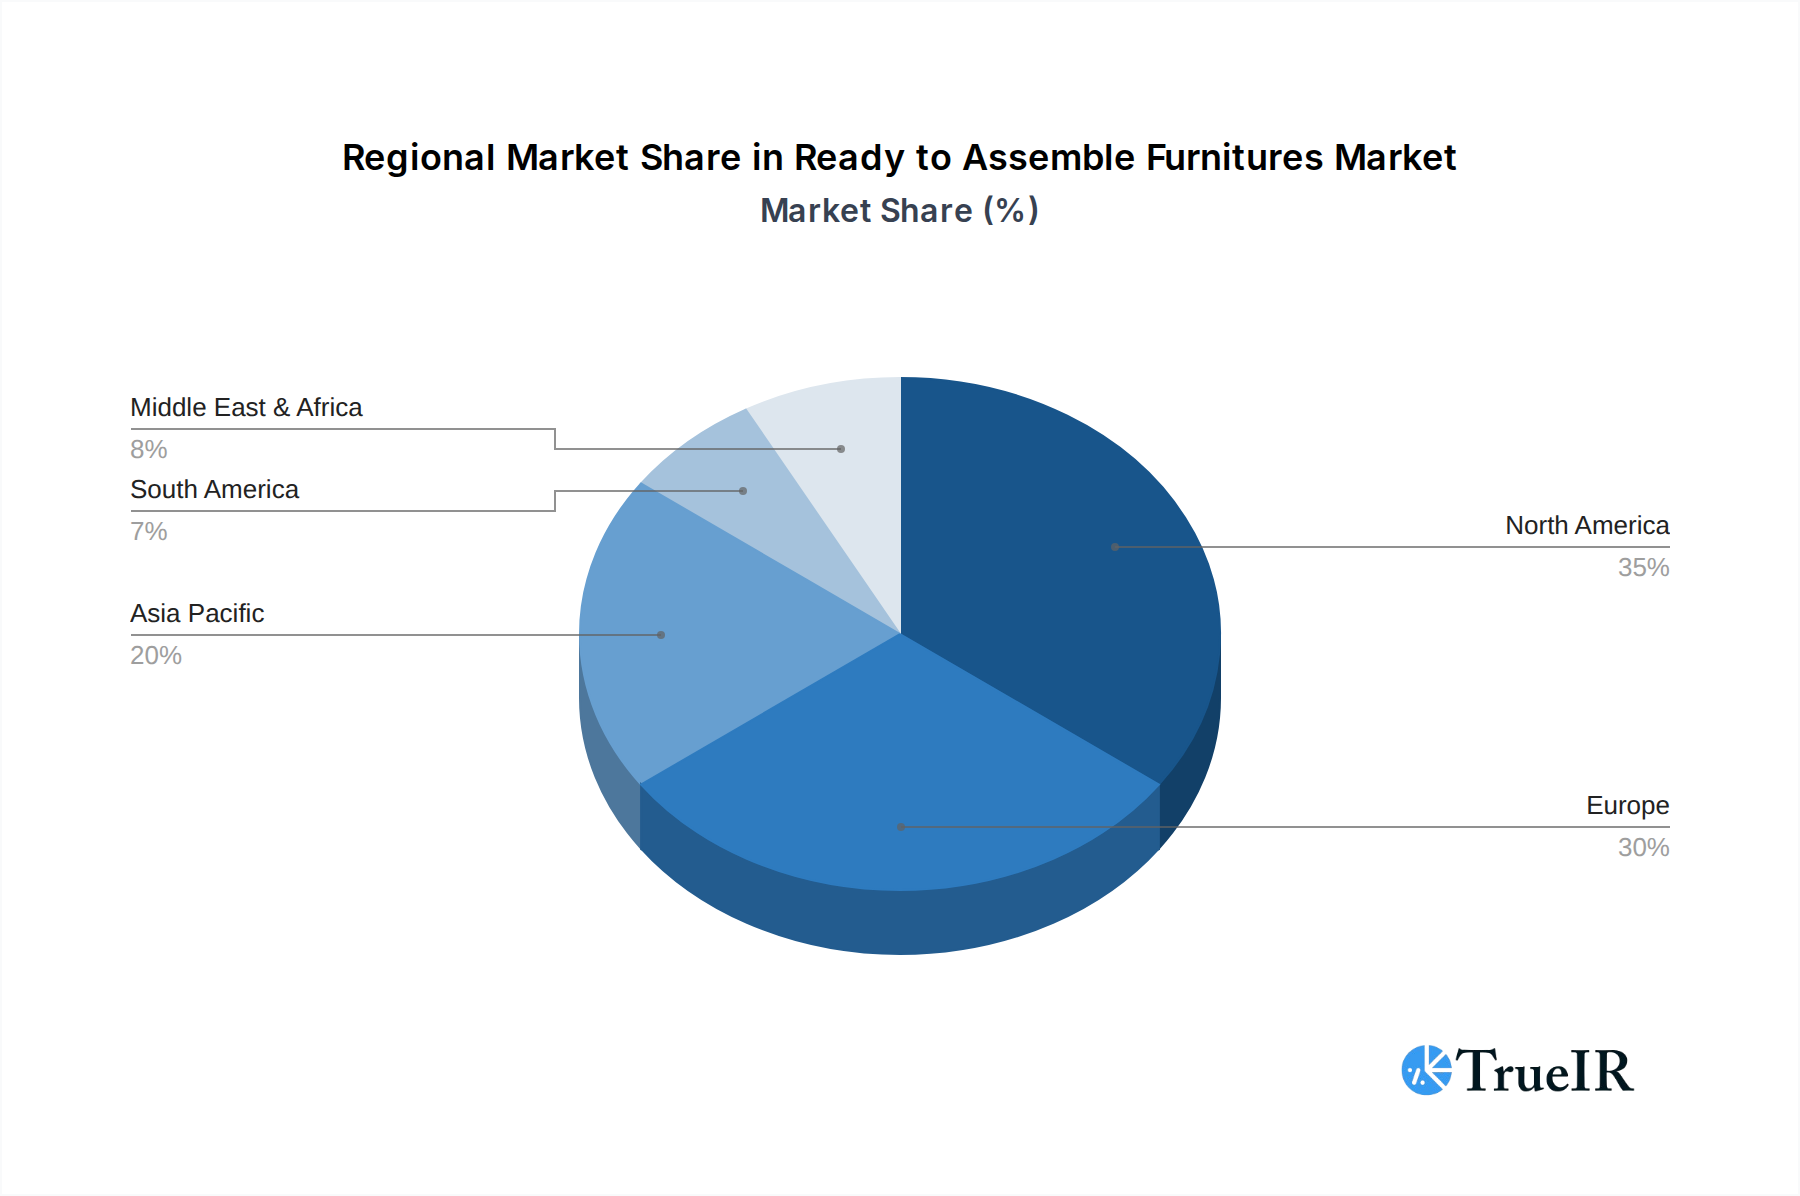
Ready to Assemble Furnitures Regional Market Share
Geographic Coverage of Ready to Assemble Furnitures
Ready to Assemble Furnitures REPORT HIGHLIGHTS
| Aspects | Details |
|---|---|
| Study Period | 2020-2034 |
| Base Year | 2025 |
| Estimated Year | 2026 |
| Forecast Period | 2026-2034 |
| Historical Period | 2020-2025 |
| Growth Rate | CAGR of 4.8% from 2020-2034 |
| Segmentation |
|
Table of Contents
- 1. Introduction
- 1.1. Research Scope
- 1.2. Market Segmentation
- 1.3. Research Objective
- 1.4. Definitions and Assumptions
- 2. Executive Summary
- 2.1. Market Snapshot
- 3. Market Dynamics
- 3.1. Market Drivers
- 3.2. Market Restrains
- 3.3. Market Trends
- 3.4. Market Opportunities
- 4. Market Factor Analysis
- 4.1. Porters Five Forces
- 4.1.1. Bargaining Power of Suppliers
- 4.1.2. Bargaining Power of Buyers
- 4.1.3. Threat of New Entrants
- 4.1.4. Threat of Substitutes
- 4.1.5. Competitive Rivalry
- 4.2. PESTEL analysis
- 4.3. BCG Analysis
- 4.3.1. Stars (High Growth, High Market Share)
- 4.3.2. Cash Cows (Low Growth, High Market Share)
- 4.3.3. Question Mark (High Growth, Low Market Share)
- 4.3.4. Dogs (Low Growth, Low Market Share)
- 4.4. Ansoff Matrix Analysis
- 4.5. Supply Chain Analysis
- 4.6. Regulatory Landscape
- 4.7. Current Market Potential and Opportunity Assessment (TAM–SAM–SOM Framework)
- 4.8. TIR Analyst Note
- 4.1. Porters Five Forces
- 5. Market Analysis, Insights and Forecast 2021-2033
- 5.1. Market Analysis, Insights and Forecast - by Application
- 5.1.1. Independent Specialist Retailers
- 5.1.2. Independent Furniture Chains
- 5.1.3. Others (Online)
- 5.2. Market Analysis, Insights and Forecast - by Types
- 5.2.1. Office RTA Furniture
- 5.2.2. Residential RTA Furniture
- 5.3. Market Analysis, Insights and Forecast - by Region
- 5.3.1. North America
- 5.3.2. South America
- 5.3.3. Europe
- 5.3.4. Middle East & Africa
- 5.3.5. Asia Pacific
- 5.1. Market Analysis, Insights and Forecast - by Application
- 6. Global Ready to Assemble Furnitures Analysis, Insights and Forecast, 2021-2033
- 6.1. Market Analysis, Insights and Forecast - by Application
- 6.1.1. Independent Specialist Retailers
- 6.1.2. Independent Furniture Chains
- 6.1.3. Others (Online)
- 6.2. Market Analysis, Insights and Forecast - by Types
- 6.2.1. Office RTA Furniture
- 6.2.2. Residential RTA Furniture
- 6.1. Market Analysis, Insights and Forecast - by Application
- 7. North America Ready to Assemble Furnitures Analysis, Insights and Forecast, 2020-2032
- 7.1. Market Analysis, Insights and Forecast - by Application
- 7.1.1. Independent Specialist Retailers
- 7.1.2. Independent Furniture Chains
- 7.1.3. Others (Online)
- 7.2. Market Analysis, Insights and Forecast - by Types
- 7.2.1. Office RTA Furniture
- 7.2.2. Residential RTA Furniture
- 7.1. Market Analysis, Insights and Forecast - by Application
- 8. South America Ready to Assemble Furnitures Analysis, Insights and Forecast, 2020-2032
- 8.1. Market Analysis, Insights and Forecast - by Application
- 8.1.1. Independent Specialist Retailers
- 8.1.2. Independent Furniture Chains
- 8.1.3. Others (Online)
- 8.2. Market Analysis, Insights and Forecast - by Types
- 8.2.1. Office RTA Furniture
- 8.2.2. Residential RTA Furniture
- 8.1. Market Analysis, Insights and Forecast - by Application
- 9. Europe Ready to Assemble Furnitures Analysis, Insights and Forecast, 2020-2032
- 9.1. Market Analysis, Insights and Forecast - by Application
- 9.1.1. Independent Specialist Retailers
- 9.1.2. Independent Furniture Chains
- 9.1.3. Others (Online)
- 9.2. Market Analysis, Insights and Forecast - by Types
- 9.2.1. Office RTA Furniture
- 9.2.2. Residential RTA Furniture
- 9.1. Market Analysis, Insights and Forecast - by Application
- 10. Middle East & Africa Ready to Assemble Furnitures Analysis, Insights and Forecast, 2020-2032
- 10.1. Market Analysis, Insights and Forecast - by Application
- 10.1.1. Independent Specialist Retailers
- 10.1.2. Independent Furniture Chains
- 10.1.3. Others (Online)
- 10.2. Market Analysis, Insights and Forecast - by Types
- 10.2.1. Office RTA Furniture
- 10.2.2. Residential RTA Furniture
- 10.1. Market Analysis, Insights and Forecast - by Application
- 11. Asia Pacific Ready to Assemble Furnitures Analysis, Insights and Forecast, 2020-2032
- 11.1. Market Analysis, Insights and Forecast - by Application
- 11.1.1. Independent Specialist Retailers
- 11.1.2. Independent Furniture Chains
- 11.1.3. Others (Online)
- 11.2. Market Analysis, Insights and Forecast - by Types
- 11.2.1. Office RTA Furniture
- 11.2.2. Residential RTA Furniture
- 11.1. Market Analysis, Insights and Forecast - by Application
- 12. Competitive Analysis
- 12.1. Company Profiles
- 12.1.1 Sauder Woodworking
- 12.1.1.1. Company Overview
- 12.1.1.2. Products
- 12.1.1.3. Company Financials
- 12.1.1.4. SWOT Analysis
- 12.1.2 Dorel Industries
- 12.1.2.1. Company Overview
- 12.1.2.2. Products
- 12.1.2.3. Company Financials
- 12.1.2.4. SWOT Analysis
- 12.1.3 Bush Industries
- 12.1.3.1. Company Overview
- 12.1.3.2. Products
- 12.1.3.3. Company Financials
- 12.1.3.4. SWOT Analysis
- 12.1.4 Whalen Furniture
- 12.1.4.1. Company Overview
- 12.1.4.2. Products
- 12.1.4.3. Company Financials
- 12.1.4.4. SWOT Analysis
- 12.1.5 Homestar North America
- 12.1.5.1. Company Overview
- 12.1.5.2. Products
- 12.1.5.3. Company Financials
- 12.1.5.4. SWOT Analysis
- 12.1.6 IKEA
- 12.1.6.1. Company Overview
- 12.1.6.2. Products
- 12.1.6.3. Company Financials
- 12.1.6.4. SWOT Analysis
- 12.1.7 Flexsteel (Home Styles)
- 12.1.7.1. Company Overview
- 12.1.7.2. Products
- 12.1.7.3. Company Financials
- 12.1.7.4. SWOT Analysis
- 12.1.8 Simplicity Sofas
- 12.1.8.1. Company Overview
- 12.1.8.2. Products
- 12.1.8.3. Company Financials
- 12.1.8.4. SWOT Analysis
- 12.1.9 Prepac
- 12.1.9.1. Company Overview
- 12.1.9.2. Products
- 12.1.9.3. Company Financials
- 12.1.9.4. SWOT Analysis
- 12.1.10 South Shore
- 12.1.10.1. Company Overview
- 12.1.10.2. Products
- 12.1.10.3. Company Financials
- 12.1.10.4. SWOT Analysis
- 12.1.1 Sauder Woodworking
- 12.2. Market Entropy
- 12.2.1 Company's Key Areas Served
- 12.2.2 Recent Developments
- 12.3. Company Market Share Analysis 2025
- 12.3.1 Top 5 Companies Market Share Analysis
- 12.3.2 Top 3 Companies Market Share Analysis
- 12.4. List of Potential Customers
- 13. Research Methodology
List of Figures
- Figure 1: Global Ready to Assemble Furnitures Revenue Breakdown (undefined, %) by Region 2025 & 2033
- Figure 2: Global Ready to Assemble Furnitures Volume Breakdown (K, %) by Region 2025 & 2033
- Figure 3: North America Ready to Assemble Furnitures Revenue (undefined), by Application 2025 & 2033
- Figure 4: North America Ready to Assemble Furnitures Volume (K), by Application 2025 & 2033
- Figure 5: North America Ready to Assemble Furnitures Revenue Share (%), by Application 2025 & 2033
- Figure 6: North America Ready to Assemble Furnitures Volume Share (%), by Application 2025 & 2033
- Figure 7: North America Ready to Assemble Furnitures Revenue (undefined), by Types 2025 & 2033
- Figure 8: North America Ready to Assemble Furnitures Volume (K), by Types 2025 & 2033
- Figure 9: North America Ready to Assemble Furnitures Revenue Share (%), by Types 2025 & 2033
- Figure 10: North America Ready to Assemble Furnitures Volume Share (%), by Types 2025 & 2033
- Figure 11: North America Ready to Assemble Furnitures Revenue (undefined), by Country 2025 & 2033
- Figure 12: North America Ready to Assemble Furnitures Volume (K), by Country 2025 & 2033
- Figure 13: North America Ready to Assemble Furnitures Revenue Share (%), by Country 2025 & 2033
- Figure 14: North America Ready to Assemble Furnitures Volume Share (%), by Country 2025 & 2033
- Figure 15: South America Ready to Assemble Furnitures Revenue (undefined), by Application 2025 & 2033
- Figure 16: South America Ready to Assemble Furnitures Volume (K), by Application 2025 & 2033
- Figure 17: South America Ready to Assemble Furnitures Revenue Share (%), by Application 2025 & 2033
- Figure 18: South America Ready to Assemble Furnitures Volume Share (%), by Application 2025 & 2033
- Figure 19: South America Ready to Assemble Furnitures Revenue (undefined), by Types 2025 & 2033
- Figure 20: South America Ready to Assemble Furnitures Volume (K), by Types 2025 & 2033
- Figure 21: South America Ready to Assemble Furnitures Revenue Share (%), by Types 2025 & 2033
- Figure 22: South America Ready to Assemble Furnitures Volume Share (%), by Types 2025 & 2033
- Figure 23: South America Ready to Assemble Furnitures Revenue (undefined), by Country 2025 & 2033
- Figure 24: South America Ready to Assemble Furnitures Volume (K), by Country 2025 & 2033
- Figure 25: South America Ready to Assemble Furnitures Revenue Share (%), by Country 2025 & 2033
- Figure 26: South America Ready to Assemble Furnitures Volume Share (%), by Country 2025 & 2033
- Figure 27: Europe Ready to Assemble Furnitures Revenue (undefined), by Application 2025 & 2033
- Figure 28: Europe Ready to Assemble Furnitures Volume (K), by Application 2025 & 2033
- Figure 29: Europe Ready to Assemble Furnitures Revenue Share (%), by Application 2025 & 2033
- Figure 30: Europe Ready to Assemble Furnitures Volume Share (%), by Application 2025 & 2033
- Figure 31: Europe Ready to Assemble Furnitures Revenue (undefined), by Types 2025 & 2033
- Figure 32: Europe Ready to Assemble Furnitures Volume (K), by Types 2025 & 2033
- Figure 33: Europe Ready to Assemble Furnitures Revenue Share (%), by Types 2025 & 2033
- Figure 34: Europe Ready to Assemble Furnitures Volume Share (%), by Types 2025 & 2033
- Figure 35: Europe Ready to Assemble Furnitures Revenue (undefined), by Country 2025 & 2033
- Figure 36: Europe Ready to Assemble Furnitures Volume (K), by Country 2025 & 2033
- Figure 37: Europe Ready to Assemble Furnitures Revenue Share (%), by Country 2025 & 2033
- Figure 38: Europe Ready to Assemble Furnitures Volume Share (%), by Country 2025 & 2033
- Figure 39: Middle East & Africa Ready to Assemble Furnitures Revenue (undefined), by Application 2025 & 2033
- Figure 40: Middle East & Africa Ready to Assemble Furnitures Volume (K), by Application 2025 & 2033
- Figure 41: Middle East & Africa Ready to Assemble Furnitures Revenue Share (%), by Application 2025 & 2033
- Figure 42: Middle East & Africa Ready to Assemble Furnitures Volume Share (%), by Application 2025 & 2033
- Figure 43: Middle East & Africa Ready to Assemble Furnitures Revenue (undefined), by Types 2025 & 2033
- Figure 44: Middle East & Africa Ready to Assemble Furnitures Volume (K), by Types 2025 & 2033
- Figure 45: Middle East & Africa Ready to Assemble Furnitures Revenue Share (%), by Types 2025 & 2033
- Figure 46: Middle East & Africa Ready to Assemble Furnitures Volume Share (%), by Types 2025 & 2033
- Figure 47: Middle East & Africa Ready to Assemble Furnitures Revenue (undefined), by Country 2025 & 2033
- Figure 48: Middle East & Africa Ready to Assemble Furnitures Volume (K), by Country 2025 & 2033
- Figure 49: Middle East & Africa Ready to Assemble Furnitures Revenue Share (%), by Country 2025 & 2033
- Figure 50: Middle East & Africa Ready to Assemble Furnitures Volume Share (%), by Country 2025 & 2033
- Figure 51: Asia Pacific Ready to Assemble Furnitures Revenue (undefined), by Application 2025 & 2033
- Figure 52: Asia Pacific Ready to Assemble Furnitures Volume (K), by Application 2025 & 2033
- Figure 53: Asia Pacific Ready to Assemble Furnitures Revenue Share (%), by Application 2025 & 2033
- Figure 54: Asia Pacific Ready to Assemble Furnitures Volume Share (%), by Application 2025 & 2033
- Figure 55: Asia Pacific Ready to Assemble Furnitures Revenue (undefined), by Types 2025 & 2033
- Figure 56: Asia Pacific Ready to Assemble Furnitures Volume (K), by Types 2025 & 2033
- Figure 57: Asia Pacific Ready to Assemble Furnitures Revenue Share (%), by Types 2025 & 2033
- Figure 58: Asia Pacific Ready to Assemble Furnitures Volume Share (%), by Types 2025 & 2033
- Figure 59: Asia Pacific Ready to Assemble Furnitures Revenue (undefined), by Country 2025 & 2033
- Figure 60: Asia Pacific Ready to Assemble Furnitures Volume (K), by Country 2025 & 2033
- Figure 61: Asia Pacific Ready to Assemble Furnitures Revenue Share (%), by Country 2025 & 2033
- Figure 62: Asia Pacific Ready to Assemble Furnitures Volume Share (%), by Country 2025 & 2033
List of Tables
- Table 1: Global Ready to Assemble Furnitures Revenue undefined Forecast, by Application 2020 & 2033
- Table 2: Global Ready to Assemble Furnitures Volume K Forecast, by Application 2020 & 2033
- Table 3: Global Ready to Assemble Furnitures Revenue undefined Forecast, by Types 2020 & 2033
- Table 4: Global Ready to Assemble Furnitures Volume K Forecast, by Types 2020 & 2033
- Table 5: Global Ready to Assemble Furnitures Revenue undefined Forecast, by Region 2020 & 2033
- Table 6: Global Ready to Assemble Furnitures Volume K Forecast, by Region 2020 & 2033
- Table 7: Global Ready to Assemble Furnitures Revenue undefined Forecast, by Application 2020 & 2033
- Table 8: Global Ready to Assemble Furnitures Volume K Forecast, by Application 2020 & 2033
- Table 9: Global Ready to Assemble Furnitures Revenue undefined Forecast, by Types 2020 & 2033
- Table 10: Global Ready to Assemble Furnitures Volume K Forecast, by Types 2020 & 2033
- Table 11: Global Ready to Assemble Furnitures Revenue undefined Forecast, by Country 2020 & 2033
- Table 12: Global Ready to Assemble Furnitures Volume K Forecast, by Country 2020 & 2033
- Table 13: United States Ready to Assemble Furnitures Revenue (undefined) Forecast, by Application 2020 & 2033
- Table 14: United States Ready to Assemble Furnitures Volume (K) Forecast, by Application 2020 & 2033
- Table 15: Canada Ready to Assemble Furnitures Revenue (undefined) Forecast, by Application 2020 & 2033
- Table 16: Canada Ready to Assemble Furnitures Volume (K) Forecast, by Application 2020 & 2033
- Table 17: Mexico Ready to Assemble Furnitures Revenue (undefined) Forecast, by Application 2020 & 2033
- Table 18: Mexico Ready to Assemble Furnitures Volume (K) Forecast, by Application 2020 & 2033
- Table 19: Global Ready to Assemble Furnitures Revenue undefined Forecast, by Application 2020 & 2033
- Table 20: Global Ready to Assemble Furnitures Volume K Forecast, by Application 2020 & 2033
- Table 21: Global Ready to Assemble Furnitures Revenue undefined Forecast, by Types 2020 & 2033
- Table 22: Global Ready to Assemble Furnitures Volume K Forecast, by Types 2020 & 2033
- Table 23: Global Ready to Assemble Furnitures Revenue undefined Forecast, by Country 2020 & 2033
- Table 24: Global Ready to Assemble Furnitures Volume K Forecast, by Country 2020 & 2033
- Table 25: Brazil Ready to Assemble Furnitures Revenue (undefined) Forecast, by Application 2020 & 2033
- Table 26: Brazil Ready to Assemble Furnitures Volume (K) Forecast, by Application 2020 & 2033
- Table 27: Argentina Ready to Assemble Furnitures Revenue (undefined) Forecast, by Application 2020 & 2033
- Table 28: Argentina Ready to Assemble Furnitures Volume (K) Forecast, by Application 2020 & 2033
- Table 29: Rest of South America Ready to Assemble Furnitures Revenue (undefined) Forecast, by Application 2020 & 2033
- Table 30: Rest of South America Ready to Assemble Furnitures Volume (K) Forecast, by Application 2020 & 2033
- Table 31: Global Ready to Assemble Furnitures Revenue undefined Forecast, by Application 2020 & 2033
- Table 32: Global Ready to Assemble Furnitures Volume K Forecast, by Application 2020 & 2033
- Table 33: Global Ready to Assemble Furnitures Revenue undefined Forecast, by Types 2020 & 2033
- Table 34: Global Ready to Assemble Furnitures Volume K Forecast, by Types 2020 & 2033
- Table 35: Global Ready to Assemble Furnitures Revenue undefined Forecast, by Country 2020 & 2033
- Table 36: Global Ready to Assemble Furnitures Volume K Forecast, by Country 2020 & 2033
- Table 37: United Kingdom Ready to Assemble Furnitures Revenue (undefined) Forecast, by Application 2020 & 2033
- Table 38: United Kingdom Ready to Assemble Furnitures Volume (K) Forecast, by Application 2020 & 2033
- Table 39: Germany Ready to Assemble Furnitures Revenue (undefined) Forecast, by Application 2020 & 2033
- Table 40: Germany Ready to Assemble Furnitures Volume (K) Forecast, by Application 2020 & 2033
- Table 41: France Ready to Assemble Furnitures Revenue (undefined) Forecast, by Application 2020 & 2033
- Table 42: France Ready to Assemble Furnitures Volume (K) Forecast, by Application 2020 & 2033
- Table 43: Italy Ready to Assemble Furnitures Revenue (undefined) Forecast, by Application 2020 & 2033
- Table 44: Italy Ready to Assemble Furnitures Volume (K) Forecast, by Application 2020 & 2033
- Table 45: Spain Ready to Assemble Furnitures Revenue (undefined) Forecast, by Application 2020 & 2033
- Table 46: Spain Ready to Assemble Furnitures Volume (K) Forecast, by Application 2020 & 2033
- Table 47: Russia Ready to Assemble Furnitures Revenue (undefined) Forecast, by Application 2020 & 2033
- Table 48: Russia Ready to Assemble Furnitures Volume (K) Forecast, by Application 2020 & 2033
- Table 49: Benelux Ready to Assemble Furnitures Revenue (undefined) Forecast, by Application 2020 & 2033
- Table 50: Benelux Ready to Assemble Furnitures Volume (K) Forecast, by Application 2020 & 2033
- Table 51: Nordics Ready to Assemble Furnitures Revenue (undefined) Forecast, by Application 2020 & 2033
- Table 52: Nordics Ready to Assemble Furnitures Volume (K) Forecast, by Application 2020 & 2033
- Table 53: Rest of Europe Ready to Assemble Furnitures Revenue (undefined) Forecast, by Application 2020 & 2033
- Table 54: Rest of Europe Ready to Assemble Furnitures Volume (K) Forecast, by Application 2020 & 2033
- Table 55: Global Ready to Assemble Furnitures Revenue undefined Forecast, by Application 2020 & 2033
- Table 56: Global Ready to Assemble Furnitures Volume K Forecast, by Application 2020 & 2033
- Table 57: Global Ready to Assemble Furnitures Revenue undefined Forecast, by Types 2020 & 2033
- Table 58: Global Ready to Assemble Furnitures Volume K Forecast, by Types 2020 & 2033
- Table 59: Global Ready to Assemble Furnitures Revenue undefined Forecast, by Country 2020 & 2033
- Table 60: Global Ready to Assemble Furnitures Volume K Forecast, by Country 2020 & 2033
- Table 61: Turkey Ready to Assemble Furnitures Revenue (undefined) Forecast, by Application 2020 & 2033
- Table 62: Turkey Ready to Assemble Furnitures Volume (K) Forecast, by Application 2020 & 2033
- Table 63: Israel Ready to Assemble Furnitures Revenue (undefined) Forecast, by Application 2020 & 2033
- Table 64: Israel Ready to Assemble Furnitures Volume (K) Forecast, by Application 2020 & 2033
- Table 65: GCC Ready to Assemble Furnitures Revenue (undefined) Forecast, by Application 2020 & 2033
- Table 66: GCC Ready to Assemble Furnitures Volume (K) Forecast, by Application 2020 & 2033
- Table 67: North Africa Ready to Assemble Furnitures Revenue (undefined) Forecast, by Application 2020 & 2033
- Table 68: North Africa Ready to Assemble Furnitures Volume (K) Forecast, by Application 2020 & 2033
- Table 69: South Africa Ready to Assemble Furnitures Revenue (undefined) Forecast, by Application 2020 & 2033
- Table 70: South Africa Ready to Assemble Furnitures Volume (K) Forecast, by Application 2020 & 2033
- Table 71: Rest of Middle East & Africa Ready to Assemble Furnitures Revenue (undefined) Forecast, by Application 2020 & 2033
- Table 72: Rest of Middle East & Africa Ready to Assemble Furnitures Volume (K) Forecast, by Application 2020 & 2033
- Table 73: Global Ready to Assemble Furnitures Revenue undefined Forecast, by Application 2020 & 2033
- Table 74: Global Ready to Assemble Furnitures Volume K Forecast, by Application 2020 & 2033
- Table 75: Global Ready to Assemble Furnitures Revenue undefined Forecast, by Types 2020 & 2033
- Table 76: Global Ready to Assemble Furnitures Volume K Forecast, by Types 2020 & 2033
- Table 77: Global Ready to Assemble Furnitures Revenue undefined Forecast, by Country 2020 & 2033
- Table 78: Global Ready to Assemble Furnitures Volume K Forecast, by Country 2020 & 2033
- Table 79: China Ready to Assemble Furnitures Revenue (undefined) Forecast, by Application 2020 & 2033
- Table 80: China Ready to Assemble Furnitures Volume (K) Forecast, by Application 2020 & 2033
- Table 81: India Ready to Assemble Furnitures Revenue (undefined) Forecast, by Application 2020 & 2033
- Table 82: India Ready to Assemble Furnitures Volume (K) Forecast, by Application 2020 & 2033
- Table 83: Japan Ready to Assemble Furnitures Revenue (undefined) Forecast, by Application 2020 & 2033
- Table 84: Japan Ready to Assemble Furnitures Volume (K) Forecast, by Application 2020 & 2033
- Table 85: South Korea Ready to Assemble Furnitures Revenue (undefined) Forecast, by Application 2020 & 2033
- Table 86: South Korea Ready to Assemble Furnitures Volume (K) Forecast, by Application 2020 & 2033
- Table 87: ASEAN Ready to Assemble Furnitures Revenue (undefined) Forecast, by Application 2020 & 2033
- Table 88: ASEAN Ready to Assemble Furnitures Volume (K) Forecast, by Application 2020 & 2033
- Table 89: Oceania Ready to Assemble Furnitures Revenue (undefined) Forecast, by Application 2020 & 2033
- Table 90: Oceania Ready to Assemble Furnitures Volume (K) Forecast, by Application 2020 & 2033
- Table 91: Rest of Asia Pacific Ready to Assemble Furnitures Revenue (undefined) Forecast, by Application 2020 & 2033
- Table 92: Rest of Asia Pacific Ready to Assemble Furnitures Volume (K) Forecast, by Application 2020 & 2033
Frequently Asked Questions
1. What is the projected Compound Annual Growth Rate (CAGR) of the Ready to Assemble Furnitures?
The projected CAGR is approximately 4.8%.
2. Which companies are prominent players in the Ready to Assemble Furnitures?
Key companies in the market include Sauder Woodworking, Dorel Industries, Bush Industries, Whalen Furniture, Homestar North America, IKEA, Flexsteel (Home Styles), Simplicity Sofas, Prepac, South Shore.
3. What are the main segments of the Ready to Assemble Furnitures?
The market segments include Application, Types.
4. Can you provide details about the market size?
The market size is estimated to be USD XXX N/A as of 2022.
5. What are some drivers contributing to market growth?
N/A
6. What are the notable trends driving market growth?
N/A
7. Are there any restraints impacting market growth?
N/A
8. Can you provide examples of recent developments in the market?
N/A
9. What pricing options are available for accessing the report?
Pricing options include single-user, multi-user, and enterprise licenses priced at USD 3950.00, USD 5925.00, and USD 7900.00 respectively.
10. Is the market size provided in terms of value or volume?
The market size is provided in terms of value, measured in N/A and volume, measured in K.
11. Are there any specific market keywords associated with the report?
Yes, the market keyword associated with the report is "Ready to Assemble Furnitures," which aids in identifying and referencing the specific market segment covered.
12. How do I determine which pricing option suits my needs best?
The pricing options vary based on user requirements and access needs. Individual users may opt for single-user licenses, while businesses requiring broader access may choose multi-user or enterprise licenses for cost-effective access to the report.
13. Are there any additional resources or data provided in the Ready to Assemble Furnitures report?
While the report offers comprehensive insights, it's advisable to review the specific contents or supplementary materials provided to ascertain if additional resources or data are available.
14. How can I stay updated on further developments or reports in the Ready to Assemble Furnitures?
To stay informed about further developments, trends, and reports in the Ready to Assemble Furnitures, consider subscribing to industry newsletters, following relevant companies and organizations, or regularly checking reputable industry news sources and publications.
Methodology
Step 1 - Identification of Relevant Samples Size from Population Database


Step 2 - Approaches for Defining Global Market Size (Value, Volume* & Price*)

Note*: In applicable scenarios
Step 3 - Data Sources
Primary Research
- Web Analytics
- Survey Reports
- Research Institute
- Latest Research Reports
- Opinion Leaders
Secondary Research
- Annual Reports
- White Paper
- Latest Press Release
- Industry Association
- Paid Database
- Investor Presentations

Step 4 - Data Triangulation
Involves using different sources of information in order to increase the validity of a study
These sources are likely to be stakeholders in a program - participants, other researchers, program staff, other community members, and so on.
Then we put all data in single framework & apply various statistical tools to find out the dynamic on the market.
During the analysis stage, feedback from the stakeholder groups would be compared to determine areas of agreement as well as areas of divergence