

Key Insights
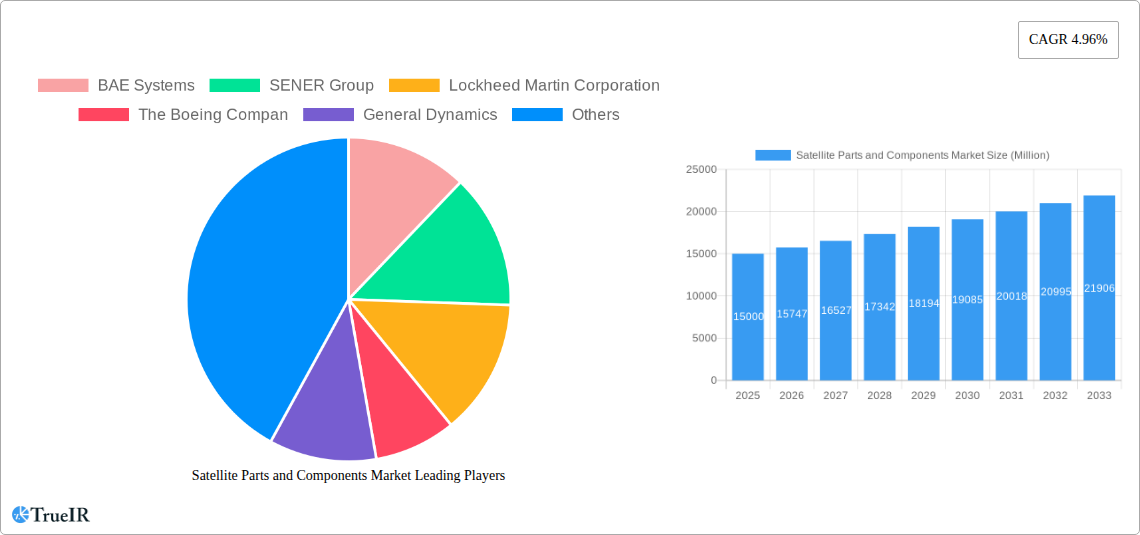
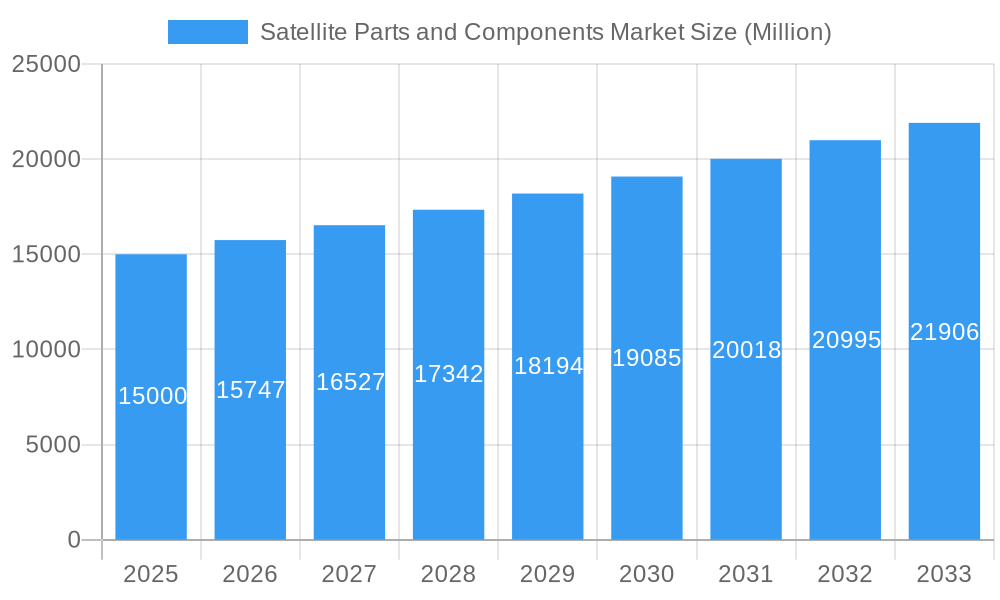
The global satellite parts and components market is poised for significant expansion, fueled by escalating demand for satellite-derived services across telecommunications, navigation, Earth observation, and defense sectors. The market is projected to achieve a Compound Annual Growth Rate (CAGR) of 7%, with its size reaching $25 billion by 2025. Key growth drivers include the proliferation of small satellites, component miniaturization, technological advancements enhancing satellite capabilities, and the growing global need for robust, high-speed communication infrastructure. Prominent market segments encompass payload components (cameras, sensors, transponders, mission computers), antenna systems (parabolic, phased array), and structural elements (satellite bus, solar panels, propulsion systems). The integration of AI and IoT into satellite systems further accelerates market growth. Leading industry players are actively engaged in innovation and strategic partnerships to capture market share. North America and Europe currently dominate the market, with the Asia-Pacific region exhibiting substantial growth potential due to increased investments in space exploration and telecommunications infrastructure.
Satellite Parts and Components Market Market Size (In Billion)
Challenges include high development and launch costs, stringent regulatory environments, and the complexities of space-qualified component manufacturing. However, the long-term outlook remains highly optimistic, driven by expanding satellite applications and continuous evolution within the space industry.
Satellite Parts and Components Market Company Market Share
Market segmentation underscores the critical role of technological innovation. Advancements in sensor technology are driving demand for high-resolution imagery and data acquisition, while miniaturization efforts facilitate the development of smaller, more cost-effective satellites. The adoption of phased array antennas is enhancing satellite communication efficiency and flexibility. Furthermore, the development of efficient propulsion systems is vital for extending satellite operational lifespans and reducing costs. The synergy between these segments is a key contributor to overall market growth. Market success will be contingent upon the ability to adapt to emerging technologies, meet the demand for customized solutions, and effectively navigate regulatory compliance and cost considerations. The sustained growth of the global economy and increasing reliance on space-based technologies ensure a continued demand for innovative and dependable satellite parts and components.
Satellite Parts and Components Market Report: 2019-2033
This comprehensive report provides an in-depth analysis of the global Satellite Parts and Components Market, offering invaluable insights for industry stakeholders, investors, and researchers. With a study period spanning 2019-2033, a base year of 2025, and a forecast period of 2025-2033, this report leverages extensive market data to paint a clear picture of current trends and future projections. The market is expected to reach xx Million by 2033, exhibiting a robust CAGR of xx%.
Satellite Parts and Components Market Market Structure & Competitive Landscape
The Satellite Parts and Components Market is characterized by a moderately concentrated structure, with a few major players holding significant market share. The Herfindahl-Hirschman Index (HHI) is estimated to be xx, indicating a moderately concentrated landscape. Innovation is a crucial driver, with companies continuously investing in research and development to enhance product capabilities and efficiency. Stringent regulatory frameworks, particularly concerning space debris mitigation and international space laws, significantly impact market dynamics. The market also experiences competition from emerging technologies and substitute materials. End-user segmentation primarily includes government agencies, commercial satellite operators, and research institutions. M&A activity has been moderate in recent years, with xx mergers and acquisitions recorded between 2019 and 2024, valued at approximately xx Million. This activity is driven by the need for companies to expand their product portfolios and geographic reach.
- Market Concentration: Moderately Concentrated (HHI: xx)
- Innovation Drivers: Advancements in materials science, miniaturization, and AI-powered systems.
- Regulatory Impacts: Stringent regulations regarding launch permits, orbital debris, and data security.
- Product Substitutes: Emerging technologies, such as CubeSats and nanosatellites, pose a degree of substitutional threat.
- End-User Segmentation: Government agencies (xx%), Commercial Operators (xx%), Research Institutions (xx%).
- M&A Trends: Moderate activity (xx transactions between 2019-2024, total value: xx Million).
Satellite Parts and Components Market Market Trends & Opportunities
The Satellite Parts and Components Market is experiencing significant growth, driven by the increasing demand for satellite-based services across various sectors, including telecommunications, navigation, earth observation, and defense. The market size is projected to grow from xx Million in 2025 to xx Million by 2033, registering a CAGR of xx%. Technological advancements such as the development of lighter, more efficient, and cost-effective components are pushing the market forward. Furthermore, the rising adoption of miniaturized satellites (CubeSats and nanosatellites) is creating new opportunities, expanding access to space-based technologies. Consumer preferences are shifting towards enhanced performance, reliability, and miniaturization. The competitive landscape is highly dynamic, with established players facing challenges from emerging players offering innovative and cost-competitive products. Market penetration rates for key components vary, with payloads having higher penetration compared to advanced antenna technologies.
Dominant Markets & Segments in Satellite Parts and Components Market
The North American region currently dominates the Satellite Parts and Components Market, driven by robust government investment in space exploration, strong commercial space sector growth, and established manufacturing capabilities. Europe follows as a major market, with a strong presence in satellite manufacturing and launch services. The Payload segment, specifically cameras and sensors, holds the largest market share due to the widespread use of earth observation and remote sensing applications. This is followed by the Antenna segment, particularly driven by communication satellite needs.
- Key Growth Drivers (North America): High government spending on space programs, strong private sector investment, robust technological innovation.
- Key Growth Drivers (Europe): Strong presence in satellite manufacturing, skilled workforce, substantial R&D investments.
- Dominant Segment: Payload (Cameras and sensors) – driven by increasing demand in earth observation and remote sensing.
Satellite Parts and Components Market Product Analysis
The Satellite Parts and Components Market showcases continuous product innovation. Recent advancements include the development of higher-resolution cameras, more efficient solar panels, and lighter propulsion systems. These innovations enhance satellite performance, reduce launch costs, and extend mission lifespans. The market is characterized by a focus on miniaturization, improved reliability, and enhanced functionality, all of which improve the overall competitiveness of satellite systems.
Key Drivers, Barriers & Challenges in Satellite Parts and Components Market
Key Drivers:
Increased demand for satellite-based services across diverse sectors, technological advancements leading to more efficient and cost-effective components, supportive government policies and funding for space exploration. The rise of NewSpace companies is injecting innovation and competition into the market.
Challenges:
Supply chain disruptions, particularly in the sourcing of critical raw materials, can significantly impact production. Stringent regulatory hurdles and licensing requirements create barriers to market entry. Intense competition among established players and the emergence of innovative startups create pressure on pricing and margins. The risk of space debris collisions poses an ongoing concern, driving the need for enhanced mitigation strategies.
Growth Drivers in the Satellite Parts and Components Market Market
The market's growth is primarily fueled by the expanding demand for satellite imagery and data in various fields like agriculture, environmental monitoring, and disaster management. Technological innovations such as advanced sensors, miniaturization, and improved communication systems continue to stimulate growth. Government investments in space exploration and supportive regulatory frameworks also contribute to market expansion.
Challenges Impacting Satellite Parts and Components Market Growth
The Satellite Parts and Components Market faces challenges from stringent regulatory compliance requirements which increase development costs. Supply chain disruptions can cause delays and cost increases. Intense competition from both established and emerging players exerts pressure on pricing and profitability. Lastly, evolving technological landscapes require ongoing investment to stay ahead of competition.
Key Players Shaping the Satellite Parts and Components Market Market
- BAE Systems
- SENER Group
- Lockheed Martin Corporation
- The Boeing Company
- General Dynamics
- Thales
- OHB SE
- Innovative Solutions in Space BV
- Sitael S p A
- Northrop Grumman Corporation
- Jena-Optronik
- AAC Clyde Space
Significant Satellite Parts and Components Market Industry Milestones
- November 2022: Two star trackers from Jena-Optronik GmbH guided NASA's Orion spacecraft during the Artemis I mission.
- December 2022: Jena-Optronik's ASTRO CL star sensor was integrated into Maxar's new LEO platform.
- January 2023: ISISPACE's ISILAUNCH38 mission, in partnership with SpaceBD, launched 47 payloads from 8 countries via a Falcon 9 Rocket.
Future Outlook for Satellite Parts and Components Market Market
The Satellite Parts and Components Market is poised for sustained growth, driven by ongoing technological advancements, increasing demand for satellite-based services, and supportive government policies. Strategic opportunities exist in developing cost-effective and miniaturized components, expanding into new applications, and focusing on sustainability initiatives. The market's potential is substantial, with significant growth predicted across various segments and geographical regions.
Satellite Parts and Components Market Segmentation
- 1. Production Analysis
- 2. Consumption Analysis
- 3. Import Market Analysis (Value & Volume)
- 4. Export Market Analysis (Value & Volume)
- 5. Price Trend Analysis
Satellite Parts and Components Market Segmentation By Geography
-
1. North America
- 1.1. United States
- 1.2. Canada
- 1.3. Mexico
-
2. South America
- 2.1. Brazil
- 2.2. Argentina
- 2.3. Rest of South America
-
3. Europe
- 3.1. United Kingdom
- 3.2. Germany
- 3.3. France
- 3.4. Italy
- 3.5. Spain
- 3.6. Russia
- 3.7. Benelux
- 3.8. Nordics
- 3.9. Rest of Europe
-
4. Middle East & Africa
- 4.1. Turkey
- 4.2. Israel
- 4.3. GCC
- 4.4. North Africa
- 4.5. South Africa
- 4.6. Rest of Middle East & Africa
-
5. Asia Pacific
- 5.1. China
- 5.2. India
- 5.3. Japan
- 5.4. South Korea
- 5.5. ASEAN
- 5.6. Oceania
- 5.7. Rest of Asia Pacific
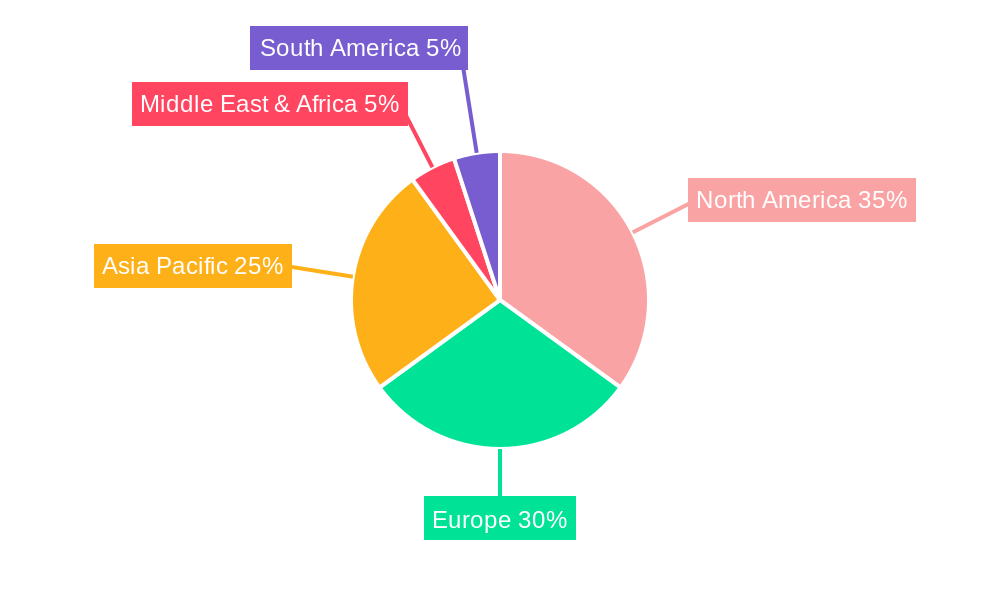
Satellite Parts and Components Market Regional Market Share
Geographic Coverage of Satellite Parts and Components Market
Satellite Parts and Components Market REPORT HIGHLIGHTS
| Aspects | Details |
|---|---|
| Study Period | 2020-2034 |
| Base Year | 2025 |
| Estimated Year | 2026 |
| Forecast Period | 2026-2034 |
| Historical Period | 2020-2025 |
| Growth Rate | CAGR of 7% from 2020-2034 |
| Segmentation |
|
Table of Contents
- 1. Introduction
- 1.1. Research Scope
- 1.2. Market Segmentation
- 1.3. Research Objective
- 1.4. Definitions and Assumptions
- 2. Executive Summary
- 2.1. Market Snapshot
- 3. Market Dynamics
- 3.1. Market Drivers
- 3.2. Market Restrains
- 3.3. Market Trends
- 3.4. Market Opportunities
- 4. Market Factor Analysis
- 4.1. Porters Five Forces
- 4.1.1. Bargaining Power of Suppliers
- 4.1.2. Bargaining Power of Buyers
- 4.1.3. Threat of New Entrants
- 4.1.4. Threat of Substitutes
- 4.1.5. Competitive Rivalry
- 4.2. PESTEL analysis
- 4.3. BCG Analysis
- 4.3.1. Stars (High Growth, High Market Share)
- 4.3.2. Cash Cows (Low Growth, High Market Share)
- 4.3.3. Question Mark (High Growth, Low Market Share)
- 4.3.4. Dogs (Low Growth, Low Market Share)
- 4.4. Ansoff Matrix Analysis
- 4.5. Supply Chain Analysis
- 4.6. Regulatory Landscape
- 4.7. Current Market Potential and Opportunity Assessment (TAM–SAM–SOM Framework)
- 4.8. TIR Analyst Note
- 4.1. Porters Five Forces
- 5. Market Analysis, Insights and Forecast 2021-2033
- 5.1. Market Analysis, Insights and Forecast - by Production Analysis
- 5.2. Market Analysis, Insights and Forecast - by Consumption Analysis
- 5.3. Market Analysis, Insights and Forecast - by Import Market Analysis (Value & Volume)
- 5.4. Market Analysis, Insights and Forecast - by Export Market Analysis (Value & Volume)
- 5.5. Market Analysis, Insights and Forecast - by Price Trend Analysis
- 5.6. Market Analysis, Insights and Forecast - by Region
- 5.6.1. North America
- 5.6.2. South America
- 5.6.3. Europe
- 5.6.4. Middle East & Africa
- 5.6.5. Asia Pacific
- 6. Global Satellite Parts and Components Market Analysis, Insights and Forecast, 2021-2033
- 6.1. Market Analysis, Insights and Forecast - by Production Analysis
- 6.2. Market Analysis, Insights and Forecast - by Consumption Analysis
- 6.3. Market Analysis, Insights and Forecast - by Import Market Analysis (Value & Volume)
- 6.4. Market Analysis, Insights and Forecast - by Export Market Analysis (Value & Volume)
- 6.5. Market Analysis, Insights and Forecast - by Price Trend Analysis
- 7. North America Satellite Parts and Components Market Analysis, Insights and Forecast, 2020-2032
- 7.1. Market Analysis, Insights and Forecast - by Production Analysis
- 7.2. Market Analysis, Insights and Forecast - by Consumption Analysis
- 7.3. Market Analysis, Insights and Forecast - by Import Market Analysis (Value & Volume)
- 7.4. Market Analysis, Insights and Forecast - by Export Market Analysis (Value & Volume)
- 7.5. Market Analysis, Insights and Forecast - by Price Trend Analysis
- 8. South America Satellite Parts and Components Market Analysis, Insights and Forecast, 2020-2032
- 8.1. Market Analysis, Insights and Forecast - by Production Analysis
- 8.2. Market Analysis, Insights and Forecast - by Consumption Analysis
- 8.3. Market Analysis, Insights and Forecast - by Import Market Analysis (Value & Volume)
- 8.4. Market Analysis, Insights and Forecast - by Export Market Analysis (Value & Volume)
- 8.5. Market Analysis, Insights and Forecast - by Price Trend Analysis
- 9. Europe Satellite Parts and Components Market Analysis, Insights and Forecast, 2020-2032
- 9.1. Market Analysis, Insights and Forecast - by Production Analysis
- 9.2. Market Analysis, Insights and Forecast - by Consumption Analysis
- 9.3. Market Analysis, Insights and Forecast - by Import Market Analysis (Value & Volume)
- 9.4. Market Analysis, Insights and Forecast - by Export Market Analysis (Value & Volume)
- 9.5. Market Analysis, Insights and Forecast - by Price Trend Analysis
- 10. Middle East & Africa Satellite Parts and Components Market Analysis, Insights and Forecast, 2020-2032
- 10.1. Market Analysis, Insights and Forecast - by Production Analysis
- 10.2. Market Analysis, Insights and Forecast - by Consumption Analysis
- 10.3. Market Analysis, Insights and Forecast - by Import Market Analysis (Value & Volume)
- 10.4. Market Analysis, Insights and Forecast - by Export Market Analysis (Value & Volume)
- 10.5. Market Analysis, Insights and Forecast - by Price Trend Analysis
- 11. Asia Pacific Satellite Parts and Components Market Analysis, Insights and Forecast, 2020-2032
- 11.1. Market Analysis, Insights and Forecast - by Production Analysis
- 11.2. Market Analysis, Insights and Forecast - by Consumption Analysis
- 11.3. Market Analysis, Insights and Forecast - by Import Market Analysis (Value & Volume)
- 11.4. Market Analysis, Insights and Forecast - by Export Market Analysis (Value & Volume)
- 11.5. Market Analysis, Insights and Forecast - by Price Trend Analysis
- 12. Competitive Analysis
- 12.1. Company Profiles
- 12.1.1 BAE Systems
- 12.1.1.1. Company Overview
- 12.1.1.2. Products
- 12.1.1.3. Company Financials
- 12.1.1.4. SWOT Analysis
- 12.1.2 SENER Group
- 12.1.2.1. Company Overview
- 12.1.2.2. Products
- 12.1.2.3. Company Financials
- 12.1.2.4. SWOT Analysis
- 12.1.3 Lockheed Martin Corporation
- 12.1.3.1. Company Overview
- 12.1.3.2. Products
- 12.1.3.3. Company Financials
- 12.1.3.4. SWOT Analysis
- 12.1.4 The Boeing Compan
- 12.1.4.1. Company Overview
- 12.1.4.2. Products
- 12.1.4.3. Company Financials
- 12.1.4.4. SWOT Analysis
- 12.1.5 General Dynamics
- 12.1.5.1. Company Overview
- 12.1.5.2. Products
- 12.1.5.3. Company Financials
- 12.1.5.4. SWOT Analysis
- 12.1.6 Thales
- 12.1.6.1. Company Overview
- 12.1.6.2. Products
- 12.1.6.3. Company Financials
- 12.1.6.4. SWOT Analysis
- 12.1.7 OHB SE
- 12.1.7.1. Company Overview
- 12.1.7.2. Products
- 12.1.7.3. Company Financials
- 12.1.7.4. SWOT Analysis
- 12.1.8 Innovative Solutions in Space BV
- 12.1.8.1. Company Overview
- 12.1.8.2. Products
- 12.1.8.3. Company Financials
- 12.1.8.4. SWOT Analysis
- 12.1.9 Sitael S p A
- 12.1.9.1. Company Overview
- 12.1.9.2. Products
- 12.1.9.3. Company Financials
- 12.1.9.4. SWOT Analysis
- 12.1.10 Northrop Grumman Corporation
- 12.1.10.1. Company Overview
- 12.1.10.2. Products
- 12.1.10.3. Company Financials
- 12.1.10.4. SWOT Analysis
- 12.1.11 Jena-Optronik
- 12.1.11.1. Company Overview
- 12.1.11.2. Products
- 12.1.11.3. Company Financials
- 12.1.11.4. SWOT Analysis
- 12.1.12 AAC Clyde Space
- 12.1.12.1. Company Overview
- 12.1.12.2. Products
- 12.1.12.3. Company Financials
- 12.1.12.4. SWOT Analysis
- 12.1.1 BAE Systems
- 12.2. Market Entropy
- 12.2.1 Company's Key Areas Served
- 12.2.2 Recent Developments
- 12.3. Company Market Share Analysis 2025
- 12.3.1 Top 5 Companies Market Share Analysis
- 12.3.2 Top 3 Companies Market Share Analysis
- 12.4. List of Potential Customers
- 13. Research Methodology
List of Figures
- Figure 1: Global Satellite Parts and Components Market Revenue Breakdown (billion, %) by Region 2025 & 2033
- Figure 2: North America Satellite Parts and Components Market Revenue (billion), by Production Analysis 2025 & 2033
- Figure 3: North America Satellite Parts and Components Market Revenue Share (%), by Production Analysis 2025 & 2033
- Figure 4: North America Satellite Parts and Components Market Revenue (billion), by Consumption Analysis 2025 & 2033
- Figure 5: North America Satellite Parts and Components Market Revenue Share (%), by Consumption Analysis 2025 & 2033
- Figure 6: North America Satellite Parts and Components Market Revenue (billion), by Import Market Analysis (Value & Volume) 2025 & 2033
- Figure 7: North America Satellite Parts and Components Market Revenue Share (%), by Import Market Analysis (Value & Volume) 2025 & 2033
- Figure 8: North America Satellite Parts and Components Market Revenue (billion), by Export Market Analysis (Value & Volume) 2025 & 2033
- Figure 9: North America Satellite Parts and Components Market Revenue Share (%), by Export Market Analysis (Value & Volume) 2025 & 2033
- Figure 10: North America Satellite Parts and Components Market Revenue (billion), by Price Trend Analysis 2025 & 2033
- Figure 11: North America Satellite Parts and Components Market Revenue Share (%), by Price Trend Analysis 2025 & 2033
- Figure 12: North America Satellite Parts and Components Market Revenue (billion), by Country 2025 & 2033
- Figure 13: North America Satellite Parts and Components Market Revenue Share (%), by Country 2025 & 2033
- Figure 14: South America Satellite Parts and Components Market Revenue (billion), by Production Analysis 2025 & 2033
- Figure 15: South America Satellite Parts and Components Market Revenue Share (%), by Production Analysis 2025 & 2033
- Figure 16: South America Satellite Parts and Components Market Revenue (billion), by Consumption Analysis 2025 & 2033
- Figure 17: South America Satellite Parts and Components Market Revenue Share (%), by Consumption Analysis 2025 & 2033
- Figure 18: South America Satellite Parts and Components Market Revenue (billion), by Import Market Analysis (Value & Volume) 2025 & 2033
- Figure 19: South America Satellite Parts and Components Market Revenue Share (%), by Import Market Analysis (Value & Volume) 2025 & 2033
- Figure 20: South America Satellite Parts and Components Market Revenue (billion), by Export Market Analysis (Value & Volume) 2025 & 2033
- Figure 21: South America Satellite Parts and Components Market Revenue Share (%), by Export Market Analysis (Value & Volume) 2025 & 2033
- Figure 22: South America Satellite Parts and Components Market Revenue (billion), by Price Trend Analysis 2025 & 2033
- Figure 23: South America Satellite Parts and Components Market Revenue Share (%), by Price Trend Analysis 2025 & 2033
- Figure 24: South America Satellite Parts and Components Market Revenue (billion), by Country 2025 & 2033
- Figure 25: South America Satellite Parts and Components Market Revenue Share (%), by Country 2025 & 2033
- Figure 26: Europe Satellite Parts and Components Market Revenue (billion), by Production Analysis 2025 & 2033
- Figure 27: Europe Satellite Parts and Components Market Revenue Share (%), by Production Analysis 2025 & 2033
- Figure 28: Europe Satellite Parts and Components Market Revenue (billion), by Consumption Analysis 2025 & 2033
- Figure 29: Europe Satellite Parts and Components Market Revenue Share (%), by Consumption Analysis 2025 & 2033
- Figure 30: Europe Satellite Parts and Components Market Revenue (billion), by Import Market Analysis (Value & Volume) 2025 & 2033
- Figure 31: Europe Satellite Parts and Components Market Revenue Share (%), by Import Market Analysis (Value & Volume) 2025 & 2033
- Figure 32: Europe Satellite Parts and Components Market Revenue (billion), by Export Market Analysis (Value & Volume) 2025 & 2033
- Figure 33: Europe Satellite Parts and Components Market Revenue Share (%), by Export Market Analysis (Value & Volume) 2025 & 2033
- Figure 34: Europe Satellite Parts and Components Market Revenue (billion), by Price Trend Analysis 2025 & 2033
- Figure 35: Europe Satellite Parts and Components Market Revenue Share (%), by Price Trend Analysis 2025 & 2033
- Figure 36: Europe Satellite Parts and Components Market Revenue (billion), by Country 2025 & 2033
- Figure 37: Europe Satellite Parts and Components Market Revenue Share (%), by Country 2025 & 2033
- Figure 38: Middle East & Africa Satellite Parts and Components Market Revenue (billion), by Production Analysis 2025 & 2033
- Figure 39: Middle East & Africa Satellite Parts and Components Market Revenue Share (%), by Production Analysis 2025 & 2033
- Figure 40: Middle East & Africa Satellite Parts and Components Market Revenue (billion), by Consumption Analysis 2025 & 2033
- Figure 41: Middle East & Africa Satellite Parts and Components Market Revenue Share (%), by Consumption Analysis 2025 & 2033
- Figure 42: Middle East & Africa Satellite Parts and Components Market Revenue (billion), by Import Market Analysis (Value & Volume) 2025 & 2033
- Figure 43: Middle East & Africa Satellite Parts and Components Market Revenue Share (%), by Import Market Analysis (Value & Volume) 2025 & 2033
- Figure 44: Middle East & Africa Satellite Parts and Components Market Revenue (billion), by Export Market Analysis (Value & Volume) 2025 & 2033
- Figure 45: Middle East & Africa Satellite Parts and Components Market Revenue Share (%), by Export Market Analysis (Value & Volume) 2025 & 2033
- Figure 46: Middle East & Africa Satellite Parts and Components Market Revenue (billion), by Price Trend Analysis 2025 & 2033
- Figure 47: Middle East & Africa Satellite Parts and Components Market Revenue Share (%), by Price Trend Analysis 2025 & 2033
- Figure 48: Middle East & Africa Satellite Parts and Components Market Revenue (billion), by Country 2025 & 2033
- Figure 49: Middle East & Africa Satellite Parts and Components Market Revenue Share (%), by Country 2025 & 2033
- Figure 50: Asia Pacific Satellite Parts and Components Market Revenue (billion), by Production Analysis 2025 & 2033
- Figure 51: Asia Pacific Satellite Parts and Components Market Revenue Share (%), by Production Analysis 2025 & 2033
- Figure 52: Asia Pacific Satellite Parts and Components Market Revenue (billion), by Consumption Analysis 2025 & 2033
- Figure 53: Asia Pacific Satellite Parts and Components Market Revenue Share (%), by Consumption Analysis 2025 & 2033
- Figure 54: Asia Pacific Satellite Parts and Components Market Revenue (billion), by Import Market Analysis (Value & Volume) 2025 & 2033
- Figure 55: Asia Pacific Satellite Parts and Components Market Revenue Share (%), by Import Market Analysis (Value & Volume) 2025 & 2033
- Figure 56: Asia Pacific Satellite Parts and Components Market Revenue (billion), by Export Market Analysis (Value & Volume) 2025 & 2033
- Figure 57: Asia Pacific Satellite Parts and Components Market Revenue Share (%), by Export Market Analysis (Value & Volume) 2025 & 2033
- Figure 58: Asia Pacific Satellite Parts and Components Market Revenue (billion), by Price Trend Analysis 2025 & 2033
- Figure 59: Asia Pacific Satellite Parts and Components Market Revenue Share (%), by Price Trend Analysis 2025 & 2033
- Figure 60: Asia Pacific Satellite Parts and Components Market Revenue (billion), by Country 2025 & 2033
- Figure 61: Asia Pacific Satellite Parts and Components Market Revenue Share (%), by Country 2025 & 2033
List of Tables
- Table 1: Global Satellite Parts and Components Market Revenue billion Forecast, by Production Analysis 2020 & 2033
- Table 2: Global Satellite Parts and Components Market Revenue billion Forecast, by Consumption Analysis 2020 & 2033
- Table 3: Global Satellite Parts and Components Market Revenue billion Forecast, by Import Market Analysis (Value & Volume) 2020 & 2033
- Table 4: Global Satellite Parts and Components Market Revenue billion Forecast, by Export Market Analysis (Value & Volume) 2020 & 2033
- Table 5: Global Satellite Parts and Components Market Revenue billion Forecast, by Price Trend Analysis 2020 & 2033
- Table 6: Global Satellite Parts and Components Market Revenue billion Forecast, by Region 2020 & 2033
- Table 7: Global Satellite Parts and Components Market Revenue billion Forecast, by Production Analysis 2020 & 2033
- Table 8: Global Satellite Parts and Components Market Revenue billion Forecast, by Consumption Analysis 2020 & 2033
- Table 9: Global Satellite Parts and Components Market Revenue billion Forecast, by Import Market Analysis (Value & Volume) 2020 & 2033
- Table 10: Global Satellite Parts and Components Market Revenue billion Forecast, by Export Market Analysis (Value & Volume) 2020 & 2033
- Table 11: Global Satellite Parts and Components Market Revenue billion Forecast, by Price Trend Analysis 2020 & 2033
- Table 12: Global Satellite Parts and Components Market Revenue billion Forecast, by Country 2020 & 2033
- Table 13: United States Satellite Parts and Components Market Revenue (billion) Forecast, by Application 2020 & 2033
- Table 14: Canada Satellite Parts and Components Market Revenue (billion) Forecast, by Application 2020 & 2033
- Table 15: Mexico Satellite Parts and Components Market Revenue (billion) Forecast, by Application 2020 & 2033
- Table 16: Global Satellite Parts and Components Market Revenue billion Forecast, by Production Analysis 2020 & 2033
- Table 17: Global Satellite Parts and Components Market Revenue billion Forecast, by Consumption Analysis 2020 & 2033
- Table 18: Global Satellite Parts and Components Market Revenue billion Forecast, by Import Market Analysis (Value & Volume) 2020 & 2033
- Table 19: Global Satellite Parts and Components Market Revenue billion Forecast, by Export Market Analysis (Value & Volume) 2020 & 2033
- Table 20: Global Satellite Parts and Components Market Revenue billion Forecast, by Price Trend Analysis 2020 & 2033
- Table 21: Global Satellite Parts and Components Market Revenue billion Forecast, by Country 2020 & 2033
- Table 22: Brazil Satellite Parts and Components Market Revenue (billion) Forecast, by Application 2020 & 2033
- Table 23: Argentina Satellite Parts and Components Market Revenue (billion) Forecast, by Application 2020 & 2033
- Table 24: Rest of South America Satellite Parts and Components Market Revenue (billion) Forecast, by Application 2020 & 2033
- Table 25: Global Satellite Parts and Components Market Revenue billion Forecast, by Production Analysis 2020 & 2033
- Table 26: Global Satellite Parts and Components Market Revenue billion Forecast, by Consumption Analysis 2020 & 2033
- Table 27: Global Satellite Parts and Components Market Revenue billion Forecast, by Import Market Analysis (Value & Volume) 2020 & 2033
- Table 28: Global Satellite Parts and Components Market Revenue billion Forecast, by Export Market Analysis (Value & Volume) 2020 & 2033
- Table 29: Global Satellite Parts and Components Market Revenue billion Forecast, by Price Trend Analysis 2020 & 2033
- Table 30: Global Satellite Parts and Components Market Revenue billion Forecast, by Country 2020 & 2033
- Table 31: United Kingdom Satellite Parts and Components Market Revenue (billion) Forecast, by Application 2020 & 2033
- Table 32: Germany Satellite Parts and Components Market Revenue (billion) Forecast, by Application 2020 & 2033
- Table 33: France Satellite Parts and Components Market Revenue (billion) Forecast, by Application 2020 & 2033
- Table 34: Italy Satellite Parts and Components Market Revenue (billion) Forecast, by Application 2020 & 2033
- Table 35: Spain Satellite Parts and Components Market Revenue (billion) Forecast, by Application 2020 & 2033
- Table 36: Russia Satellite Parts and Components Market Revenue (billion) Forecast, by Application 2020 & 2033
- Table 37: Benelux Satellite Parts and Components Market Revenue (billion) Forecast, by Application 2020 & 2033
- Table 38: Nordics Satellite Parts and Components Market Revenue (billion) Forecast, by Application 2020 & 2033
- Table 39: Rest of Europe Satellite Parts and Components Market Revenue (billion) Forecast, by Application 2020 & 2033
- Table 40: Global Satellite Parts and Components Market Revenue billion Forecast, by Production Analysis 2020 & 2033
- Table 41: Global Satellite Parts and Components Market Revenue billion Forecast, by Consumption Analysis 2020 & 2033
- Table 42: Global Satellite Parts and Components Market Revenue billion Forecast, by Import Market Analysis (Value & Volume) 2020 & 2033
- Table 43: Global Satellite Parts and Components Market Revenue billion Forecast, by Export Market Analysis (Value & Volume) 2020 & 2033
- Table 44: Global Satellite Parts and Components Market Revenue billion Forecast, by Price Trend Analysis 2020 & 2033
- Table 45: Global Satellite Parts and Components Market Revenue billion Forecast, by Country 2020 & 2033
- Table 46: Turkey Satellite Parts and Components Market Revenue (billion) Forecast, by Application 2020 & 2033
- Table 47: Israel Satellite Parts and Components Market Revenue (billion) Forecast, by Application 2020 & 2033
- Table 48: GCC Satellite Parts and Components Market Revenue (billion) Forecast, by Application 2020 & 2033
- Table 49: North Africa Satellite Parts and Components Market Revenue (billion) Forecast, by Application 2020 & 2033
- Table 50: South Africa Satellite Parts and Components Market Revenue (billion) Forecast, by Application 2020 & 2033
- Table 51: Rest of Middle East & Africa Satellite Parts and Components Market Revenue (billion) Forecast, by Application 2020 & 2033
- Table 52: Global Satellite Parts and Components Market Revenue billion Forecast, by Production Analysis 2020 & 2033
- Table 53: Global Satellite Parts and Components Market Revenue billion Forecast, by Consumption Analysis 2020 & 2033
- Table 54: Global Satellite Parts and Components Market Revenue billion Forecast, by Import Market Analysis (Value & Volume) 2020 & 2033
- Table 55: Global Satellite Parts and Components Market Revenue billion Forecast, by Export Market Analysis (Value & Volume) 2020 & 2033
- Table 56: Global Satellite Parts and Components Market Revenue billion Forecast, by Price Trend Analysis 2020 & 2033
- Table 57: Global Satellite Parts and Components Market Revenue billion Forecast, by Country 2020 & 2033
- Table 58: China Satellite Parts and Components Market Revenue (billion) Forecast, by Application 2020 & 2033
- Table 59: India Satellite Parts and Components Market Revenue (billion) Forecast, by Application 2020 & 2033
- Table 60: Japan Satellite Parts and Components Market Revenue (billion) Forecast, by Application 2020 & 2033
- Table 61: South Korea Satellite Parts and Components Market Revenue (billion) Forecast, by Application 2020 & 2033
- Table 62: ASEAN Satellite Parts and Components Market Revenue (billion) Forecast, by Application 2020 & 2033
- Table 63: Oceania Satellite Parts and Components Market Revenue (billion) Forecast, by Application 2020 & 2033
- Table 64: Rest of Asia Pacific Satellite Parts and Components Market Revenue (billion) Forecast, by Application 2020 & 2033
Frequently Asked Questions
1. What is the projected Compound Annual Growth Rate (CAGR) of the Satellite Parts and Components Market?
The projected CAGR is approximately 7%.
2. Which companies are prominent players in the Satellite Parts and Components Market?
Key companies in the market include BAE Systems, SENER Group, Lockheed Martin Corporation, The Boeing Compan, General Dynamics, Thales, OHB SE, Innovative Solutions in Space BV, Sitael S p A, Northrop Grumman Corporation, Jena-Optronik, AAC Clyde Space.
3. What are the main segments of the Satellite Parts and Components Market?
The market segments include Production Analysis, Consumption Analysis, Import Market Analysis (Value & Volume), Export Market Analysis (Value & Volume), Price Trend Analysis.
4. Can you provide details about the market size?
The market size is estimated to be USD 25 billion as of 2022.
5. What are some drivers contributing to market growth?
N/A
6. What are the notable trends driving market growth?
OTHER KEY INDUSTRY TRENDS COVERED IN THE REPORT.
7. Are there any restraints impacting market growth?
N/A
8. Can you provide examples of recent developments in the market?
January 2023: ISISPACE has launched 47 payloads from 8 different countries during its ISILAUNCH38 mission on board Falcon 9 Rocket. ISILAUNCH partnered with SpaceBD from Japan, to jointly manifest payloads from Japan, Europe, and other parts of the world on the launch on one of the ports on this launch.December 2022: ASTRO CL, the smallest member of the Jena-Optronik star sensor family was be used on the new LEO platform from Maxar. Each satellite is equipped with two ASTRO CL sensors, which support the attitude control of these satellites.November 2022: As part of NASA's Artemis I mission, the Orion spacecraft successfully launched into space on November 16, 2022. Two star trackers from Jena-Optronik GmbH guided the Orion on its way to lunar orbit.
9. What pricing options are available for accessing the report?
Pricing options include single-user, multi-user, and enterprise licenses priced at USD 3800, USD 4500, and USD 5800 respectively.
10. Is the market size provided in terms of value or volume?
The market size is provided in terms of value, measured in billion.
11. Are there any specific market keywords associated with the report?
Yes, the market keyword associated with the report is "Satellite Parts and Components Market," which aids in identifying and referencing the specific market segment covered.
12. How do I determine which pricing option suits my needs best?
The pricing options vary based on user requirements and access needs. Individual users may opt for single-user licenses, while businesses requiring broader access may choose multi-user or enterprise licenses for cost-effective access to the report.
13. Are there any additional resources or data provided in the Satellite Parts and Components Market report?
While the report offers comprehensive insights, it's advisable to review the specific contents or supplementary materials provided to ascertain if additional resources or data are available.
14. How can I stay updated on further developments or reports in the Satellite Parts and Components Market?
To stay informed about further developments, trends, and reports in the Satellite Parts and Components Market, consider subscribing to industry newsletters, following relevant companies and organizations, or regularly checking reputable industry news sources and publications.
Methodology
Step 1 - Identification of Relevant Samples Size from Population Database


Step 2 - Approaches for Defining Global Market Size (Value, Volume* & Price*)

Note*: In applicable scenarios
Step 3 - Data Sources
Primary Research
- Web Analytics
- Survey Reports
- Research Institute
- Latest Research Reports
- Opinion Leaders
Secondary Research
- Annual Reports
- White Paper
- Latest Press Release
- Industry Association
- Paid Database
- Investor Presentations

Step 4 - Data Triangulation
Involves using different sources of information in order to increase the validity of a study
These sources are likely to be stakeholders in a program - participants, other researchers, program staff, other community members, and so on.
Then we put all data in single framework & apply various statistical tools to find out the dynamic on the market.
During the analysis stage, feedback from the stakeholder groups would be compared to determine areas of agreement as well as areas of divergence