

Key Insights
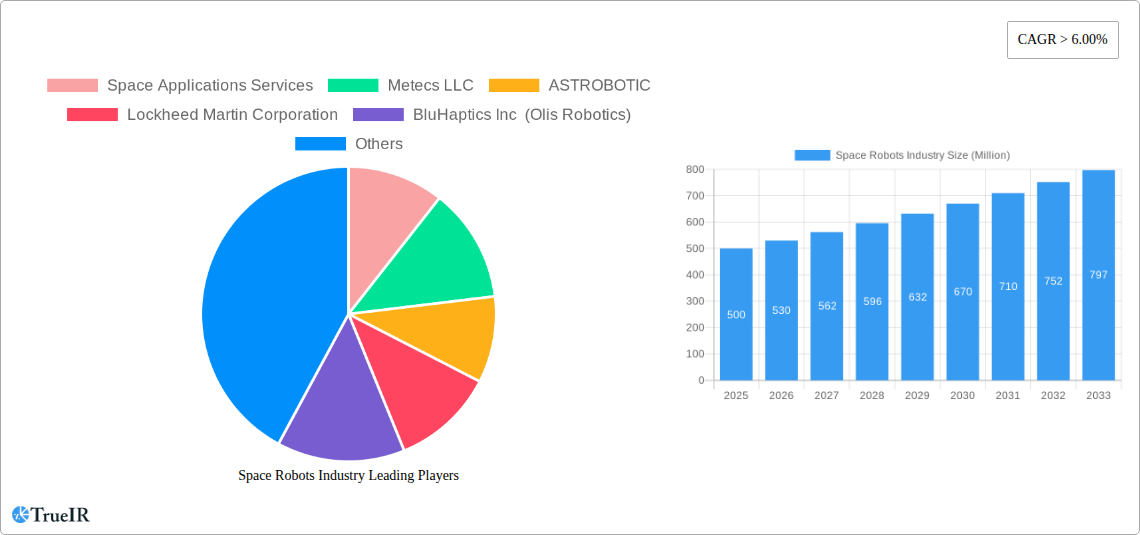
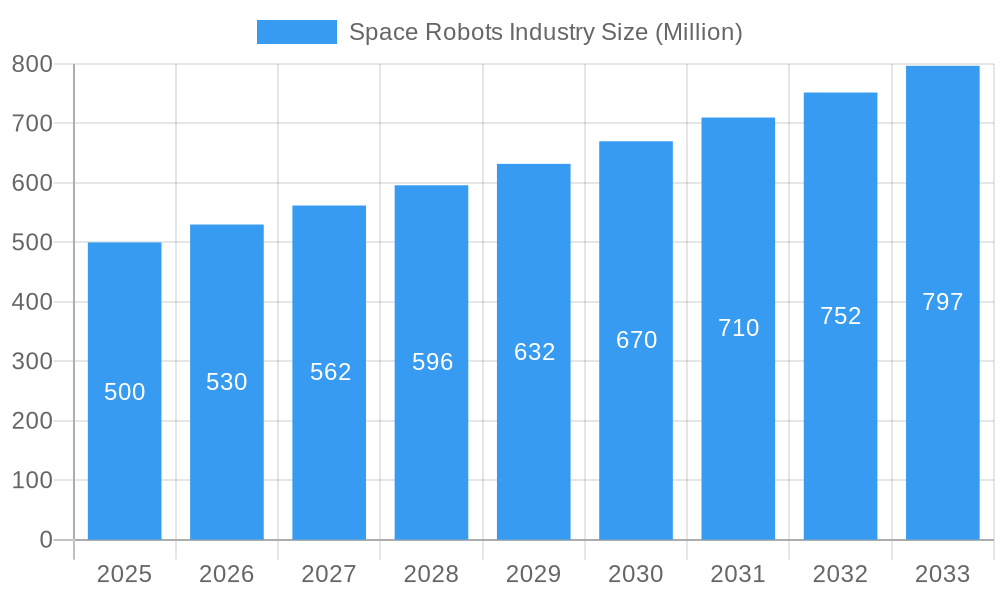
The space robotics market is experiencing robust growth, driven by increasing demand for autonomous systems in space exploration and satellite servicing. With a Compound Annual Growth Rate (CAGR) exceeding 6%, the market, currently valued in the hundreds of millions, is projected to reach billions within the forecast period (2025-2033). Key drivers include the rising number of space missions, both governmental and commercial, the need for efficient and cost-effective satellite maintenance and repair, and advancements in robotics and artificial intelligence (AI) leading to more sophisticated and capable robots. The market is segmented by product type (Rovers/Spacecraft Landers, Space Probes, Robotic Servicing Vehicles, Gripping and Docking Systems, Robotic Arms/Manipulator Systems, and Others) and application (Deep Space and Near Space). While North America currently holds a significant market share due to strong government investment and a robust private space sector, the Asia-Pacific region is expected to witness rapid growth fueled by increasing space exploration initiatives in countries like China, India, and Japan. Challenges include the high cost of developing and deploying space robots, the harsh and unpredictable environment of space, and the need for stringent reliability and safety standards.
Space Robots Industry Market Size (In Million)
The competitive landscape is characterized by a mix of large established aerospace companies like Lockheed Martin and Northrop Grumman, alongside innovative smaller players specializing in niche technologies like BluHaptics and Honeybee Robotics. These companies are continuously investing in research and development to improve the capabilities of space robots, including enhancing dexterity, autonomy, and resilience to the space environment. The integration of AI and machine learning is expected to further revolutionize the field, enabling robots to perform increasingly complex tasks with minimal human intervention. Furthermore, the growing focus on sustainability in space operations is driving the development of robots capable of performing in-orbit servicing and debris removal, which will significantly contribute to the market's expansion. This convergence of technological advancements and growing demand positions the space robotics market for considerable future growth and innovation.
Space Robots Industry Company Market Share
Space Robots Industry: A Comprehensive Market Report (2019-2033)
This dynamic report provides a detailed analysis of the burgeoning Space Robots Industry, offering invaluable insights for investors, industry professionals, and strategic decision-makers. Covering the period from 2019 to 2033, with a focus on 2025, this comprehensive study delves into market structure, competitive dynamics, technological advancements, and future growth projections. The global space robots market is projected to reach xx Million by 2033, exhibiting a CAGR of xx% during the forecast period (2025-2033).
Space Robots Industry Market Structure & Competitive Landscape
The Space Robots Industry is characterized by a moderately concentrated market structure, with key players like Lockheed Martin Corporation, Northrop Grumman Corporation, and Maxar Technologies Ltd holding significant market share. However, the emergence of innovative startups like GITAI Inc and Astrobotic is fostering increased competition. The industry is driven by technological advancements in robotics, AI, and miniaturization, alongside increasing demand for autonomous operations in space exploration and commercial activities. Regulatory frameworks, particularly those concerning space debris mitigation and international space law, significantly impact industry growth. Product substitutes, while limited, include human-operated spacecraft, which are increasingly less cost-effective for many tasks. End-user segmentation includes government space agencies (NASA, ESA, JAXA), commercial space companies (SpaceX, Blue Origin), and telecommunication providers.
M&A activity has been moderate in recent years, with a total estimated value of xx Million in deals between 2019 and 2024. This signifies strategic moves by established players to acquire niche technologies and expand their product portfolios. Future M&A activity is expected to increase as the market expands and competition intensifies. The Herfindahl-Hirschman Index (HHI) for the industry stands at approximately xx in 2025, suggesting a moderately concentrated market.
Space Robots Industry Market Trends & Opportunities
The Space Robots market is experiencing significant growth, driven by several key factors. The increasing demand for cost-effective and reliable space exploration solutions is a primary driver. Technological advancements, such as improved AI and machine learning algorithms for autonomous navigation and task execution, are enhancing the capabilities of space robots, making them more versatile and efficient. The rising adoption of robotic solutions in various space applications, including satellite servicing, lunar exploration, and deep-space missions, is fueling market expansion. Additionally, the growing commercialization of space, with the rise of private space companies, is creating new opportunities for space robotics solutions. Consumer preferences are shifting towards more autonomous and sophisticated robots, demanding higher levels of precision, dexterity, and intelligence. Competitive dynamics are shaping the landscape through innovation, strategic partnerships, and investments in research and development. Market penetration rates for robotic solutions in space exploration are projected to reach xx% by 2033, demonstrating significant market expansion. The market is expected to be highly competitive, with significant investments in R&D, and several companies vying for market share.
Dominant Markets & Segments in Space Robots Industry
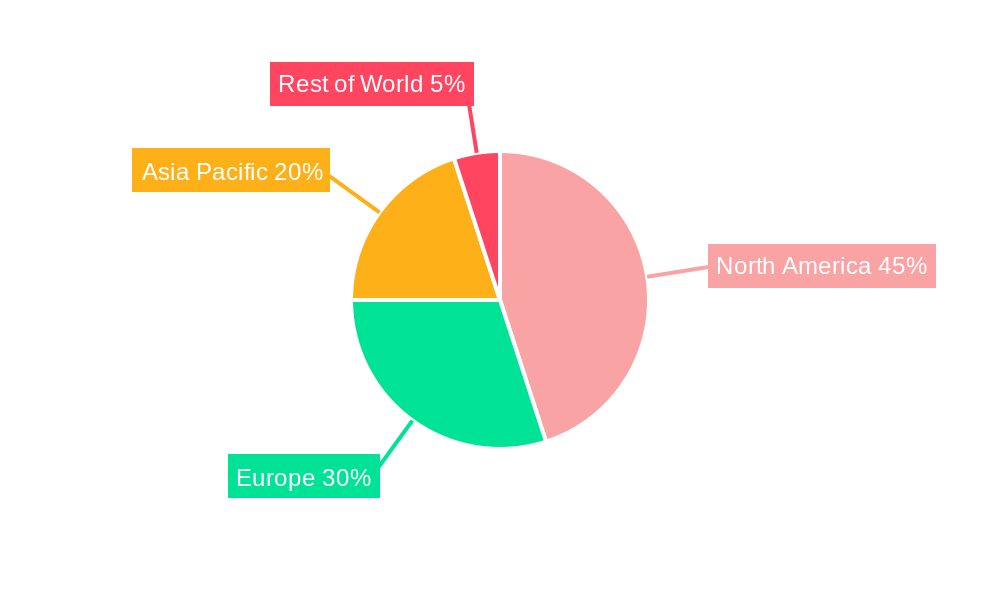
The North American region currently dominates the global Space Robots market, driven by significant government investment in space exploration and a robust commercial space sector. Within product segments, Robotic Arms/Manipulator Systems and Robotic Servicing Vehicles are experiencing the fastest growth. Deep space applications currently represent a larger market segment compared to near space, primarily due to the complexities and higher costs associated with deep space missions.
Key Growth Drivers:
- Significant government funding for space exploration.
- Increasing commercialization of space activities.
- Technological advancements in robotics and AI.
- Demand for cost-effective and reliable space operations.
Market Dominance Analysis: The dominance of North America is largely attributed to the presence of major players, such as Lockheed Martin and Northrop Grumman, and strong government support for space research and exploration initiatives. The robust private space sector in the region is also contributing to market expansion. However, other regions, including Europe and Asia, are witnessing significant growth in this sector and are expected to gain greater market share in the coming years. The increasing investment in space exploration projects globally, coupled with technological advancements, presents lucrative growth opportunities for all segments.
Space Robots Industry Product Analysis
Technological advancements in areas such as AI, machine learning, and advanced materials are driving significant innovation in space robots. The market is witnessing a shift towards more autonomous and intelligent robots capable of performing complex tasks without human intervention. New products are designed for specific applications, optimizing functionality and efficiency. These innovations are improving the cost-effectiveness and reliability of space missions, leading to greater market penetration across various segments, from deep space exploration to satellite servicing. The competitive advantage lies in offering superior precision, autonomy, and durability, coupled with a strong understanding of specific mission requirements.
Key Drivers, Barriers & Challenges in Space Robots Industry
Key Drivers:
- Increasing demand for autonomous space exploration and operations.
- Technological advancements in robotics, AI, and sensor technologies.
- Government and private sector investments in space exploration.
- The need for cost-effective and reliable solutions for space missions.
Challenges and Restraints:
- High development and deployment costs associated with space robots.
- Harsh environmental conditions in space demanding highly robust designs.
- Regulatory complexities related to space operations and licensing.
- Supply chain challenges in procuring specialized components and materials.
- Competition from established players and emerging startups.
Growth Drivers in the Space Robots Industry Market
The growth of the space robots industry is primarily driven by increasing government funding for space exploration programs, the commercialization of space, and advancements in robotics and AI technologies. These factors are contributing to greater demand for robotic solutions in space operations, boosting market expansion. Further advancements in miniaturization and power efficiency of space robots will lead to new applications and accelerate market growth.
Challenges Impacting Space Robots Industry Growth
Several challenges hinder the growth of the space robots industry. These include high development and deployment costs, the harsh space environment, regulatory complexities, supply chain vulnerabilities, and intense competition. Overcoming these obstacles is crucial for realizing the full potential of the space robots market. For instance, supply chain disruptions can lead to significant delays and increased costs, impacting project timelines and profitability.
Key Players Shaping the Space Robots Industry Market
- Space Applications Services
- Metecs LLC
- ASTROBOTIC
- Lockheed Martin Corporation
- BluHaptics Inc (Olis Robotics)
- Motiv Space Systems Inc
- Honeybee Robotics
- Oceaneering International
- Effective Space Solutions Limited
- MDA Corporation (Maxar Technologies Ltd)
- GITAI Inc
- Made in Space
- Northrop Grumman Corporation
Significant Space Robots Industry Milestones
- 2020: Successful testing of a robotic arm for space debris removal.
- 2021: Launch of a commercial robotic mission to the moon.
- 2022: Development of a new generation of autonomous navigation systems for space robots.
- 2023: Successful demonstration of a robotic system for in-orbit satellite servicing.
- 2024: Announced partnerships between leading space agencies and commercial space companies to collaborate on space robotics projects.
Future Outlook for Space Robots Industry Market
The future of the Space Robots Industry appears exceptionally promising. Continued advancements in robotics, AI, and miniaturization, coupled with increasing government and commercial investment in space exploration, will drive substantial market growth. Strategic partnerships and collaborations will play a crucial role in accelerating innovation and expanding market reach. The development of new applications for space robots, such as resource extraction from asteroids and the construction of lunar bases, presents significant opportunities for market expansion. The global market is poised for substantial growth, with the potential for significant returns on investment.
Space Robots Industry Segmentation
- 1. Production Analysis
- 2. Consumption Analysis
- 3. Import Market Analysis (Value & Volume)
- 4. Export Market Analysis (Value & Volume)
- 5. Price Trend Analysis
Space Robots Industry Segmentation By Geography
-
1. North America
- 1.1. United States
- 1.2. Canada
- 1.3. Mexico
-
2. South America
- 2.1. Brazil
- 2.2. Argentina
- 2.3. Rest of South America
-
3. Europe
- 3.1. United Kingdom
- 3.2. Germany
- 3.3. France
- 3.4. Italy
- 3.5. Spain
- 3.6. Russia
- 3.7. Benelux
- 3.8. Nordics
- 3.9. Rest of Europe
-
4. Middle East & Africa
- 4.1. Turkey
- 4.2. Israel
- 4.3. GCC
- 4.4. North Africa
- 4.5. South Africa
- 4.6. Rest of Middle East & Africa
-
5. Asia Pacific
- 5.1. China
- 5.2. India
- 5.3. Japan
- 5.4. South Korea
- 5.5. ASEAN
- 5.6. Oceania
- 5.7. Rest of Asia Pacific
Space Robots Industry Regional Market Share
Geographic Coverage of Space Robots Industry
Space Robots Industry REPORT HIGHLIGHTS
| Aspects | Details |
|---|---|
| Study Period | 2020-2034 |
| Base Year | 2025 |
| Estimated Year | 2026 |
| Forecast Period | 2026-2034 |
| Historical Period | 2020-2025 |
| Growth Rate | CAGR of 8.7% from 2020-2034 |
| Segmentation |
|
Table of Contents
- 1. Introduction
- 1.1. Research Scope
- 1.2. Market Segmentation
- 1.3. Research Objective
- 1.4. Definitions and Assumptions
- 2. Executive Summary
- 2.1. Market Snapshot
- 3. Market Dynamics
- 3.1. Market Drivers
- 3.2. Market Restrains
- 3.3. Market Trends
- 3.4. Market Opportunities
- 4. Market Factor Analysis
- 4.1. Porters Five Forces
- 4.1.1. Bargaining Power of Suppliers
- 4.1.2. Bargaining Power of Buyers
- 4.1.3. Threat of New Entrants
- 4.1.4. Threat of Substitutes
- 4.1.5. Competitive Rivalry
- 4.2. PESTEL analysis
- 4.3. BCG Analysis
- 4.3.1. Stars (High Growth, High Market Share)
- 4.3.2. Cash Cows (Low Growth, High Market Share)
- 4.3.3. Question Mark (High Growth, Low Market Share)
- 4.3.4. Dogs (Low Growth, Low Market Share)
- 4.4. Ansoff Matrix Analysis
- 4.5. Supply Chain Analysis
- 4.6. Regulatory Landscape
- 4.7. Current Market Potential and Opportunity Assessment (TAM–SAM–SOM Framework)
- 4.8. TIR Analyst Note
- 4.1. Porters Five Forces
- 5. Market Analysis, Insights and Forecast 2021-2033
- 5.1. Market Analysis, Insights and Forecast - by Production Analysis
- 5.2. Market Analysis, Insights and Forecast - by Consumption Analysis
- 5.3. Market Analysis, Insights and Forecast - by Import Market Analysis (Value & Volume)
- 5.4. Market Analysis, Insights and Forecast - by Export Market Analysis (Value & Volume)
- 5.5. Market Analysis, Insights and Forecast - by Price Trend Analysis
- 5.6. Market Analysis, Insights and Forecast - by Region
- 5.6.1. North America
- 5.6.2. South America
- 5.6.3. Europe
- 5.6.4. Middle East & Africa
- 5.6.5. Asia Pacific
- 6. Global Space Robots Industry Analysis, Insights and Forecast, 2021-2033
- 6.1. Market Analysis, Insights and Forecast - by Production Analysis
- 6.2. Market Analysis, Insights and Forecast - by Consumption Analysis
- 6.3. Market Analysis, Insights and Forecast - by Import Market Analysis (Value & Volume)
- 6.4. Market Analysis, Insights and Forecast - by Export Market Analysis (Value & Volume)
- 6.5. Market Analysis, Insights and Forecast - by Price Trend Analysis
- 7. North America Space Robots Industry Analysis, Insights and Forecast, 2020-2032
- 7.1. Market Analysis, Insights and Forecast - by Production Analysis
- 7.2. Market Analysis, Insights and Forecast - by Consumption Analysis
- 7.3. Market Analysis, Insights and Forecast - by Import Market Analysis (Value & Volume)
- 7.4. Market Analysis, Insights and Forecast - by Export Market Analysis (Value & Volume)
- 7.5. Market Analysis, Insights and Forecast - by Price Trend Analysis
- 8. South America Space Robots Industry Analysis, Insights and Forecast, 2020-2032
- 8.1. Market Analysis, Insights and Forecast - by Production Analysis
- 8.2. Market Analysis, Insights and Forecast - by Consumption Analysis
- 8.3. Market Analysis, Insights and Forecast - by Import Market Analysis (Value & Volume)
- 8.4. Market Analysis, Insights and Forecast - by Export Market Analysis (Value & Volume)
- 8.5. Market Analysis, Insights and Forecast - by Price Trend Analysis
- 9. Europe Space Robots Industry Analysis, Insights and Forecast, 2020-2032
- 9.1. Market Analysis, Insights and Forecast - by Production Analysis
- 9.2. Market Analysis, Insights and Forecast - by Consumption Analysis
- 9.3. Market Analysis, Insights and Forecast - by Import Market Analysis (Value & Volume)
- 9.4. Market Analysis, Insights and Forecast - by Export Market Analysis (Value & Volume)
- 9.5. Market Analysis, Insights and Forecast - by Price Trend Analysis
- 10. Middle East & Africa Space Robots Industry Analysis, Insights and Forecast, 2020-2032
- 10.1. Market Analysis, Insights and Forecast - by Production Analysis
- 10.2. Market Analysis, Insights and Forecast - by Consumption Analysis
- 10.3. Market Analysis, Insights and Forecast - by Import Market Analysis (Value & Volume)
- 10.4. Market Analysis, Insights and Forecast - by Export Market Analysis (Value & Volume)
- 10.5. Market Analysis, Insights and Forecast - by Price Trend Analysis
- 11. Asia Pacific Space Robots Industry Analysis, Insights and Forecast, 2020-2032
- 11.1. Market Analysis, Insights and Forecast - by Production Analysis
- 11.2. Market Analysis, Insights and Forecast - by Consumption Analysis
- 11.3. Market Analysis, Insights and Forecast - by Import Market Analysis (Value & Volume)
- 11.4. Market Analysis, Insights and Forecast - by Export Market Analysis (Value & Volume)
- 11.5. Market Analysis, Insights and Forecast - by Price Trend Analysis
- 12. Competitive Analysis
- 12.1. Company Profiles
- 12.1.1 Space Applications Services
- 12.1.1.1. Company Overview
- 12.1.1.2. Products
- 12.1.1.3. Company Financials
- 12.1.1.4. SWOT Analysis
- 12.1.2 Metecs LLC
- 12.1.2.1. Company Overview
- 12.1.2.2. Products
- 12.1.2.3. Company Financials
- 12.1.2.4. SWOT Analysis
- 12.1.3 ASTROBOTIC
- 12.1.3.1. Company Overview
- 12.1.3.2. Products
- 12.1.3.3. Company Financials
- 12.1.3.4. SWOT Analysis
- 12.1.4 Lockheed Martin Corporation
- 12.1.4.1. Company Overview
- 12.1.4.2. Products
- 12.1.4.3. Company Financials
- 12.1.4.4. SWOT Analysis
- 12.1.5 BluHaptics Inc (Olis Robotics)
- 12.1.5.1. Company Overview
- 12.1.5.2. Products
- 12.1.5.3. Company Financials
- 12.1.5.4. SWOT Analysis
- 12.1.6 Motiv Space Systems Inc
- 12.1.6.1. Company Overview
- 12.1.6.2. Products
- 12.1.6.3. Company Financials
- 12.1.6.4. SWOT Analysis
- 12.1.7 Honeybee Robotics
- 12.1.7.1. Company Overview
- 12.1.7.2. Products
- 12.1.7.3. Company Financials
- 12.1.7.4. SWOT Analysis
- 12.1.8 Oceaneering International
- 12.1.8.1. Company Overview
- 12.1.8.2. Products
- 12.1.8.3. Company Financials
- 12.1.8.4. SWOT Analysis
- 12.1.9 Effective Space Solutions Limited
- 12.1.9.1. Company Overview
- 12.1.9.2. Products
- 12.1.9.3. Company Financials
- 12.1.9.4. SWOT Analysis
- 12.1.10 MDA Corporation (Maxar Technologies Ltd)
- 12.1.10.1. Company Overview
- 12.1.10.2. Products
- 12.1.10.3. Company Financials
- 12.1.10.4. SWOT Analysis
- 12.1.11 GITAI Inc **List Not Exhaustive
- 12.1.11.1. Company Overview
- 12.1.11.2. Products
- 12.1.11.3. Company Financials
- 12.1.11.4. SWOT Analysis
- 12.1.12 Made in Space
- 12.1.12.1. Company Overview
- 12.1.12.2. Products
- 12.1.12.3. Company Financials
- 12.1.12.4. SWOT Analysis
- 12.1.13 Northrop Grumman Corporation
- 12.1.13.1. Company Overview
- 12.1.13.2. Products
- 12.1.13.3. Company Financials
- 12.1.13.4. SWOT Analysis
- 12.1.1 Space Applications Services
- 12.2. Market Entropy
- 12.2.1 Company's Key Areas Served
- 12.2.2 Recent Developments
- 12.3. Company Market Share Analysis 2025
- 12.3.1 Top 5 Companies Market Share Analysis
- 12.3.2 Top 3 Companies Market Share Analysis
- 12.4. List of Potential Customers
- 13. Research Methodology
List of Figures
- Figure 1: Global Space Robots Industry Revenue Breakdown (billion, %) by Region 2025 & 2033
- Figure 2: North America Space Robots Industry Revenue (billion), by Production Analysis 2025 & 2033
- Figure 3: North America Space Robots Industry Revenue Share (%), by Production Analysis 2025 & 2033
- Figure 4: North America Space Robots Industry Revenue (billion), by Consumption Analysis 2025 & 2033
- Figure 5: North America Space Robots Industry Revenue Share (%), by Consumption Analysis 2025 & 2033
- Figure 6: North America Space Robots Industry Revenue (billion), by Import Market Analysis (Value & Volume) 2025 & 2033
- Figure 7: North America Space Robots Industry Revenue Share (%), by Import Market Analysis (Value & Volume) 2025 & 2033
- Figure 8: North America Space Robots Industry Revenue (billion), by Export Market Analysis (Value & Volume) 2025 & 2033
- Figure 9: North America Space Robots Industry Revenue Share (%), by Export Market Analysis (Value & Volume) 2025 & 2033
- Figure 10: North America Space Robots Industry Revenue (billion), by Price Trend Analysis 2025 & 2033
- Figure 11: North America Space Robots Industry Revenue Share (%), by Price Trend Analysis 2025 & 2033
- Figure 12: North America Space Robots Industry Revenue (billion), by Country 2025 & 2033
- Figure 13: North America Space Robots Industry Revenue Share (%), by Country 2025 & 2033
- Figure 14: South America Space Robots Industry Revenue (billion), by Production Analysis 2025 & 2033
- Figure 15: South America Space Robots Industry Revenue Share (%), by Production Analysis 2025 & 2033
- Figure 16: South America Space Robots Industry Revenue (billion), by Consumption Analysis 2025 & 2033
- Figure 17: South America Space Robots Industry Revenue Share (%), by Consumption Analysis 2025 & 2033
- Figure 18: South America Space Robots Industry Revenue (billion), by Import Market Analysis (Value & Volume) 2025 & 2033
- Figure 19: South America Space Robots Industry Revenue Share (%), by Import Market Analysis (Value & Volume) 2025 & 2033
- Figure 20: South America Space Robots Industry Revenue (billion), by Export Market Analysis (Value & Volume) 2025 & 2033
- Figure 21: South America Space Robots Industry Revenue Share (%), by Export Market Analysis (Value & Volume) 2025 & 2033
- Figure 22: South America Space Robots Industry Revenue (billion), by Price Trend Analysis 2025 & 2033
- Figure 23: South America Space Robots Industry Revenue Share (%), by Price Trend Analysis 2025 & 2033
- Figure 24: South America Space Robots Industry Revenue (billion), by Country 2025 & 2033
- Figure 25: South America Space Robots Industry Revenue Share (%), by Country 2025 & 2033
- Figure 26: Europe Space Robots Industry Revenue (billion), by Production Analysis 2025 & 2033
- Figure 27: Europe Space Robots Industry Revenue Share (%), by Production Analysis 2025 & 2033
- Figure 28: Europe Space Robots Industry Revenue (billion), by Consumption Analysis 2025 & 2033
- Figure 29: Europe Space Robots Industry Revenue Share (%), by Consumption Analysis 2025 & 2033
- Figure 30: Europe Space Robots Industry Revenue (billion), by Import Market Analysis (Value & Volume) 2025 & 2033
- Figure 31: Europe Space Robots Industry Revenue Share (%), by Import Market Analysis (Value & Volume) 2025 & 2033
- Figure 32: Europe Space Robots Industry Revenue (billion), by Export Market Analysis (Value & Volume) 2025 & 2033
- Figure 33: Europe Space Robots Industry Revenue Share (%), by Export Market Analysis (Value & Volume) 2025 & 2033
- Figure 34: Europe Space Robots Industry Revenue (billion), by Price Trend Analysis 2025 & 2033
- Figure 35: Europe Space Robots Industry Revenue Share (%), by Price Trend Analysis 2025 & 2033
- Figure 36: Europe Space Robots Industry Revenue (billion), by Country 2025 & 2033
- Figure 37: Europe Space Robots Industry Revenue Share (%), by Country 2025 & 2033
- Figure 38: Middle East & Africa Space Robots Industry Revenue (billion), by Production Analysis 2025 & 2033
- Figure 39: Middle East & Africa Space Robots Industry Revenue Share (%), by Production Analysis 2025 & 2033
- Figure 40: Middle East & Africa Space Robots Industry Revenue (billion), by Consumption Analysis 2025 & 2033
- Figure 41: Middle East & Africa Space Robots Industry Revenue Share (%), by Consumption Analysis 2025 & 2033
- Figure 42: Middle East & Africa Space Robots Industry Revenue (billion), by Import Market Analysis (Value & Volume) 2025 & 2033
- Figure 43: Middle East & Africa Space Robots Industry Revenue Share (%), by Import Market Analysis (Value & Volume) 2025 & 2033
- Figure 44: Middle East & Africa Space Robots Industry Revenue (billion), by Export Market Analysis (Value & Volume) 2025 & 2033
- Figure 45: Middle East & Africa Space Robots Industry Revenue Share (%), by Export Market Analysis (Value & Volume) 2025 & 2033
- Figure 46: Middle East & Africa Space Robots Industry Revenue (billion), by Price Trend Analysis 2025 & 2033
- Figure 47: Middle East & Africa Space Robots Industry Revenue Share (%), by Price Trend Analysis 2025 & 2033
- Figure 48: Middle East & Africa Space Robots Industry Revenue (billion), by Country 2025 & 2033
- Figure 49: Middle East & Africa Space Robots Industry Revenue Share (%), by Country 2025 & 2033
- Figure 50: Asia Pacific Space Robots Industry Revenue (billion), by Production Analysis 2025 & 2033
- Figure 51: Asia Pacific Space Robots Industry Revenue Share (%), by Production Analysis 2025 & 2033
- Figure 52: Asia Pacific Space Robots Industry Revenue (billion), by Consumption Analysis 2025 & 2033
- Figure 53: Asia Pacific Space Robots Industry Revenue Share (%), by Consumption Analysis 2025 & 2033
- Figure 54: Asia Pacific Space Robots Industry Revenue (billion), by Import Market Analysis (Value & Volume) 2025 & 2033
- Figure 55: Asia Pacific Space Robots Industry Revenue Share (%), by Import Market Analysis (Value & Volume) 2025 & 2033
- Figure 56: Asia Pacific Space Robots Industry Revenue (billion), by Export Market Analysis (Value & Volume) 2025 & 2033
- Figure 57: Asia Pacific Space Robots Industry Revenue Share (%), by Export Market Analysis (Value & Volume) 2025 & 2033
- Figure 58: Asia Pacific Space Robots Industry Revenue (billion), by Price Trend Analysis 2025 & 2033
- Figure 59: Asia Pacific Space Robots Industry Revenue Share (%), by Price Trend Analysis 2025 & 2033
- Figure 60: Asia Pacific Space Robots Industry Revenue (billion), by Country 2025 & 2033
- Figure 61: Asia Pacific Space Robots Industry Revenue Share (%), by Country 2025 & 2033
List of Tables
- Table 1: Global Space Robots Industry Revenue billion Forecast, by Production Analysis 2020 & 2033
- Table 2: Global Space Robots Industry Revenue billion Forecast, by Consumption Analysis 2020 & 2033
- Table 3: Global Space Robots Industry Revenue billion Forecast, by Import Market Analysis (Value & Volume) 2020 & 2033
- Table 4: Global Space Robots Industry Revenue billion Forecast, by Export Market Analysis (Value & Volume) 2020 & 2033
- Table 5: Global Space Robots Industry Revenue billion Forecast, by Price Trend Analysis 2020 & 2033
- Table 6: Global Space Robots Industry Revenue billion Forecast, by Region 2020 & 2033
- Table 7: Global Space Robots Industry Revenue billion Forecast, by Production Analysis 2020 & 2033
- Table 8: Global Space Robots Industry Revenue billion Forecast, by Consumption Analysis 2020 & 2033
- Table 9: Global Space Robots Industry Revenue billion Forecast, by Import Market Analysis (Value & Volume) 2020 & 2033
- Table 10: Global Space Robots Industry Revenue billion Forecast, by Export Market Analysis (Value & Volume) 2020 & 2033
- Table 11: Global Space Robots Industry Revenue billion Forecast, by Price Trend Analysis 2020 & 2033
- Table 12: Global Space Robots Industry Revenue billion Forecast, by Country 2020 & 2033
- Table 13: United States Space Robots Industry Revenue (billion) Forecast, by Application 2020 & 2033
- Table 14: Canada Space Robots Industry Revenue (billion) Forecast, by Application 2020 & 2033
- Table 15: Mexico Space Robots Industry Revenue (billion) Forecast, by Application 2020 & 2033
- Table 16: Global Space Robots Industry Revenue billion Forecast, by Production Analysis 2020 & 2033
- Table 17: Global Space Robots Industry Revenue billion Forecast, by Consumption Analysis 2020 & 2033
- Table 18: Global Space Robots Industry Revenue billion Forecast, by Import Market Analysis (Value & Volume) 2020 & 2033
- Table 19: Global Space Robots Industry Revenue billion Forecast, by Export Market Analysis (Value & Volume) 2020 & 2033
- Table 20: Global Space Robots Industry Revenue billion Forecast, by Price Trend Analysis 2020 & 2033
- Table 21: Global Space Robots Industry Revenue billion Forecast, by Country 2020 & 2033
- Table 22: Brazil Space Robots Industry Revenue (billion) Forecast, by Application 2020 & 2033
- Table 23: Argentina Space Robots Industry Revenue (billion) Forecast, by Application 2020 & 2033
- Table 24: Rest of South America Space Robots Industry Revenue (billion) Forecast, by Application 2020 & 2033
- Table 25: Global Space Robots Industry Revenue billion Forecast, by Production Analysis 2020 & 2033
- Table 26: Global Space Robots Industry Revenue billion Forecast, by Consumption Analysis 2020 & 2033
- Table 27: Global Space Robots Industry Revenue billion Forecast, by Import Market Analysis (Value & Volume) 2020 & 2033
- Table 28: Global Space Robots Industry Revenue billion Forecast, by Export Market Analysis (Value & Volume) 2020 & 2033
- Table 29: Global Space Robots Industry Revenue billion Forecast, by Price Trend Analysis 2020 & 2033
- Table 30: Global Space Robots Industry Revenue billion Forecast, by Country 2020 & 2033
- Table 31: United Kingdom Space Robots Industry Revenue (billion) Forecast, by Application 2020 & 2033
- Table 32: Germany Space Robots Industry Revenue (billion) Forecast, by Application 2020 & 2033
- Table 33: France Space Robots Industry Revenue (billion) Forecast, by Application 2020 & 2033
- Table 34: Italy Space Robots Industry Revenue (billion) Forecast, by Application 2020 & 2033
- Table 35: Spain Space Robots Industry Revenue (billion) Forecast, by Application 2020 & 2033
- Table 36: Russia Space Robots Industry Revenue (billion) Forecast, by Application 2020 & 2033
- Table 37: Benelux Space Robots Industry Revenue (billion) Forecast, by Application 2020 & 2033
- Table 38: Nordics Space Robots Industry Revenue (billion) Forecast, by Application 2020 & 2033
- Table 39: Rest of Europe Space Robots Industry Revenue (billion) Forecast, by Application 2020 & 2033
- Table 40: Global Space Robots Industry Revenue billion Forecast, by Production Analysis 2020 & 2033
- Table 41: Global Space Robots Industry Revenue billion Forecast, by Consumption Analysis 2020 & 2033
- Table 42: Global Space Robots Industry Revenue billion Forecast, by Import Market Analysis (Value & Volume) 2020 & 2033
- Table 43: Global Space Robots Industry Revenue billion Forecast, by Export Market Analysis (Value & Volume) 2020 & 2033
- Table 44: Global Space Robots Industry Revenue billion Forecast, by Price Trend Analysis 2020 & 2033
- Table 45: Global Space Robots Industry Revenue billion Forecast, by Country 2020 & 2033
- Table 46: Turkey Space Robots Industry Revenue (billion) Forecast, by Application 2020 & 2033
- Table 47: Israel Space Robots Industry Revenue (billion) Forecast, by Application 2020 & 2033
- Table 48: GCC Space Robots Industry Revenue (billion) Forecast, by Application 2020 & 2033
- Table 49: North Africa Space Robots Industry Revenue (billion) Forecast, by Application 2020 & 2033
- Table 50: South Africa Space Robots Industry Revenue (billion) Forecast, by Application 2020 & 2033
- Table 51: Rest of Middle East & Africa Space Robots Industry Revenue (billion) Forecast, by Application 2020 & 2033
- Table 52: Global Space Robots Industry Revenue billion Forecast, by Production Analysis 2020 & 2033
- Table 53: Global Space Robots Industry Revenue billion Forecast, by Consumption Analysis 2020 & 2033
- Table 54: Global Space Robots Industry Revenue billion Forecast, by Import Market Analysis (Value & Volume) 2020 & 2033
- Table 55: Global Space Robots Industry Revenue billion Forecast, by Export Market Analysis (Value & Volume) 2020 & 2033
- Table 56: Global Space Robots Industry Revenue billion Forecast, by Price Trend Analysis 2020 & 2033
- Table 57: Global Space Robots Industry Revenue billion Forecast, by Country 2020 & 2033
- Table 58: China Space Robots Industry Revenue (billion) Forecast, by Application 2020 & 2033
- Table 59: India Space Robots Industry Revenue (billion) Forecast, by Application 2020 & 2033
- Table 60: Japan Space Robots Industry Revenue (billion) Forecast, by Application 2020 & 2033
- Table 61: South Korea Space Robots Industry Revenue (billion) Forecast, by Application 2020 & 2033
- Table 62: ASEAN Space Robots Industry Revenue (billion) Forecast, by Application 2020 & 2033
- Table 63: Oceania Space Robots Industry Revenue (billion) Forecast, by Application 2020 & 2033
- Table 64: Rest of Asia Pacific Space Robots Industry Revenue (billion) Forecast, by Application 2020 & 2033
Frequently Asked Questions
1. What is the projected Compound Annual Growth Rate (CAGR) of the Space Robots Industry?
The projected CAGR is approximately 8.7%.
2. Which companies are prominent players in the Space Robots Industry?
Key companies in the market include Space Applications Services, Metecs LLC, ASTROBOTIC, Lockheed Martin Corporation, BluHaptics Inc (Olis Robotics), Motiv Space Systems Inc, Honeybee Robotics, Oceaneering International, Effective Space Solutions Limited, MDA Corporation (Maxar Technologies Ltd), GITAI Inc **List Not Exhaustive, Made in Space, Northrop Grumman Corporation.
3. What are the main segments of the Space Robots Industry?
The market segments include Production Analysis, Consumption Analysis, Import Market Analysis (Value & Volume), Export Market Analysis (Value & Volume), Price Trend Analysis.
4. Can you provide details about the market size?
The market size is estimated to be USD 5.71 billion as of 2022.
5. What are some drivers contributing to market growth?
; Increasing Number Of Air Passengers; Use Of Portable Electronic Devices.
6. What are the notable trends driving market growth?
Deep Space Segment is Projected to Register with the Highest CAGR During the Forecast Period.
7. Are there any restraints impacting market growth?
; High Cost Of Connectivity Equipments.
8. Can you provide examples of recent developments in the market?
N/A
9. What pricing options are available for accessing the report?
Pricing options include single-user, multi-user, and enterprise licenses priced at USD 4750, USD 5250, and USD 8750 respectively.
10. Is the market size provided in terms of value or volume?
The market size is provided in terms of value, measured in billion.
11. Are there any specific market keywords associated with the report?
Yes, the market keyword associated with the report is "Space Robots Industry," which aids in identifying and referencing the specific market segment covered.
12. How do I determine which pricing option suits my needs best?
The pricing options vary based on user requirements and access needs. Individual users may opt for single-user licenses, while businesses requiring broader access may choose multi-user or enterprise licenses for cost-effective access to the report.
13. Are there any additional resources or data provided in the Space Robots Industry report?
While the report offers comprehensive insights, it's advisable to review the specific contents or supplementary materials provided to ascertain if additional resources or data are available.
14. How can I stay updated on further developments or reports in the Space Robots Industry?
To stay informed about further developments, trends, and reports in the Space Robots Industry, consider subscribing to industry newsletters, following relevant companies and organizations, or regularly checking reputable industry news sources and publications.
Methodology
Step 1 - Identification of Relevant Samples Size from Population Database


Step 2 - Approaches for Defining Global Market Size (Value, Volume* & Price*)

Note*: In applicable scenarios
Step 3 - Data Sources
Primary Research
- Web Analytics
- Survey Reports
- Research Institute
- Latest Research Reports
- Opinion Leaders
Secondary Research
- Annual Reports
- White Paper
- Latest Press Release
- Industry Association
- Paid Database
- Investor Presentations

Step 4 - Data Triangulation
Involves using different sources of information in order to increase the validity of a study
These sources are likely to be stakeholders in a program - participants, other researchers, program staff, other community members, and so on.
Then we put all data in single framework & apply various statistical tools to find out the dynamic on the market.
During the analysis stage, feedback from the stakeholder groups would be compared to determine areas of agreement as well as areas of divergence