

Key Insights
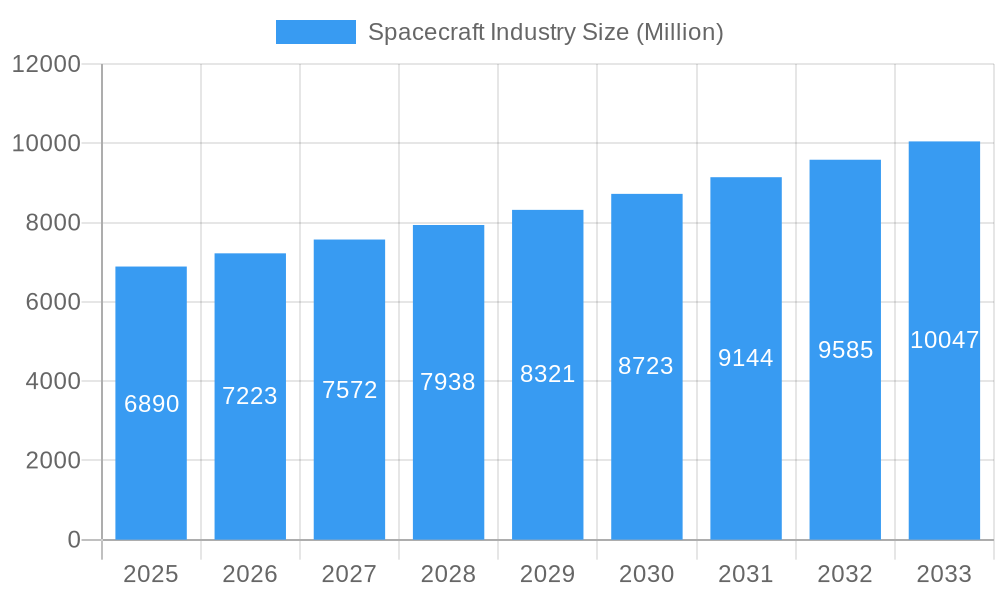
The global spacecraft industry, valued at $6.89 billion in 2025, is projected to experience robust growth, driven by increasing government investments in space exploration, rising demand for satellite-based services (communication, navigation, Earth observation), and advancements in launch vehicle technology. The compound annual growth rate (CAGR) of 4.74% from 2025 to 2033 indicates a significant expansion of the market over the forecast period. Key growth drivers include the commercialization of space, the development of reusable launch systems reducing launch costs, and the growing need for satellite constellations for various applications like broadband internet access and environmental monitoring. The market is segmented by type into manned and unmanned spacecraft, with unmanned spacecraft expected to dominate due to their cost-effectiveness and suitability for various missions. North America and Europe currently hold the largest market share, propelled by established space agencies and a strong private space industry presence. However, the Asia-Pacific region is poised for significant growth, fueled by increasing investments from countries like China and India in their national space programs. Competitive pressures are intensifying with the emergence of both established aerospace giants and innovative new space companies, leading to technological advancements and price reductions. While regulatory hurdles and the high cost of space missions remain significant restraints, the overall outlook for the spacecraft industry is positive, promising substantial growth and innovation in the coming years.
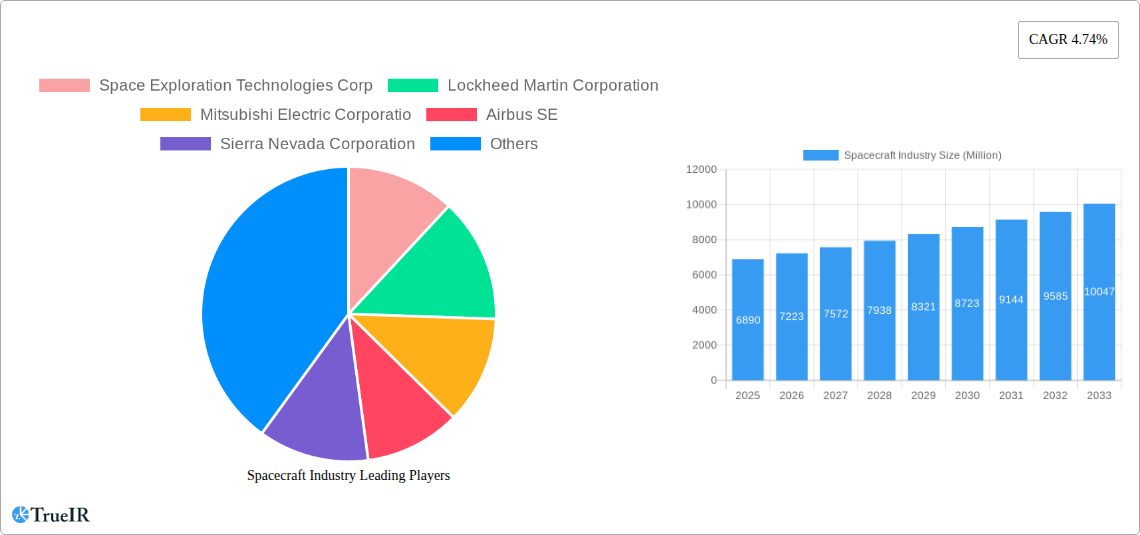
Spacecraft Industry Market Size (In Billion)
The continued miniaturization of satellites, the development of more sophisticated sensors and payloads, and increasing reliance on Artificial Intelligence (AI) and Machine Learning (ML) in space operations are key trends shaping the industry’s trajectory. Growth will be further influenced by collaborations between government and private entities, facilitating technology transfer and lowering barriers to entry for smaller space companies. Despite the challenges, the long-term prospects for the spacecraft industry remain optimistic. The industry's focus on sustainability, reduced space debris, and responsible space exploration practices will increasingly become critical factors influencing its growth and acceptance among stakeholders. The expanding applications of space technologies across various sectors, including defense, telecommunications, and scientific research, will be crucial in driving the future expansion of the market.
Spacecraft Industry Company Market Share
Spacecraft Industry Market Report: 2019-2033
This comprehensive report provides an in-depth analysis of the global spacecraft industry, forecasting market trends and competitive dynamics from 2025 to 2033. With a study period spanning 2019-2033, a base year of 2025, and an estimated year of 2025, this report is essential for businesses, investors, and researchers seeking to understand this rapidly evolving sector. The market size is estimated at xx Million in 2025 and is projected to reach xx Million by 2033, exhibiting a CAGR of xx%.
Spacecraft Industry Market Structure & Competitive Landscape
The global spacecraft industry exhibits a moderately concentrated market structure, with a discernible presence of key players that command a significant portion of market share. The Herfindahl-Hirschman Index (HHI) for this sector is estimated to be around [Insert HHI Value Here], substantiating this moderate concentration. A primary catalyst for industry advancement is continuous innovation, where companies relentlessly pursue the development of cutting-edge technologies to augment spacecraft capabilities, enhance mission efficacy, and critically, drive down operational costs. Navigating the complex landscape of space exploration and utilization is heavily influenced by robust regulatory frameworks, particularly those addressing space debris mitigation strategies and the evolving principles of international space law. While direct product substitutes are limited, the industry encounters competition from alternative methods for satellite deployment and data acquisition. The primary end-user base is predominantly comprised of influential government agencies such as NASA, ESA, and JAXA, alongside commercial satellite operators and esteemed research institutions.
In recent years, Mergers and Acquisitions (M&A) activity has been a notable feature, with an estimated [Insert M&A Volume in Million USD Here] Million in M&A volume recorded in 2024. The strategic drivers behind these M&A endeavors are multifaceted, including the pursuit of economies of scale through consolidation, the acquisition of highly specialized technologies, and the strategic expansion into nascent or underserved market segments. This ongoing trend is anticipated to persist, profoundly reshaping the competitive dynamics and strategic alliances within the industry.
- Market Concentration: Moderately concentrated (HHI: [Insert HHI Value Here])
- Innovation Drivers: Advanced propulsion systems, AI-powered navigation, miniaturization, novel materials
- Regulatory Impacts: Space debris mitigation, orbital slot allocation, launch licensing, international space law compliance, spectrum management
- Product Substitutes: Alternative satellite deployment methods (e.g., new launch architectures), ground-based data acquisition (for specific applications), terrestrial communication networks
- End-User Segmentation: Government agencies (defense, scientific, civil), commercial satellite operators (telecommunications, Earth observation, navigation), research institutions, emerging private space ventures
- M&A Trends: Increasing consolidation for vertical integration, acquisition of disruptive technologies, expansion into new value chains (e.g., in-orbit servicing), strategic partnerships
Spacecraft Industry Market Trends & Opportunities
The spacecraft industry is currently experiencing a period of robust and sustained growth, propelled by a confluence of factors. The escalating demand for advanced satellite-based services across various sectors, coupled with significant advancements in space exploration technologies and the disruptive influence of burgeoning NewSpace companies, are key drivers. The market is undergoing a significant technological metamorphosis, characterized by the increasing adoption of reusable spacecraft, the proliferation of smaller satellite form factors, and the deployment of large satellite constellations. These shifts are instrumental in reducing launch costs and democratizing access to space. Consumer preferences are increasingly leaning towards greater data availability, reliability, and real-time accessibility, thereby fueling a heightened demand for sophisticated satellite technologies. Competitive dynamics are intensifying as both established aerospace behemoths and agile, innovative startups fiercely compete for market dominance. Furthermore, the industry is witnessing the exciting emergence of novel business models, including the burgeoning space tourism sector and the pioneering field of in-space manufacturing, which collectively present substantial and transformative growth opportunities. Market penetration rates for various spacecraft types are demonstrating considerable upward trajectories, with a particularly noteworthy surge observed in the unmanned segment.
Dominant Markets & Segments in Spacecraft Industry
The North American market currently holds the dominant position in the global spacecraft industry, fueled by substantial government investment in space exploration and a strong commercial space sector. However, Asia-Pacific is projected to experience the fastest growth rate over the forecast period due to increased investment and development from nations like Japan, China, and India.
By Type:
- Unmanned Spacecraft: This segment is currently experiencing faster growth than the manned segment, driven by the increasing demand for Earth observation, communication, and navigation satellites.
- Manned Spacecraft: Growth in this segment is expected to be slower, driven primarily by government-funded missions and the commercialization of space tourism.
Key Growth Drivers:
- Government Funding & Policies: Significant investments in space exploration and research programs globally.
- Commercial Demand: Increased demand for satellite-based services such as communication, navigation, and Earth observation.
- Technological Advancements: Innovations in propulsion systems, materials science, and miniaturization.
- Infrastructure Development: Investment in launch facilities and ground support infrastructure.
Spacecraft Industry Product Analysis
Recent innovations in spacecraft technology include reusable launch vehicles, miniaturized satellites, and advanced sensor systems. These advancements are improving mission efficiency, reducing costs, and expanding the range of applications for spacecraft. The competitive advantage lies in offering superior payload capacity, cost-effectiveness, reliability, and innovative features like advanced onboard computing and AI capabilities. The market is seeing increasing demand for customized spacecraft solutions tailored to specific mission needs.
Key Drivers, Barriers & Challenges in Spacecraft Industry
Key Drivers:
- Technological Advancements: Miniaturization, reusable launch vehicles, advanced propulsion systems, and AI-powered navigation.
- Government Initiatives: Increased government funding for space exploration and research.
- Commercialization of Space: Growing private sector investment in space-based businesses.
Key Challenges:
- High Development Costs: Developing and launching spacecraft remains expensive, hindering entry for smaller players. The estimated cost of developing a single spacecraft ranges from 10 Million to xx Million, presenting a significant barrier.
- Regulatory Hurdles: Complex and evolving regulatory environments can pose challenges for spacecraft operations.
- Supply Chain Disruptions: Global supply chain issues can impact the production and launch of spacecraft.
Growth Drivers in the Spacecraft Industry Market
The spacecraft industry's growth is primarily propelled by technological breakthroughs, increased governmental investments in space exploration and defense, and the rise of the commercial space sector. The development of reusable launch systems has significantly lowered costs, stimulating further innovation and growth. The increasing demand for satellite-based services, including communication, navigation, and earth observation, is a crucial factor driving industry expansion. Favorable government policies supporting space exploration and commercial space activities are also positively impacting market growth.
Challenges Impacting Spacecraft Industry Growth
Despite the industry's promising trajectory, several significant hurdles present substantial challenges to its continued growth and expansion. The exceptionally high development costs associated with spacecraft design, manufacturing, and launch remain a primary barrier. Furthermore, the intricate web of stringent regulations and the inherent complexities of international space law create significant operational and legal challenges. The global nature of space activities also exposes the industry to supply chain vulnerabilities and the potential for disruptive events, which can have a profound impact on production timelines and cost management. The intensely competitive environment, characterized by the ongoing rivalry between established aerospace giants and agile new entrants, places considerable pressure on profit margins and necessitates a relentless focus on continuous innovation.
Key Players Shaping the Spacecraft Industry Market
Significant Spacecraft Industry Milestones
- November 2023: Sierra Space introduced its next “Dream Chaser” space shuttle, capable of carrying seven astronauts and contracted for seven cargo missions to the ISS. This signifies a major step towards reusable spacecraft and increased commercial space activity.
- January 2024: Japan's SLIM lunar lander successfully landed and re-established communication, demonstrating advancements in precision landing technology and signaling renewed Japanese ambitions in space exploration. This event highlights cost-reduction strategies that could influence future missions.
Future Outlook for Spacecraft Industry Market
The spacecraft industry is poised for continued growth, driven by technological advancements, increasing demand for satellite-based services, and government investments in space exploration. Strategic opportunities exist in developing reusable spacecraft, enhancing satellite constellations, and expanding into new applications like space tourism and in-space manufacturing. The market potential is substantial, with significant growth expected across various segments, particularly in unmanned spacecraft and emerging markets.
Spacecraft Industry Segmentation
- 1. Production Analysis
- 2. Consumption Analysis
- 3. Import Market Analysis (Value & Volume)
- 4. Export Market Analysis (Value & Volume)
- 5. Price Trend Analysis
Spacecraft Industry Segmentation By Geography
-
1. North America
- 1.1. United States
- 1.2. Canada
- 1.3. Mexico
-
2. South America
- 2.1. Brazil
- 2.2. Argentina
- 2.3. Rest of South America
-
3. Europe
- 3.1. United Kingdom
- 3.2. Germany
- 3.3. France
- 3.4. Italy
- 3.5. Spain
- 3.6. Russia
- 3.7. Benelux
- 3.8. Nordics
- 3.9. Rest of Europe
-
4. Middle East & Africa
- 4.1. Turkey
- 4.2. Israel
- 4.3. GCC
- 4.4. North Africa
- 4.5. South Africa
- 4.6. Rest of Middle East & Africa
-
5. Asia Pacific
- 5.1. China
- 5.2. India
- 5.3. Japan
- 5.4. South Korea
- 5.5. ASEAN
- 5.6. Oceania
- 5.7. Rest of Asia Pacific
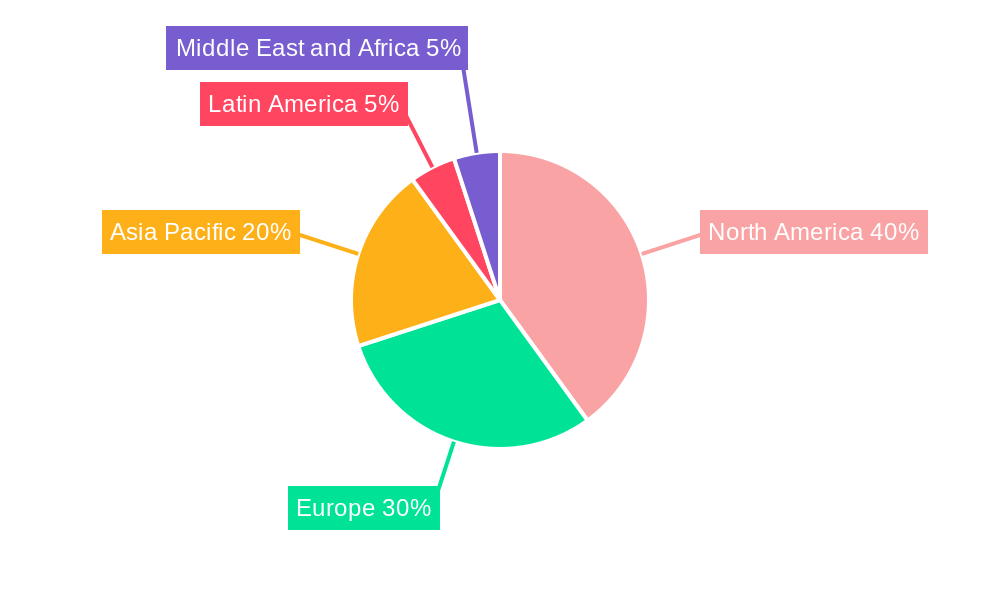
Spacecraft Industry Regional Market Share
Geographic Coverage of Spacecraft Industry
Spacecraft Industry REPORT HIGHLIGHTS
| Aspects | Details |
|---|---|
| Study Period | 2020-2034 |
| Base Year | 2025 |
| Estimated Year | 2026 |
| Forecast Period | 2026-2034 |
| Historical Period | 2020-2025 |
| Growth Rate | CAGR of 4.74% from 2020-2034 |
| Segmentation |
|
Table of Contents
- 1. Introduction
- 1.1. Research Scope
- 1.2. Market Segmentation
- 1.3. Research Objective
- 1.4. Definitions and Assumptions
- 2. Executive Summary
- 2.1. Market Snapshot
- 3. Market Dynamics
- 3.1. Market Drivers
- 3.2. Market Restrains
- 3.3. Market Trends
- 3.4. Market Opportunities
- 4. Market Factor Analysis
- 4.1. Porters Five Forces
- 4.1.1. Bargaining Power of Suppliers
- 4.1.2. Bargaining Power of Buyers
- 4.1.3. Threat of New Entrants
- 4.1.4. Threat of Substitutes
- 4.1.5. Competitive Rivalry
- 4.2. PESTEL analysis
- 4.3. BCG Analysis
- 4.3.1. Stars (High Growth, High Market Share)
- 4.3.2. Cash Cows (Low Growth, High Market Share)
- 4.3.3. Question Mark (High Growth, Low Market Share)
- 4.3.4. Dogs (Low Growth, Low Market Share)
- 4.4. Ansoff Matrix Analysis
- 4.5. Supply Chain Analysis
- 4.6. Regulatory Landscape
- 4.7. Current Market Potential and Opportunity Assessment (TAM–SAM–SOM Framework)
- 4.8. TIR Analyst Note
- 4.1. Porters Five Forces
- 5. Market Analysis, Insights and Forecast 2021-2033
- 5.1. Market Analysis, Insights and Forecast - by Production Analysis
- 5.2. Market Analysis, Insights and Forecast - by Consumption Analysis
- 5.3. Market Analysis, Insights and Forecast - by Import Market Analysis (Value & Volume)
- 5.4. Market Analysis, Insights and Forecast - by Export Market Analysis (Value & Volume)
- 5.5. Market Analysis, Insights and Forecast - by Price Trend Analysis
- 5.6. Market Analysis, Insights and Forecast - by Region
- 5.6.1. North America
- 5.6.2. South America
- 5.6.3. Europe
- 5.6.4. Middle East & Africa
- 5.6.5. Asia Pacific
- 6. Global Spacecraft Industry Analysis, Insights and Forecast, 2021-2033
- 6.1. Market Analysis, Insights and Forecast - by Production Analysis
- 6.2. Market Analysis, Insights and Forecast - by Consumption Analysis
- 6.3. Market Analysis, Insights and Forecast - by Import Market Analysis (Value & Volume)
- 6.4. Market Analysis, Insights and Forecast - by Export Market Analysis (Value & Volume)
- 6.5. Market Analysis, Insights and Forecast - by Price Trend Analysis
- 7. North America Spacecraft Industry Analysis, Insights and Forecast, 2020-2032
- 7.1. Market Analysis, Insights and Forecast - by Production Analysis
- 7.2. Market Analysis, Insights and Forecast - by Consumption Analysis
- 7.3. Market Analysis, Insights and Forecast - by Import Market Analysis (Value & Volume)
- 7.4. Market Analysis, Insights and Forecast - by Export Market Analysis (Value & Volume)
- 7.5. Market Analysis, Insights and Forecast - by Price Trend Analysis
- 8. South America Spacecraft Industry Analysis, Insights and Forecast, 2020-2032
- 8.1. Market Analysis, Insights and Forecast - by Production Analysis
- 8.2. Market Analysis, Insights and Forecast - by Consumption Analysis
- 8.3. Market Analysis, Insights and Forecast - by Import Market Analysis (Value & Volume)
- 8.4. Market Analysis, Insights and Forecast - by Export Market Analysis (Value & Volume)
- 8.5. Market Analysis, Insights and Forecast - by Price Trend Analysis
- 9. Europe Spacecraft Industry Analysis, Insights and Forecast, 2020-2032
- 9.1. Market Analysis, Insights and Forecast - by Production Analysis
- 9.2. Market Analysis, Insights and Forecast - by Consumption Analysis
- 9.3. Market Analysis, Insights and Forecast - by Import Market Analysis (Value & Volume)
- 9.4. Market Analysis, Insights and Forecast - by Export Market Analysis (Value & Volume)
- 9.5. Market Analysis, Insights and Forecast - by Price Trend Analysis
- 10. Middle East & Africa Spacecraft Industry Analysis, Insights and Forecast, 2020-2032
- 10.1. Market Analysis, Insights and Forecast - by Production Analysis
- 10.2. Market Analysis, Insights and Forecast - by Consumption Analysis
- 10.3. Market Analysis, Insights and Forecast - by Import Market Analysis (Value & Volume)
- 10.4. Market Analysis, Insights and Forecast - by Export Market Analysis (Value & Volume)
- 10.5. Market Analysis, Insights and Forecast - by Price Trend Analysis
- 11. Asia Pacific Spacecraft Industry Analysis, Insights and Forecast, 2020-2032
- 11.1. Market Analysis, Insights and Forecast - by Production Analysis
- 11.2. Market Analysis, Insights and Forecast - by Consumption Analysis
- 11.3. Market Analysis, Insights and Forecast - by Import Market Analysis (Value & Volume)
- 11.4. Market Analysis, Insights and Forecast - by Export Market Analysis (Value & Volume)
- 11.5. Market Analysis, Insights and Forecast - by Price Trend Analysis
- 12. Competitive Analysis
- 12.1. Company Profiles
- 12.1.1 Space Exploration Technologies Corp
- 12.1.1.1. Company Overview
- 12.1.1.2. Products
- 12.1.1.3. Company Financials
- 12.1.1.4. SWOT Analysis
- 12.1.2 Lockheed Martin Corporation
- 12.1.2.1. Company Overview
- 12.1.2.2. Products
- 12.1.2.3. Company Financials
- 12.1.2.4. SWOT Analysis
- 12.1.3 Mitsubishi Electric Corporatio
- 12.1.3.1. Company Overview
- 12.1.3.2. Products
- 12.1.3.3. Company Financials
- 12.1.3.4. SWOT Analysis
- 12.1.4 Airbus SE
- 12.1.4.1. Company Overview
- 12.1.4.2. Products
- 12.1.4.3. Company Financials
- 12.1.4.4. SWOT Analysis
- 12.1.5 Sierra Nevada Corporation
- 12.1.5.1. Company Overview
- 12.1.5.2. Products
- 12.1.5.3. Company Financials
- 12.1.5.4. SWOT Analysis
- 12.1.6 QinetiQ Group
- 12.1.6.1. Company Overview
- 12.1.6.2. Products
- 12.1.6.3. Company Financials
- 12.1.6.4. SWOT Analysis
- 12.1.7 OHB SE
- 12.1.7.1. Company Overview
- 12.1.7.2. Products
- 12.1.7.3. Company Financials
- 12.1.7.4. SWOT Analysis
- 12.1.8 Maxar Technologies Inc
- 12.1.8.1. Company Overview
- 12.1.8.2. Products
- 12.1.8.3. Company Financials
- 12.1.8.4. SWOT Analysis
- 12.1.9 Blue Origin LLC
- 12.1.9.1. Company Overview
- 12.1.9.2. Products
- 12.1.9.3. Company Financials
- 12.1.9.4. SWOT Analysis
- 12.1.10 Berlin Space Technologies GmbH
- 12.1.10.1. Company Overview
- 12.1.10.2. Products
- 12.1.10.3. Company Financials
- 12.1.10.4. SWOT Analysis
- 12.1.11 Northrop Grumman Corporation
- 12.1.11.1. Company Overview
- 12.1.11.2. Products
- 12.1.11.3. Company Financials
- 12.1.11.4. SWOT Analysis
- 12.1.12 The Boeing Company
- 12.1.12.1. Company Overview
- 12.1.12.2. Products
- 12.1.12.3. Company Financials
- 12.1.12.4. SWOT Analysis
- 12.1.1 Space Exploration Technologies Corp
- 12.2. Market Entropy
- 12.2.1 Company's Key Areas Served
- 12.2.2 Recent Developments
- 12.3. Company Market Share Analysis 2025
- 12.3.1 Top 5 Companies Market Share Analysis
- 12.3.2 Top 3 Companies Market Share Analysis
- 12.4. List of Potential Customers
- 13. Research Methodology
List of Figures
- Figure 1: Global Spacecraft Industry Revenue Breakdown (Million, %) by Region 2025 & 2033
- Figure 2: North America Spacecraft Industry Revenue (Million), by Production Analysis 2025 & 2033
- Figure 3: North America Spacecraft Industry Revenue Share (%), by Production Analysis 2025 & 2033
- Figure 4: North America Spacecraft Industry Revenue (Million), by Consumption Analysis 2025 & 2033
- Figure 5: North America Spacecraft Industry Revenue Share (%), by Consumption Analysis 2025 & 2033
- Figure 6: North America Spacecraft Industry Revenue (Million), by Import Market Analysis (Value & Volume) 2025 & 2033
- Figure 7: North America Spacecraft Industry Revenue Share (%), by Import Market Analysis (Value & Volume) 2025 & 2033
- Figure 8: North America Spacecraft Industry Revenue (Million), by Export Market Analysis (Value & Volume) 2025 & 2033
- Figure 9: North America Spacecraft Industry Revenue Share (%), by Export Market Analysis (Value & Volume) 2025 & 2033
- Figure 10: North America Spacecraft Industry Revenue (Million), by Price Trend Analysis 2025 & 2033
- Figure 11: North America Spacecraft Industry Revenue Share (%), by Price Trend Analysis 2025 & 2033
- Figure 12: North America Spacecraft Industry Revenue (Million), by Country 2025 & 2033
- Figure 13: North America Spacecraft Industry Revenue Share (%), by Country 2025 & 2033
- Figure 14: South America Spacecraft Industry Revenue (Million), by Production Analysis 2025 & 2033
- Figure 15: South America Spacecraft Industry Revenue Share (%), by Production Analysis 2025 & 2033
- Figure 16: South America Spacecraft Industry Revenue (Million), by Consumption Analysis 2025 & 2033
- Figure 17: South America Spacecraft Industry Revenue Share (%), by Consumption Analysis 2025 & 2033
- Figure 18: South America Spacecraft Industry Revenue (Million), by Import Market Analysis (Value & Volume) 2025 & 2033
- Figure 19: South America Spacecraft Industry Revenue Share (%), by Import Market Analysis (Value & Volume) 2025 & 2033
- Figure 20: South America Spacecraft Industry Revenue (Million), by Export Market Analysis (Value & Volume) 2025 & 2033
- Figure 21: South America Spacecraft Industry Revenue Share (%), by Export Market Analysis (Value & Volume) 2025 & 2033
- Figure 22: South America Spacecraft Industry Revenue (Million), by Price Trend Analysis 2025 & 2033
- Figure 23: South America Spacecraft Industry Revenue Share (%), by Price Trend Analysis 2025 & 2033
- Figure 24: South America Spacecraft Industry Revenue (Million), by Country 2025 & 2033
- Figure 25: South America Spacecraft Industry Revenue Share (%), by Country 2025 & 2033
- Figure 26: Europe Spacecraft Industry Revenue (Million), by Production Analysis 2025 & 2033
- Figure 27: Europe Spacecraft Industry Revenue Share (%), by Production Analysis 2025 & 2033
- Figure 28: Europe Spacecraft Industry Revenue (Million), by Consumption Analysis 2025 & 2033
- Figure 29: Europe Spacecraft Industry Revenue Share (%), by Consumption Analysis 2025 & 2033
- Figure 30: Europe Spacecraft Industry Revenue (Million), by Import Market Analysis (Value & Volume) 2025 & 2033
- Figure 31: Europe Spacecraft Industry Revenue Share (%), by Import Market Analysis (Value & Volume) 2025 & 2033
- Figure 32: Europe Spacecraft Industry Revenue (Million), by Export Market Analysis (Value & Volume) 2025 & 2033
- Figure 33: Europe Spacecraft Industry Revenue Share (%), by Export Market Analysis (Value & Volume) 2025 & 2033
- Figure 34: Europe Spacecraft Industry Revenue (Million), by Price Trend Analysis 2025 & 2033
- Figure 35: Europe Spacecraft Industry Revenue Share (%), by Price Trend Analysis 2025 & 2033
- Figure 36: Europe Spacecraft Industry Revenue (Million), by Country 2025 & 2033
- Figure 37: Europe Spacecraft Industry Revenue Share (%), by Country 2025 & 2033
- Figure 38: Middle East & Africa Spacecraft Industry Revenue (Million), by Production Analysis 2025 & 2033
- Figure 39: Middle East & Africa Spacecraft Industry Revenue Share (%), by Production Analysis 2025 & 2033
- Figure 40: Middle East & Africa Spacecraft Industry Revenue (Million), by Consumption Analysis 2025 & 2033
- Figure 41: Middle East & Africa Spacecraft Industry Revenue Share (%), by Consumption Analysis 2025 & 2033
- Figure 42: Middle East & Africa Spacecraft Industry Revenue (Million), by Import Market Analysis (Value & Volume) 2025 & 2033
- Figure 43: Middle East & Africa Spacecraft Industry Revenue Share (%), by Import Market Analysis (Value & Volume) 2025 & 2033
- Figure 44: Middle East & Africa Spacecraft Industry Revenue (Million), by Export Market Analysis (Value & Volume) 2025 & 2033
- Figure 45: Middle East & Africa Spacecraft Industry Revenue Share (%), by Export Market Analysis (Value & Volume) 2025 & 2033
- Figure 46: Middle East & Africa Spacecraft Industry Revenue (Million), by Price Trend Analysis 2025 & 2033
- Figure 47: Middle East & Africa Spacecraft Industry Revenue Share (%), by Price Trend Analysis 2025 & 2033
- Figure 48: Middle East & Africa Spacecraft Industry Revenue (Million), by Country 2025 & 2033
- Figure 49: Middle East & Africa Spacecraft Industry Revenue Share (%), by Country 2025 & 2033
- Figure 50: Asia Pacific Spacecraft Industry Revenue (Million), by Production Analysis 2025 & 2033
- Figure 51: Asia Pacific Spacecraft Industry Revenue Share (%), by Production Analysis 2025 & 2033
- Figure 52: Asia Pacific Spacecraft Industry Revenue (Million), by Consumption Analysis 2025 & 2033
- Figure 53: Asia Pacific Spacecraft Industry Revenue Share (%), by Consumption Analysis 2025 & 2033
- Figure 54: Asia Pacific Spacecraft Industry Revenue (Million), by Import Market Analysis (Value & Volume) 2025 & 2033
- Figure 55: Asia Pacific Spacecraft Industry Revenue Share (%), by Import Market Analysis (Value & Volume) 2025 & 2033
- Figure 56: Asia Pacific Spacecraft Industry Revenue (Million), by Export Market Analysis (Value & Volume) 2025 & 2033
- Figure 57: Asia Pacific Spacecraft Industry Revenue Share (%), by Export Market Analysis (Value & Volume) 2025 & 2033
- Figure 58: Asia Pacific Spacecraft Industry Revenue (Million), by Price Trend Analysis 2025 & 2033
- Figure 59: Asia Pacific Spacecraft Industry Revenue Share (%), by Price Trend Analysis 2025 & 2033
- Figure 60: Asia Pacific Spacecraft Industry Revenue (Million), by Country 2025 & 2033
- Figure 61: Asia Pacific Spacecraft Industry Revenue Share (%), by Country 2025 & 2033
List of Tables
- Table 1: Global Spacecraft Industry Revenue Million Forecast, by Production Analysis 2020 & 2033
- Table 2: Global Spacecraft Industry Revenue Million Forecast, by Consumption Analysis 2020 & 2033
- Table 3: Global Spacecraft Industry Revenue Million Forecast, by Import Market Analysis (Value & Volume) 2020 & 2033
- Table 4: Global Spacecraft Industry Revenue Million Forecast, by Export Market Analysis (Value & Volume) 2020 & 2033
- Table 5: Global Spacecraft Industry Revenue Million Forecast, by Price Trend Analysis 2020 & 2033
- Table 6: Global Spacecraft Industry Revenue Million Forecast, by Region 2020 & 2033
- Table 7: Global Spacecraft Industry Revenue Million Forecast, by Production Analysis 2020 & 2033
- Table 8: Global Spacecraft Industry Revenue Million Forecast, by Consumption Analysis 2020 & 2033
- Table 9: Global Spacecraft Industry Revenue Million Forecast, by Import Market Analysis (Value & Volume) 2020 & 2033
- Table 10: Global Spacecraft Industry Revenue Million Forecast, by Export Market Analysis (Value & Volume) 2020 & 2033
- Table 11: Global Spacecraft Industry Revenue Million Forecast, by Price Trend Analysis 2020 & 2033
- Table 12: Global Spacecraft Industry Revenue Million Forecast, by Country 2020 & 2033
- Table 13: United States Spacecraft Industry Revenue (Million) Forecast, by Application 2020 & 2033
- Table 14: Canada Spacecraft Industry Revenue (Million) Forecast, by Application 2020 & 2033
- Table 15: Mexico Spacecraft Industry Revenue (Million) Forecast, by Application 2020 & 2033
- Table 16: Global Spacecraft Industry Revenue Million Forecast, by Production Analysis 2020 & 2033
- Table 17: Global Spacecraft Industry Revenue Million Forecast, by Consumption Analysis 2020 & 2033
- Table 18: Global Spacecraft Industry Revenue Million Forecast, by Import Market Analysis (Value & Volume) 2020 & 2033
- Table 19: Global Spacecraft Industry Revenue Million Forecast, by Export Market Analysis (Value & Volume) 2020 & 2033
- Table 20: Global Spacecraft Industry Revenue Million Forecast, by Price Trend Analysis 2020 & 2033
- Table 21: Global Spacecraft Industry Revenue Million Forecast, by Country 2020 & 2033
- Table 22: Brazil Spacecraft Industry Revenue (Million) Forecast, by Application 2020 & 2033
- Table 23: Argentina Spacecraft Industry Revenue (Million) Forecast, by Application 2020 & 2033
- Table 24: Rest of South America Spacecraft Industry Revenue (Million) Forecast, by Application 2020 & 2033
- Table 25: Global Spacecraft Industry Revenue Million Forecast, by Production Analysis 2020 & 2033
- Table 26: Global Spacecraft Industry Revenue Million Forecast, by Consumption Analysis 2020 & 2033
- Table 27: Global Spacecraft Industry Revenue Million Forecast, by Import Market Analysis (Value & Volume) 2020 & 2033
- Table 28: Global Spacecraft Industry Revenue Million Forecast, by Export Market Analysis (Value & Volume) 2020 & 2033
- Table 29: Global Spacecraft Industry Revenue Million Forecast, by Price Trend Analysis 2020 & 2033
- Table 30: Global Spacecraft Industry Revenue Million Forecast, by Country 2020 & 2033
- Table 31: United Kingdom Spacecraft Industry Revenue (Million) Forecast, by Application 2020 & 2033
- Table 32: Germany Spacecraft Industry Revenue (Million) Forecast, by Application 2020 & 2033
- Table 33: France Spacecraft Industry Revenue (Million) Forecast, by Application 2020 & 2033
- Table 34: Italy Spacecraft Industry Revenue (Million) Forecast, by Application 2020 & 2033
- Table 35: Spain Spacecraft Industry Revenue (Million) Forecast, by Application 2020 & 2033
- Table 36: Russia Spacecraft Industry Revenue (Million) Forecast, by Application 2020 & 2033
- Table 37: Benelux Spacecraft Industry Revenue (Million) Forecast, by Application 2020 & 2033
- Table 38: Nordics Spacecraft Industry Revenue (Million) Forecast, by Application 2020 & 2033
- Table 39: Rest of Europe Spacecraft Industry Revenue (Million) Forecast, by Application 2020 & 2033
- Table 40: Global Spacecraft Industry Revenue Million Forecast, by Production Analysis 2020 & 2033
- Table 41: Global Spacecraft Industry Revenue Million Forecast, by Consumption Analysis 2020 & 2033
- Table 42: Global Spacecraft Industry Revenue Million Forecast, by Import Market Analysis (Value & Volume) 2020 & 2033
- Table 43: Global Spacecraft Industry Revenue Million Forecast, by Export Market Analysis (Value & Volume) 2020 & 2033
- Table 44: Global Spacecraft Industry Revenue Million Forecast, by Price Trend Analysis 2020 & 2033
- Table 45: Global Spacecraft Industry Revenue Million Forecast, by Country 2020 & 2033
- Table 46: Turkey Spacecraft Industry Revenue (Million) Forecast, by Application 2020 & 2033
- Table 47: Israel Spacecraft Industry Revenue (Million) Forecast, by Application 2020 & 2033
- Table 48: GCC Spacecraft Industry Revenue (Million) Forecast, by Application 2020 & 2033
- Table 49: North Africa Spacecraft Industry Revenue (Million) Forecast, by Application 2020 & 2033
- Table 50: South Africa Spacecraft Industry Revenue (Million) Forecast, by Application 2020 & 2033
- Table 51: Rest of Middle East & Africa Spacecraft Industry Revenue (Million) Forecast, by Application 2020 & 2033
- Table 52: Global Spacecraft Industry Revenue Million Forecast, by Production Analysis 2020 & 2033
- Table 53: Global Spacecraft Industry Revenue Million Forecast, by Consumption Analysis 2020 & 2033
- Table 54: Global Spacecraft Industry Revenue Million Forecast, by Import Market Analysis (Value & Volume) 2020 & 2033
- Table 55: Global Spacecraft Industry Revenue Million Forecast, by Export Market Analysis (Value & Volume) 2020 & 2033
- Table 56: Global Spacecraft Industry Revenue Million Forecast, by Price Trend Analysis 2020 & 2033
- Table 57: Global Spacecraft Industry Revenue Million Forecast, by Country 2020 & 2033
- Table 58: China Spacecraft Industry Revenue (Million) Forecast, by Application 2020 & 2033
- Table 59: India Spacecraft Industry Revenue (Million) Forecast, by Application 2020 & 2033
- Table 60: Japan Spacecraft Industry Revenue (Million) Forecast, by Application 2020 & 2033
- Table 61: South Korea Spacecraft Industry Revenue (Million) Forecast, by Application 2020 & 2033
- Table 62: ASEAN Spacecraft Industry Revenue (Million) Forecast, by Application 2020 & 2033
- Table 63: Oceania Spacecraft Industry Revenue (Million) Forecast, by Application 2020 & 2033
- Table 64: Rest of Asia Pacific Spacecraft Industry Revenue (Million) Forecast, by Application 2020 & 2033
Frequently Asked Questions
1. What is the projected Compound Annual Growth Rate (CAGR) of the Spacecraft Industry?
The projected CAGR is approximately 4.74%.
2. Which companies are prominent players in the Spacecraft Industry?
Key companies in the market include Space Exploration Technologies Corp, Lockheed Martin Corporation, Mitsubishi Electric Corporatio, Airbus SE, Sierra Nevada Corporation, QinetiQ Group, OHB SE, Maxar Technologies Inc, Blue Origin LLC, Berlin Space Technologies GmbH, Northrop Grumman Corporation, The Boeing Company.
3. What are the main segments of the Spacecraft Industry?
The market segments include Production Analysis, Consumption Analysis, Import Market Analysis (Value & Volume), Export Market Analysis (Value & Volume), Price Trend Analysis.
4. Can you provide details about the market size?
The market size is estimated to be USD 6.89 Million as of 2022.
5. What are some drivers contributing to market growth?
Increase in Internet of Things (IoT) and Autonomous Systems; Rise in Demand for Military and Defense Satellite Communication Solutions.
6. What are the notable trends driving market growth?
Unmanned Spacecraft to Dominate Market Share During the Forecast Period.
7. Are there any restraints impacting market growth?
Cybersecurity Threats to Satellite Communication; Interference in Transmission of Data.
8. Can you provide examples of recent developments in the market?
January 2024: Japan launched a spacecraft on the Moon to demonstrate precision landing technology and reinvigorate its space program. The Japan Aerospace Exploration Agency's (JAXA) Smart Lander for Investigating Moon (SLIM) landed on the Moon's surface and re-established communication with Earth. By reducing the cost of launching, Japan aims to carry out more frequent missions in the future.
9. What pricing options are available for accessing the report?
Pricing options include single-user, multi-user, and enterprise licenses priced at USD 4750, USD 5250, and USD 8750 respectively.
10. Is the market size provided in terms of value or volume?
The market size is provided in terms of value, measured in Million.
11. Are there any specific market keywords associated with the report?
Yes, the market keyword associated with the report is "Spacecraft Industry," which aids in identifying and referencing the specific market segment covered.
12. How do I determine which pricing option suits my needs best?
The pricing options vary based on user requirements and access needs. Individual users may opt for single-user licenses, while businesses requiring broader access may choose multi-user or enterprise licenses for cost-effective access to the report.
13. Are there any additional resources or data provided in the Spacecraft Industry report?
While the report offers comprehensive insights, it's advisable to review the specific contents or supplementary materials provided to ascertain if additional resources or data are available.
14. How can I stay updated on further developments or reports in the Spacecraft Industry?
To stay informed about further developments, trends, and reports in the Spacecraft Industry, consider subscribing to industry newsletters, following relevant companies and organizations, or regularly checking reputable industry news sources and publications.
Methodology
Step 1 - Identification of Relevant Samples Size from Population Database


Step 2 - Approaches for Defining Global Market Size (Value, Volume* & Price*)

Note*: In applicable scenarios
Step 3 - Data Sources
Primary Research
- Web Analytics
- Survey Reports
- Research Institute
- Latest Research Reports
- Opinion Leaders
Secondary Research
- Annual Reports
- White Paper
- Latest Press Release
- Industry Association
- Paid Database
- Investor Presentations

Step 4 - Data Triangulation
Involves using different sources of information in order to increase the validity of a study
These sources are likely to be stakeholders in a program - participants, other researchers, program staff, other community members, and so on.
Then we put all data in single framework & apply various statistical tools to find out the dynamic on the market.
During the analysis stage, feedback from the stakeholder groups would be compared to determine areas of agreement as well as areas of divergence