


Key Insights
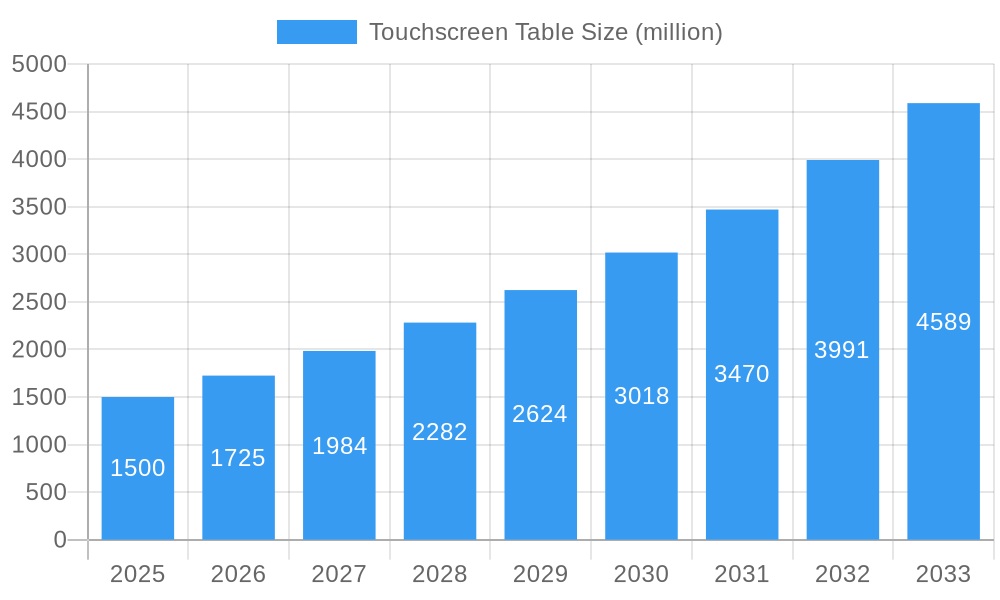
The global Touchscreen Table market is poised for significant expansion, driven by an increasing demand for interactive and engaging user experiences across diverse sectors. This market is estimated to be valued at approximately $1.5 billion in 2025 and is projected to grow at a Compound Annual Growth Rate (CAGR) of around 15% through 2033. The escalating adoption of interactive displays in hospitality, retail, and educational environments forms the bedrock of this growth. Hotels are leveraging touchscreen tables for digital menus, reservation systems, and interactive concierges, enhancing guest engagement and operational efficiency. Similarly, the dining room sector is witnessing a transformation with tables offering integrated ordering, entertainment, and payment functionalities, revolutionizing the customer experience. Exhibition halls are utilizing these tables for dynamic product displays, interactive information kiosks, and engaging visitor participation, making events more memorable and informative.
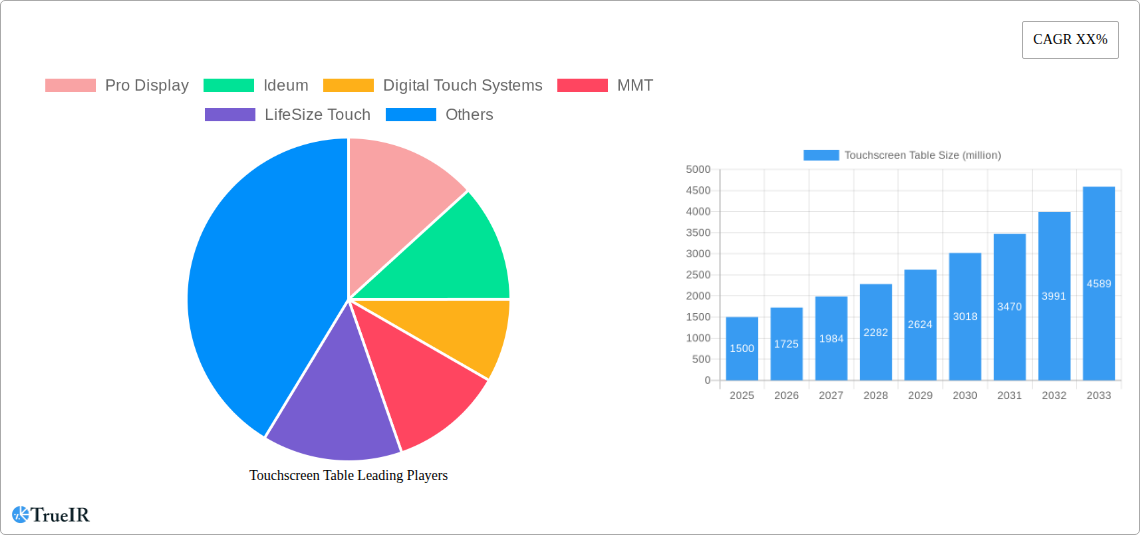
Touchscreen Table Market Size (In Billion)

The expansion of the touchscreen table market is further propelled by advancements in display technology, including higher resolutions, improved touch sensitivity, and enhanced durability. The growing integration of AI and IoT capabilities is also a key trend, enabling more personalized and intelligent interactions. Mobile touchscreen tables, offering flexibility and portability, are gaining traction, particularly in temporary setups and event spaces. While the market exhibits robust growth, certain restraints like the high initial cost of sophisticated units and the need for specialized content development can present challenges. However, the undeniable benefits of improved customer engagement, streamlined operations, and enhanced learning experiences continue to drive widespread adoption across industries. Key players such as Pro Display, Ideum, and MMT are at the forefront, innovating and expanding the application landscape for these transformative technologies.
Touchscreen Table Company Market Share
Touchscreen Table Market Structure & Competitive Landscape
The global touchscreen table market, projected to reach millions in valuation by 2033, exhibits a moderate to high level of concentration, with several prominent players vying for market share. Key companies such as Pro Display, Ideum, Digital Touch Systems, MMT, LifeSize Touch, AV Media Systems, D-Table, eyefactive, Palas, multiCLASS, U-Touch, Newtouch, CDS, smartPerform, Prestop, ABB, TableConnect, Evoke Technologies, Sharp, Volanti, i Plan Tables, Promultis, IQ, staietech, Virtual On, and ITA TOUCH are actively engaged in this dynamic sector. Innovation remains a critical driver, with continuous advancements in display technology, interactive software, and multi-touch capabilities fueling product differentiation. Regulatory impacts are relatively minor, primarily revolving around safety and interface standards, posing limited barriers to entry. Product substitutes, such as large-format displays and traditional interactive whiteboards, exist but often lack the integrated, multi-user experience offered by touchscreen tables. End-user segmentation spans various applications, including hotels, dining rooms, exhibition halls, and schools, each with distinct requirements and adoption rates. Merger and acquisition (M&A) trends, while not a dominant force, are observed as companies seek to expand their product portfolios, gain technological expertise, or broaden their geographical reach, aiming to consolidate market positions and achieve economies of scale in the millions market. Concentration ratios are estimated to be in the range of 40-60% for the top 5 players. M&A volumes are predicted to remain steady, with approximately million deals annually.
Touchscreen Table Market Trends & Opportunities
The global touchscreen table market is poised for substantial expansion, driven by an escalating demand for immersive and interactive user experiences across diverse sectors. Forecasted to grow at a Compound Annual Growth Rate (CAGR) of approximately xx% from 2025 to 2033, the market is expected to reach a valuation of millions by the end of the forecast period. This robust growth trajectory is underpinned by significant technological advancements, including the integration of higher resolution displays, enhanced touch sensitivity, and more sophisticated multi-touch functionalities. The evolution towards thinner, more durable, and energy-efficient touchscreen panels, coupled with advancements in embedded processing power and cloud connectivity, is further propelling market adoption. Consumer preferences are increasingly leaning towards intuitive and collaborative interfaces, making touchscreen tables an attractive solution for public spaces, educational institutions, and commercial environments. The proliferation of interactive restaurant technology, for instance, is creating new avenues for growth in the dining sector. Furthermore, the increasing digitalization of exhibition halls and museums necessitates engaging and informative displays, positioning touchscreen tables as a prime candidate for enhanced visitor engagement. In the educational domain, these tables offer a collaborative learning environment, fostering student interaction and knowledge sharing. The competitive landscape is characterized by ongoing innovation in software integration and application development, with companies focusing on creating tailored solutions for specific industry needs. Strategic partnerships and collaborations between hardware manufacturers and software developers are becoming increasingly prevalent, enabling the creation of more comprehensive and feature-rich touchscreen table ecosystems. The market penetration rate for touchscreen tables in developed economies is expected to rise significantly as awareness and affordability increase, creating substantial opportunities for early adopters and innovative product offerings. The transition from traditional display methods to interactive, touch-enabled solutions is a defining trend, promising a dynamic and evolving market over the coming years.
Dominant Markets & Segments in Touchscreen Table
The global touchscreen table market demonstrates significant dominance within the Exhibition Hall application segment and the Stationary type, largely driven by substantial infrastructure investments and a strong policy push towards interactive public spaces. In the Exhibition Hall sector, touchscreen tables are instrumental in providing visitors with immersive product demonstrations, detailed information, and interactive wayfinding, significantly enhancing the overall exhibition experience. The growth in this segment is fueled by a desire from organizers and exhibitors to create more engaging and memorable displays. Key growth drivers include the increasing number of global trade shows and exhibitions, a growing emphasis on experiential marketing, and the need for dynamic content delivery. Infrastructure development in large convention centers and exhibition venues, which often incorporate advanced technological solutions, also plays a crucial role. Policies aimed at promoting digital transformation and smart city initiatives further bolster the adoption of such interactive technologies in public spaces.
Within the Stationary type, these tables offer a permanent and robust interactive solution ideal for high-traffic environments. Their stability and integrated design make them suitable for continuous use in commercial and public settings. The key growth drivers for stationary touchscreen tables include their durability, ease of maintenance, and ability to integrate seamlessly into existing interior designs. The trend towards interactive retail displays, information kiosks, and collaborative workspaces within offices further strengthens the demand for stationary models.
The Hotel application segment also presents a significant growth opportunity, with touchscreen tables being adopted for in-room entertainment, concierge services, and interactive dining menus. The Dining Room segment is rapidly expanding due to the rise of interactive restaurant technology, offering customers enhanced ordering experiences and interactive menus. While the School segment shows promise for collaborative learning environments, its adoption is sometimes slower due to budget constraints and curriculum integration challenges. The "Others" category, encompassing sectors like retail, healthcare, and transportation, also contributes to market diversification, with bespoke solutions being developed for unique applications. The market penetration rate in these dominant segments is expected to continue its upward trend, reaching millions of installations by 2033.
Touchscreen Table Product Analysis
Touchscreen tables are characterized by their innovative integration of advanced display technologies, multi-touch interactivity, and sophisticated software platforms. Product innovations are focused on delivering seamless and intuitive user experiences, with advancements in high-resolution, durable, and responsive touch surfaces. Competitive advantages are derived from superior image quality, robust construction for public use, and the ability to run a wide array of interactive applications. These tables are finding diverse applications, from interactive product catalogs in retail to collaborative learning tools in educational settings and immersive informational displays in exhibition halls. The market is witnessing a trend towards ultra-thin designs, increased processing power for real-time interactivity, and enhanced connectivity options for cloud-based content management.
Key Drivers, Barriers & Challenges in Touchscreen Table
Key Drivers: The touchscreen table market is propelled by a surging demand for engaging and interactive user experiences, particularly in public spaces. Technological advancements in display resolution, touch sensitivity, and processing power are crucial enablers. Economic growth and increased investment in digital transformation across various industries, from hospitality to education, also fuel market expansion. Supportive government policies promoting smart infrastructure and digital learning environments further contribute to growth. For example, initiatives promoting smart tourism in countries like South Korea are driving adoption in hotels and tourist information centers.
Barriers & Challenges: Despite the positive outlook, the market faces several challenges. High initial manufacturing costs and the premium pricing of advanced touchscreen tables can be a barrier for smaller businesses and institutions with limited budgets. Supply chain disruptions, particularly for specialized electronic components, can impact production timelines and costs, with estimated impacts of millions in potential revenue loss. Evolving regulatory landscapes concerning data privacy and user interface standards, while not stringent, require continuous compliance. Intense competition among manufacturers also pressures profit margins, requiring constant innovation to maintain market share. The complexity of software integration and the need for skilled technicians for installation and maintenance can also pose challenges for widespread adoption.
Growth Drivers in the Touchscreen Table Market
Key growth drivers in the touchscreen table market are primarily technological, economic, and regulatory in nature. Technologically, the continuous improvement in touch sensor accuracy, display resolution (e.g., 4K and 8K), and the integration of AI for personalized interactions are significant catalysts. Economically, increasing disposable incomes and corporate investments in enhanced customer engagement and collaborative work environments are boosting demand. For instance, the rise of the experience economy in retail and hospitality sectors is a major driver. Regulatory factors, such as government initiatives promoting smart cities and digital education, also provide a favorable environment, encouraging the adoption of interactive technologies like touchscreen tables in public venues and educational institutions, with projected market penetration in these sectors reaching millions by 2030.
Challenges Impacting Touchscreen Table Growth
Several challenges impact the growth of the touchscreen table market. High manufacturing costs and the associated premium pricing remain a significant barrier, especially for budget-conscious sectors like education and smaller hospitality businesses. Supply chain vulnerabilities, particularly concerning rare earth minerals and advanced semiconductor components, can lead to production delays and increased costs, with potential supply chain disruptions estimated to impact market growth by millions annually. Competitive pressures from established display manufacturers and the emergence of new entrants necessitate continuous innovation and price optimization, potentially squeezing profit margins. Furthermore, ensuring robust cybersecurity for networked touchscreen tables and managing complex software updates and maintenance can be challenging for end-users.
Key Players Shaping the Touchscreen Table Market
- Pro Display
- Ideum
- Digital Touch Systems
- MMT
- LifeSize Touch
- AV Media Systems
- D-Table
- eyefactive
- Palas
- multiCLASS
- U-Touch
- Newtouch
- CDS
- smartPerform
- Prestop
- ABB
- TableConnect
- Evoke Technologies
- Sharp
- Volanti
- i Plan Tables
- Promultis
- IQ
- staietech
- Virtual On
- ITA TOUCH
Significant Touchscreen Table Industry Milestones
- 2019: Widespread adoption of larger format interactive displays in retail environments, paving the way for more sophisticated table-based solutions.
- 2020: Increased demand for interactive collaboration tools in remote work settings, accelerating software development for multi-user interfaces.
- 2021: Advancements in durable, tempered glass touch surfaces making touchscreen tables more practical for public spaces.
- 2022: Integration of AI-powered analytics for user behavior tracking and personalized content delivery in exhibition and retail applications.
- 2023: Growing interest in interactive dining technology, leading to new product launches in the restaurant sector.
- 2024: Enhanced connectivity options, including 5G integration, for real-time content streaming and cloud-based management.
Future Outlook for Touchscreen Table Market
The future outlook for the touchscreen table market is exceptionally promising, driven by an insatiable demand for immersive and intuitive user experiences. Strategic opportunities lie in the expanding integration of Artificial Intelligence (AI) for personalized interactions and data analytics, offering unprecedented insights into user engagement. The growth of the "experience economy" across hospitality, retail, and entertainment sectors will continue to fuel demand for interactive solutions. Furthermore, the ongoing digital transformation in education and corporate environments presents a significant untapped potential. Advancements in display technology, such as foldable and transparent screens, are likely to introduce novel form factors and applications. The market is projected to reach a valuation of millions by 2033, with a projected CAGR of xx%.
Touchscreen Table Segmentation
-
1. Application
- 1.1. Hotel
- 1.2. Dining Room
- 1.3. Exhibition Hall
- 1.4. School
- 1.5. Others
-
2. Types
- 2.1. Stationary
- 2.2. Mobile
Touchscreen Table Segmentation By Geography
-
1. North America
- 1.1. United States
- 1.2. Canada
- 1.3. Mexico
-
2. South America
- 2.1. Brazil
- 2.2. Argentina
- 2.3. Rest of South America
-
3. Europe
- 3.1. United Kingdom
- 3.2. Germany
- 3.3. France
- 3.4. Italy
- 3.5. Spain
- 3.6. Russia
- 3.7. Benelux
- 3.8. Nordics
- 3.9. Rest of Europe
-
4. Middle East & Africa
- 4.1. Turkey
- 4.2. Israel
- 4.3. GCC
- 4.4. North Africa
- 4.5. South Africa
- 4.6. Rest of Middle East & Africa
-
5. Asia Pacific
- 5.1. China
- 5.2. India
- 5.3. Japan
- 5.4. South Korea
- 5.5. ASEAN
- 5.6. Oceania
- 5.7. Rest of Asia Pacific
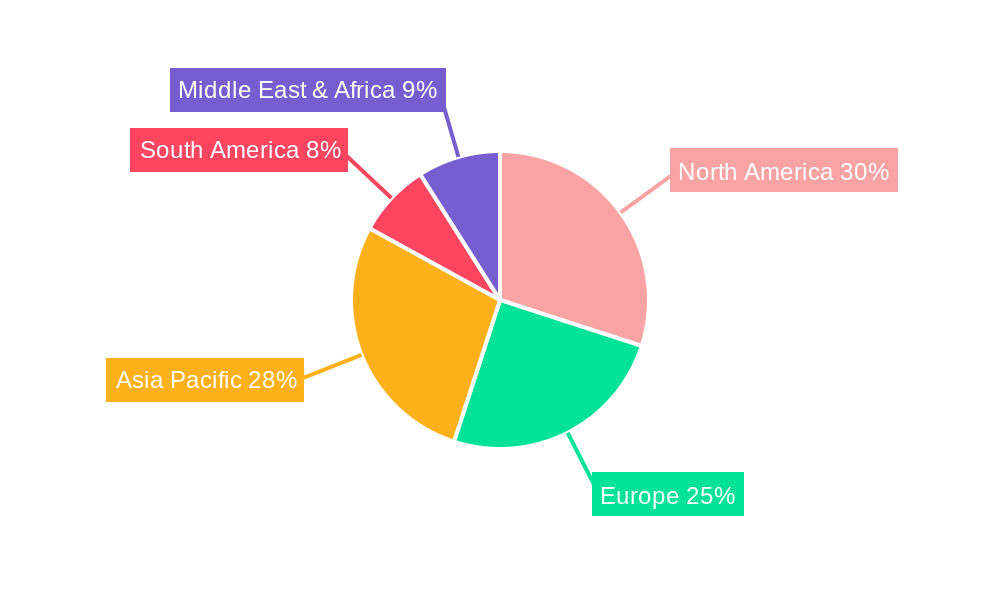
Touchscreen Table Regional Market Share
Geographic Coverage of Touchscreen Table
Touchscreen Table REPORT HIGHLIGHTS
| Aspects | Details |
|---|---|
| Study Period | 2020-2034 |
| Base Year | 2025 |
| Estimated Year | 2026 |
| Forecast Period | 2026-2034 |
| Historical Period | 2020-2025 |
| Growth Rate | CAGR of 13.8% from 2020-2034 |
| Segmentation |
|
Table of Contents
- 1. Introduction
- 1.1. Research Scope
- 1.2. Market Segmentation
- 1.3. Research Objective
- 1.4. Definitions and Assumptions
- 2. Executive Summary
- 2.1. Market Snapshot
- 3. Market Dynamics
- 3.1. Market Drivers
- 3.2. Market Restrains
- 3.3. Market Trends
- 3.4. Market Opportunities
- 4. Market Factor Analysis
- 4.1. Porters Five Forces
- 4.1.1. Bargaining Power of Suppliers
- 4.1.2. Bargaining Power of Buyers
- 4.1.3. Threat of New Entrants
- 4.1.4. Threat of Substitutes
- 4.1.5. Competitive Rivalry
- 4.2. PESTEL analysis
- 4.3. BCG Analysis
- 4.3.1. Stars (High Growth, High Market Share)
- 4.3.2. Cash Cows (Low Growth, High Market Share)
- 4.3.3. Question Mark (High Growth, Low Market Share)
- 4.3.4. Dogs (Low Growth, Low Market Share)
- 4.4. Ansoff Matrix Analysis
- 4.5. Supply Chain Analysis
- 4.6. Regulatory Landscape
- 4.7. Current Market Potential and Opportunity Assessment (TAM–SAM–SOM Framework)
- 4.8. TIR Analyst Note
- 4.1. Porters Five Forces
- 5. Market Analysis, Insights and Forecast 2021-2033
- 5.1. Market Analysis, Insights and Forecast - by Application
- 5.1.1. Hotel
- 5.1.2. Dining Room
- 5.1.3. Exhibition Hall
- 5.1.4. School
- 5.1.5. Others
- 5.2. Market Analysis, Insights and Forecast - by Types
- 5.2.1. Stationary
- 5.2.2. Mobile
- 5.3. Market Analysis, Insights and Forecast - by Region
- 5.3.1. North America
- 5.3.2. South America
- 5.3.3. Europe
- 5.3.4. Middle East & Africa
- 5.3.5. Asia Pacific
- 5.1. Market Analysis, Insights and Forecast - by Application
- 6. Global Touchscreen Table Analysis, Insights and Forecast, 2021-2033
- 6.1. Market Analysis, Insights and Forecast - by Application
- 6.1.1. Hotel
- 6.1.2. Dining Room
- 6.1.3. Exhibition Hall
- 6.1.4. School
- 6.1.5. Others
- 6.2. Market Analysis, Insights and Forecast - by Types
- 6.2.1. Stationary
- 6.2.2. Mobile
- 6.1. Market Analysis, Insights and Forecast - by Application
- 7. North America Touchscreen Table Analysis, Insights and Forecast, 2020-2032
- 7.1. Market Analysis, Insights and Forecast - by Application
- 7.1.1. Hotel
- 7.1.2. Dining Room
- 7.1.3. Exhibition Hall
- 7.1.4. School
- 7.1.5. Others
- 7.2. Market Analysis, Insights and Forecast - by Types
- 7.2.1. Stationary
- 7.2.2. Mobile
- 7.1. Market Analysis, Insights and Forecast - by Application
- 8. South America Touchscreen Table Analysis, Insights and Forecast, 2020-2032
- 8.1. Market Analysis, Insights and Forecast - by Application
- 8.1.1. Hotel
- 8.1.2. Dining Room
- 8.1.3. Exhibition Hall
- 8.1.4. School
- 8.1.5. Others
- 8.2. Market Analysis, Insights and Forecast - by Types
- 8.2.1. Stationary
- 8.2.2. Mobile
- 8.1. Market Analysis, Insights and Forecast - by Application
- 9. Europe Touchscreen Table Analysis, Insights and Forecast, 2020-2032
- 9.1. Market Analysis, Insights and Forecast - by Application
- 9.1.1. Hotel
- 9.1.2. Dining Room
- 9.1.3. Exhibition Hall
- 9.1.4. School
- 9.1.5. Others
- 9.2. Market Analysis, Insights and Forecast - by Types
- 9.2.1. Stationary
- 9.2.2. Mobile
- 9.1. Market Analysis, Insights and Forecast - by Application
- 10. Middle East & Africa Touchscreen Table Analysis, Insights and Forecast, 2020-2032
- 10.1. Market Analysis, Insights and Forecast - by Application
- 10.1.1. Hotel
- 10.1.2. Dining Room
- 10.1.3. Exhibition Hall
- 10.1.4. School
- 10.1.5. Others
- 10.2. Market Analysis, Insights and Forecast - by Types
- 10.2.1. Stationary
- 10.2.2. Mobile
- 10.1. Market Analysis, Insights and Forecast - by Application
- 11. Asia Pacific Touchscreen Table Analysis, Insights and Forecast, 2020-2032
- 11.1. Market Analysis, Insights and Forecast - by Application
- 11.1.1. Hotel
- 11.1.2. Dining Room
- 11.1.3. Exhibition Hall
- 11.1.4. School
- 11.1.5. Others
- 11.2. Market Analysis, Insights and Forecast - by Types
- 11.2.1. Stationary
- 11.2.2. Mobile
- 11.1. Market Analysis, Insights and Forecast - by Application
- 12. Competitive Analysis
- 12.1. Company Profiles
- 12.1.1 Pro Display
- 12.1.1.1. Company Overview
- 12.1.1.2. Products
- 12.1.1.3. Company Financials
- 12.1.1.4. SWOT Analysis
- 12.1.2 Ideum
- 12.1.2.1. Company Overview
- 12.1.2.2. Products
- 12.1.2.3. Company Financials
- 12.1.2.4. SWOT Analysis
- 12.1.3 Digital Touch Systems
- 12.1.3.1. Company Overview
- 12.1.3.2. Products
- 12.1.3.3. Company Financials
- 12.1.3.4. SWOT Analysis
- 12.1.4 MMT
- 12.1.4.1. Company Overview
- 12.1.4.2. Products
- 12.1.4.3. Company Financials
- 12.1.4.4. SWOT Analysis
- 12.1.5 LifeSize Touch
- 12.1.5.1. Company Overview
- 12.1.5.2. Products
- 12.1.5.3. Company Financials
- 12.1.5.4. SWOT Analysis
- 12.1.6 AV Media Systems
- 12.1.6.1. Company Overview
- 12.1.6.2. Products
- 12.1.6.3. Company Financials
- 12.1.6.4. SWOT Analysis
- 12.1.7 D-Table
- 12.1.7.1. Company Overview
- 12.1.7.2. Products
- 12.1.7.3. Company Financials
- 12.1.7.4. SWOT Analysis
- 12.1.8 eyefactive
- 12.1.8.1. Company Overview
- 12.1.8.2. Products
- 12.1.8.3. Company Financials
- 12.1.8.4. SWOT Analysis
- 12.1.9 Palas
- 12.1.9.1. Company Overview
- 12.1.9.2. Products
- 12.1.9.3. Company Financials
- 12.1.9.4. SWOT Analysis
- 12.1.10 multiCLASS
- 12.1.10.1. Company Overview
- 12.1.10.2. Products
- 12.1.10.3. Company Financials
- 12.1.10.4. SWOT Analysis
- 12.1.11 U-Touch
- 12.1.11.1. Company Overview
- 12.1.11.2. Products
- 12.1.11.3. Company Financials
- 12.1.11.4. SWOT Analysis
- 12.1.12 Newtouch
- 12.1.12.1. Company Overview
- 12.1.12.2. Products
- 12.1.12.3. Company Financials
- 12.1.12.4. SWOT Analysis
- 12.1.13 CDS
- 12.1.13.1. Company Overview
- 12.1.13.2. Products
- 12.1.13.3. Company Financials
- 12.1.13.4. SWOT Analysis
- 12.1.14 smartPerform
- 12.1.14.1. Company Overview
- 12.1.14.2. Products
- 12.1.14.3. Company Financials
- 12.1.14.4. SWOT Analysis
- 12.1.15 Prestop
- 12.1.15.1. Company Overview
- 12.1.15.2. Products
- 12.1.15.3. Company Financials
- 12.1.15.4. SWOT Analysis
- 12.1.16 ABB
- 12.1.16.1. Company Overview
- 12.1.16.2. Products
- 12.1.16.3. Company Financials
- 12.1.16.4. SWOT Analysis
- 12.1.17 TableConnect
- 12.1.17.1. Company Overview
- 12.1.17.2. Products
- 12.1.17.3. Company Financials
- 12.1.17.4. SWOT Analysis
- 12.1.18 Evoke Technologies
- 12.1.18.1. Company Overview
- 12.1.18.2. Products
- 12.1.18.3. Company Financials
- 12.1.18.4. SWOT Analysis
- 12.1.19 Sharp
- 12.1.19.1. Company Overview
- 12.1.19.2. Products
- 12.1.19.3. Company Financials
- 12.1.19.4. SWOT Analysis
- 12.1.20 Volanti
- 12.1.20.1. Company Overview
- 12.1.20.2. Products
- 12.1.20.3. Company Financials
- 12.1.20.4. SWOT Analysis
- 12.1.21 i Plan Tables
- 12.1.21.1. Company Overview
- 12.1.21.2. Products
- 12.1.21.3. Company Financials
- 12.1.21.4. SWOT Analysis
- 12.1.22 Promultis
- 12.1.22.1. Company Overview
- 12.1.22.2. Products
- 12.1.22.3. Company Financials
- 12.1.22.4. SWOT Analysis
- 12.1.23 IQ
- 12.1.23.1. Company Overview
- 12.1.23.2. Products
- 12.1.23.3. Company Financials
- 12.1.23.4. SWOT Analysis
- 12.1.24 staietech
- 12.1.24.1. Company Overview
- 12.1.24.2. Products
- 12.1.24.3. Company Financials
- 12.1.24.4. SWOT Analysis
- 12.1.25 Virtual On
- 12.1.25.1. Company Overview
- 12.1.25.2. Products
- 12.1.25.3. Company Financials
- 12.1.25.4. SWOT Analysis
- 12.1.26 ITA TOUCH
- 12.1.26.1. Company Overview
- 12.1.26.2. Products
- 12.1.26.3. Company Financials
- 12.1.26.4. SWOT Analysis
- 12.1.27 Interactive restaurant technology
- 12.1.27.1. Company Overview
- 12.1.27.2. Products
- 12.1.27.3. Company Financials
- 12.1.27.4. SWOT Analysis
- 12.1.1 Pro Display
- 12.2. Market Entropy
- 12.2.1 Company's Key Areas Served
- 12.2.2 Recent Developments
- 12.3. Company Market Share Analysis 2025
- 12.3.1 Top 5 Companies Market Share Analysis
- 12.3.2 Top 3 Companies Market Share Analysis
- 12.4. List of Potential Customers
- 13. Research Methodology
List of Figures
- Figure 1: Global Touchscreen Table Revenue Breakdown (billion, %) by Region 2025 & 2033
- Figure 2: Global Touchscreen Table Volume Breakdown (K, %) by Region 2025 & 2033
- Figure 3: North America Touchscreen Table Revenue (billion), by Application 2025 & 2033
- Figure 4: North America Touchscreen Table Volume (K), by Application 2025 & 2033
- Figure 5: North America Touchscreen Table Revenue Share (%), by Application 2025 & 2033
- Figure 6: North America Touchscreen Table Volume Share (%), by Application 2025 & 2033
- Figure 7: North America Touchscreen Table Revenue (billion), by Types 2025 & 2033
- Figure 8: North America Touchscreen Table Volume (K), by Types 2025 & 2033
- Figure 9: North America Touchscreen Table Revenue Share (%), by Types 2025 & 2033
- Figure 10: North America Touchscreen Table Volume Share (%), by Types 2025 & 2033
- Figure 11: North America Touchscreen Table Revenue (billion), by Country 2025 & 2033
- Figure 12: North America Touchscreen Table Volume (K), by Country 2025 & 2033
- Figure 13: North America Touchscreen Table Revenue Share (%), by Country 2025 & 2033
- Figure 14: North America Touchscreen Table Volume Share (%), by Country 2025 & 2033
- Figure 15: South America Touchscreen Table Revenue (billion), by Application 2025 & 2033
- Figure 16: South America Touchscreen Table Volume (K), by Application 2025 & 2033
- Figure 17: South America Touchscreen Table Revenue Share (%), by Application 2025 & 2033
- Figure 18: South America Touchscreen Table Volume Share (%), by Application 2025 & 2033
- Figure 19: South America Touchscreen Table Revenue (billion), by Types 2025 & 2033
- Figure 20: South America Touchscreen Table Volume (K), by Types 2025 & 2033
- Figure 21: South America Touchscreen Table Revenue Share (%), by Types 2025 & 2033
- Figure 22: South America Touchscreen Table Volume Share (%), by Types 2025 & 2033
- Figure 23: South America Touchscreen Table Revenue (billion), by Country 2025 & 2033
- Figure 24: South America Touchscreen Table Volume (K), by Country 2025 & 2033
- Figure 25: South America Touchscreen Table Revenue Share (%), by Country 2025 & 2033
- Figure 26: South America Touchscreen Table Volume Share (%), by Country 2025 & 2033
- Figure 27: Europe Touchscreen Table Revenue (billion), by Application 2025 & 2033
- Figure 28: Europe Touchscreen Table Volume (K), by Application 2025 & 2033
- Figure 29: Europe Touchscreen Table Revenue Share (%), by Application 2025 & 2033
- Figure 30: Europe Touchscreen Table Volume Share (%), by Application 2025 & 2033
- Figure 31: Europe Touchscreen Table Revenue (billion), by Types 2025 & 2033
- Figure 32: Europe Touchscreen Table Volume (K), by Types 2025 & 2033
- Figure 33: Europe Touchscreen Table Revenue Share (%), by Types 2025 & 2033
- Figure 34: Europe Touchscreen Table Volume Share (%), by Types 2025 & 2033
- Figure 35: Europe Touchscreen Table Revenue (billion), by Country 2025 & 2033
- Figure 36: Europe Touchscreen Table Volume (K), by Country 2025 & 2033
- Figure 37: Europe Touchscreen Table Revenue Share (%), by Country 2025 & 2033
- Figure 38: Europe Touchscreen Table Volume Share (%), by Country 2025 & 2033
- Figure 39: Middle East & Africa Touchscreen Table Revenue (billion), by Application 2025 & 2033
- Figure 40: Middle East & Africa Touchscreen Table Volume (K), by Application 2025 & 2033
- Figure 41: Middle East & Africa Touchscreen Table Revenue Share (%), by Application 2025 & 2033
- Figure 42: Middle East & Africa Touchscreen Table Volume Share (%), by Application 2025 & 2033
- Figure 43: Middle East & Africa Touchscreen Table Revenue (billion), by Types 2025 & 2033
- Figure 44: Middle East & Africa Touchscreen Table Volume (K), by Types 2025 & 2033
- Figure 45: Middle East & Africa Touchscreen Table Revenue Share (%), by Types 2025 & 2033
- Figure 46: Middle East & Africa Touchscreen Table Volume Share (%), by Types 2025 & 2033
- Figure 47: Middle East & Africa Touchscreen Table Revenue (billion), by Country 2025 & 2033
- Figure 48: Middle East & Africa Touchscreen Table Volume (K), by Country 2025 & 2033
- Figure 49: Middle East & Africa Touchscreen Table Revenue Share (%), by Country 2025 & 2033
- Figure 50: Middle East & Africa Touchscreen Table Volume Share (%), by Country 2025 & 2033
- Figure 51: Asia Pacific Touchscreen Table Revenue (billion), by Application 2025 & 2033
- Figure 52: Asia Pacific Touchscreen Table Volume (K), by Application 2025 & 2033
- Figure 53: Asia Pacific Touchscreen Table Revenue Share (%), by Application 2025 & 2033
- Figure 54: Asia Pacific Touchscreen Table Volume Share (%), by Application 2025 & 2033
- Figure 55: Asia Pacific Touchscreen Table Revenue (billion), by Types 2025 & 2033
- Figure 56: Asia Pacific Touchscreen Table Volume (K), by Types 2025 & 2033
- Figure 57: Asia Pacific Touchscreen Table Revenue Share (%), by Types 2025 & 2033
- Figure 58: Asia Pacific Touchscreen Table Volume Share (%), by Types 2025 & 2033
- Figure 59: Asia Pacific Touchscreen Table Revenue (billion), by Country 2025 & 2033
- Figure 60: Asia Pacific Touchscreen Table Volume (K), by Country 2025 & 2033
- Figure 61: Asia Pacific Touchscreen Table Revenue Share (%), by Country 2025 & 2033
- Figure 62: Asia Pacific Touchscreen Table Volume Share (%), by Country 2025 & 2033
List of Tables
- Table 1: Global Touchscreen Table Revenue billion Forecast, by Application 2020 & 2033
- Table 2: Global Touchscreen Table Volume K Forecast, by Application 2020 & 2033
- Table 3: Global Touchscreen Table Revenue billion Forecast, by Types 2020 & 2033
- Table 4: Global Touchscreen Table Volume K Forecast, by Types 2020 & 2033
- Table 5: Global Touchscreen Table Revenue billion Forecast, by Region 2020 & 2033
- Table 6: Global Touchscreen Table Volume K Forecast, by Region 2020 & 2033
- Table 7: Global Touchscreen Table Revenue billion Forecast, by Application 2020 & 2033
- Table 8: Global Touchscreen Table Volume K Forecast, by Application 2020 & 2033
- Table 9: Global Touchscreen Table Revenue billion Forecast, by Types 2020 & 2033
- Table 10: Global Touchscreen Table Volume K Forecast, by Types 2020 & 2033
- Table 11: Global Touchscreen Table Revenue billion Forecast, by Country 2020 & 2033
- Table 12: Global Touchscreen Table Volume K Forecast, by Country 2020 & 2033
- Table 13: United States Touchscreen Table Revenue (billion) Forecast, by Application 2020 & 2033
- Table 14: United States Touchscreen Table Volume (K) Forecast, by Application 2020 & 2033
- Table 15: Canada Touchscreen Table Revenue (billion) Forecast, by Application 2020 & 2033
- Table 16: Canada Touchscreen Table Volume (K) Forecast, by Application 2020 & 2033
- Table 17: Mexico Touchscreen Table Revenue (billion) Forecast, by Application 2020 & 2033
- Table 18: Mexico Touchscreen Table Volume (K) Forecast, by Application 2020 & 2033
- Table 19: Global Touchscreen Table Revenue billion Forecast, by Application 2020 & 2033
- Table 20: Global Touchscreen Table Volume K Forecast, by Application 2020 & 2033
- Table 21: Global Touchscreen Table Revenue billion Forecast, by Types 2020 & 2033
- Table 22: Global Touchscreen Table Volume K Forecast, by Types 2020 & 2033
- Table 23: Global Touchscreen Table Revenue billion Forecast, by Country 2020 & 2033
- Table 24: Global Touchscreen Table Volume K Forecast, by Country 2020 & 2033
- Table 25: Brazil Touchscreen Table Revenue (billion) Forecast, by Application 2020 & 2033
- Table 26: Brazil Touchscreen Table Volume (K) Forecast, by Application 2020 & 2033
- Table 27: Argentina Touchscreen Table Revenue (billion) Forecast, by Application 2020 & 2033
- Table 28: Argentina Touchscreen Table Volume (K) Forecast, by Application 2020 & 2033
- Table 29: Rest of South America Touchscreen Table Revenue (billion) Forecast, by Application 2020 & 2033
- Table 30: Rest of South America Touchscreen Table Volume (K) Forecast, by Application 2020 & 2033
- Table 31: Global Touchscreen Table Revenue billion Forecast, by Application 2020 & 2033
- Table 32: Global Touchscreen Table Volume K Forecast, by Application 2020 & 2033
- Table 33: Global Touchscreen Table Revenue billion Forecast, by Types 2020 & 2033
- Table 34: Global Touchscreen Table Volume K Forecast, by Types 2020 & 2033
- Table 35: Global Touchscreen Table Revenue billion Forecast, by Country 2020 & 2033
- Table 36: Global Touchscreen Table Volume K Forecast, by Country 2020 & 2033
- Table 37: United Kingdom Touchscreen Table Revenue (billion) Forecast, by Application 2020 & 2033
- Table 38: United Kingdom Touchscreen Table Volume (K) Forecast, by Application 2020 & 2033
- Table 39: Germany Touchscreen Table Revenue (billion) Forecast, by Application 2020 & 2033
- Table 40: Germany Touchscreen Table Volume (K) Forecast, by Application 2020 & 2033
- Table 41: France Touchscreen Table Revenue (billion) Forecast, by Application 2020 & 2033
- Table 42: France Touchscreen Table Volume (K) Forecast, by Application 2020 & 2033
- Table 43: Italy Touchscreen Table Revenue (billion) Forecast, by Application 2020 & 2033
- Table 44: Italy Touchscreen Table Volume (K) Forecast, by Application 2020 & 2033
- Table 45: Spain Touchscreen Table Revenue (billion) Forecast, by Application 2020 & 2033
- Table 46: Spain Touchscreen Table Volume (K) Forecast, by Application 2020 & 2033
- Table 47: Russia Touchscreen Table Revenue (billion) Forecast, by Application 2020 & 2033
- Table 48: Russia Touchscreen Table Volume (K) Forecast, by Application 2020 & 2033
- Table 49: Benelux Touchscreen Table Revenue (billion) Forecast, by Application 2020 & 2033
- Table 50: Benelux Touchscreen Table Volume (K) Forecast, by Application 2020 & 2033
- Table 51: Nordics Touchscreen Table Revenue (billion) Forecast, by Application 2020 & 2033
- Table 52: Nordics Touchscreen Table Volume (K) Forecast, by Application 2020 & 2033
- Table 53: Rest of Europe Touchscreen Table Revenue (billion) Forecast, by Application 2020 & 2033
- Table 54: Rest of Europe Touchscreen Table Volume (K) Forecast, by Application 2020 & 2033
- Table 55: Global Touchscreen Table Revenue billion Forecast, by Application 2020 & 2033
- Table 56: Global Touchscreen Table Volume K Forecast, by Application 2020 & 2033
- Table 57: Global Touchscreen Table Revenue billion Forecast, by Types 2020 & 2033
- Table 58: Global Touchscreen Table Volume K Forecast, by Types 2020 & 2033
- Table 59: Global Touchscreen Table Revenue billion Forecast, by Country 2020 & 2033
- Table 60: Global Touchscreen Table Volume K Forecast, by Country 2020 & 2033
- Table 61: Turkey Touchscreen Table Revenue (billion) Forecast, by Application 2020 & 2033
- Table 62: Turkey Touchscreen Table Volume (K) Forecast, by Application 2020 & 2033
- Table 63: Israel Touchscreen Table Revenue (billion) Forecast, by Application 2020 & 2033
- Table 64: Israel Touchscreen Table Volume (K) Forecast, by Application 2020 & 2033
- Table 65: GCC Touchscreen Table Revenue (billion) Forecast, by Application 2020 & 2033
- Table 66: GCC Touchscreen Table Volume (K) Forecast, by Application 2020 & 2033
- Table 67: North Africa Touchscreen Table Revenue (billion) Forecast, by Application 2020 & 2033
- Table 68: North Africa Touchscreen Table Volume (K) Forecast, by Application 2020 & 2033
- Table 69: South Africa Touchscreen Table Revenue (billion) Forecast, by Application 2020 & 2033
- Table 70: South Africa Touchscreen Table Volume (K) Forecast, by Application 2020 & 2033
- Table 71: Rest of Middle East & Africa Touchscreen Table Revenue (billion) Forecast, by Application 2020 & 2033
- Table 72: Rest of Middle East & Africa Touchscreen Table Volume (K) Forecast, by Application 2020 & 2033
- Table 73: Global Touchscreen Table Revenue billion Forecast, by Application 2020 & 2033
- Table 74: Global Touchscreen Table Volume K Forecast, by Application 2020 & 2033
- Table 75: Global Touchscreen Table Revenue billion Forecast, by Types 2020 & 2033
- Table 76: Global Touchscreen Table Volume K Forecast, by Types 2020 & 2033
- Table 77: Global Touchscreen Table Revenue billion Forecast, by Country 2020 & 2033
- Table 78: Global Touchscreen Table Volume K Forecast, by Country 2020 & 2033
- Table 79: China Touchscreen Table Revenue (billion) Forecast, by Application 2020 & 2033
- Table 80: China Touchscreen Table Volume (K) Forecast, by Application 2020 & 2033
- Table 81: India Touchscreen Table Revenue (billion) Forecast, by Application 2020 & 2033
- Table 82: India Touchscreen Table Volume (K) Forecast, by Application 2020 & 2033
- Table 83: Japan Touchscreen Table Revenue (billion) Forecast, by Application 2020 & 2033
- Table 84: Japan Touchscreen Table Volume (K) Forecast, by Application 2020 & 2033
- Table 85: South Korea Touchscreen Table Revenue (billion) Forecast, by Application 2020 & 2033
- Table 86: South Korea Touchscreen Table Volume (K) Forecast, by Application 2020 & 2033
- Table 87: ASEAN Touchscreen Table Revenue (billion) Forecast, by Application 2020 & 2033
- Table 88: ASEAN Touchscreen Table Volume (K) Forecast, by Application 2020 & 2033
- Table 89: Oceania Touchscreen Table Revenue (billion) Forecast, by Application 2020 & 2033
- Table 90: Oceania Touchscreen Table Volume (K) Forecast, by Application 2020 & 2033
- Table 91: Rest of Asia Pacific Touchscreen Table Revenue (billion) Forecast, by Application 2020 & 2033
- Table 92: Rest of Asia Pacific Touchscreen Table Volume (K) Forecast, by Application 2020 & 2033
Frequently Asked Questions
1. What is the projected Compound Annual Growth Rate (CAGR) of the Touchscreen Table?
The projected CAGR is approximately 13.8%.
2. Which companies are prominent players in the Touchscreen Table?
Key companies in the market include Pro Display, Ideum, Digital Touch Systems, MMT, LifeSize Touch, AV Media Systems, D-Table, eyefactive, Palas, multiCLASS, U-Touch, Newtouch, CDS, smartPerform, Prestop, ABB, TableConnect, Evoke Technologies, Sharp, Volanti, i Plan Tables, Promultis, IQ, staietech, Virtual On, ITA TOUCH, Interactive restaurant technology.
3. What are the main segments of the Touchscreen Table?
The market segments include Application, Types.
4. Can you provide details about the market size?
The market size is estimated to be USD 93.6 billion as of 2022.
5. What are some drivers contributing to market growth?
N/A
6. What are the notable trends driving market growth?
N/A
7. Are there any restraints impacting market growth?
N/A
8. Can you provide examples of recent developments in the market?
N/A
9. What pricing options are available for accessing the report?
Pricing options include single-user, multi-user, and enterprise licenses priced at USD 3350.00, USD 5025.00, and USD 6700.00 respectively.
10. Is the market size provided in terms of value or volume?
The market size is provided in terms of value, measured in billion and volume, measured in K.
11. Are there any specific market keywords associated with the report?
Yes, the market keyword associated with the report is "Touchscreen Table," which aids in identifying and referencing the specific market segment covered.
12. How do I determine which pricing option suits my needs best?
The pricing options vary based on user requirements and access needs. Individual users may opt for single-user licenses, while businesses requiring broader access may choose multi-user or enterprise licenses for cost-effective access to the report.
13. Are there any additional resources or data provided in the Touchscreen Table report?
While the report offers comprehensive insights, it's advisable to review the specific contents or supplementary materials provided to ascertain if additional resources or data are available.
14. How can I stay updated on further developments or reports in the Touchscreen Table?
To stay informed about further developments, trends, and reports in the Touchscreen Table, consider subscribing to industry newsletters, following relevant companies and organizations, or regularly checking reputable industry news sources and publications.
Methodology
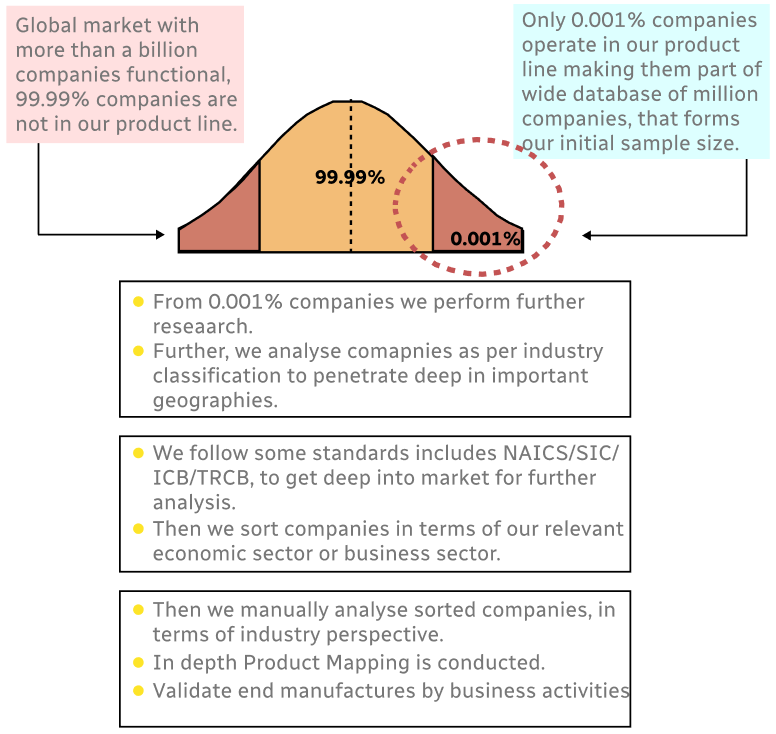
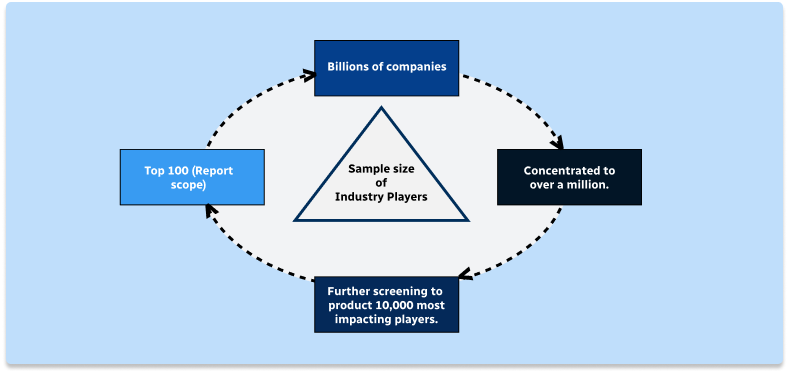
Step 1 - Identification of Relevant Samples Size from Population Database
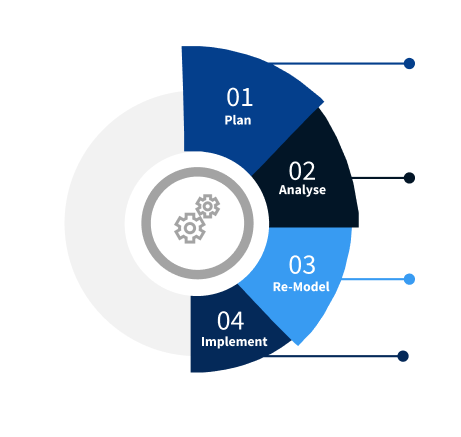
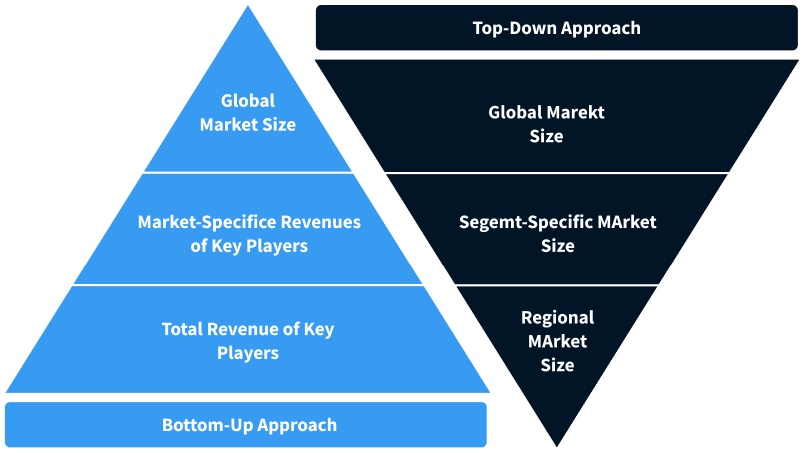
Step 2 - Approaches for Defining Global Market Size (Value, Volume* & Price*)
Note*: In applicable scenarios
Step 3 - Data Sources
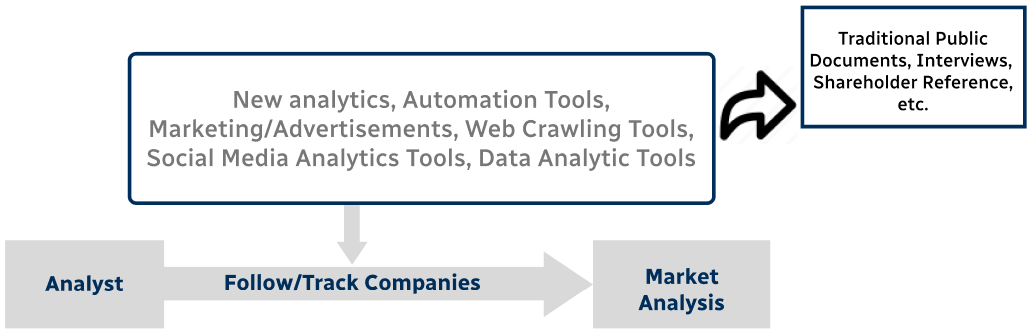
Primary Research
- Web Analytics
- Survey Reports
- Research Institute
- Latest Research Reports
- Opinion Leaders
Secondary Research
- Annual Reports
- White Paper
- Latest Press Release
- Industry Association
- Paid Database
- Investor Presentations
Step 4 - Data Triangulation
Involves using different sources of information in order to increase the validity of a study
These sources are likely to be stakeholders in a program - participants, other researchers, program staff, other community members, and so on.
Then we put all data in single framework & apply various statistical tools to find out the dynamic on the market.
During the analysis stage, feedback from the stakeholder groups would be compared to determine areas of agreement as well as areas of divergence