

Key Insights
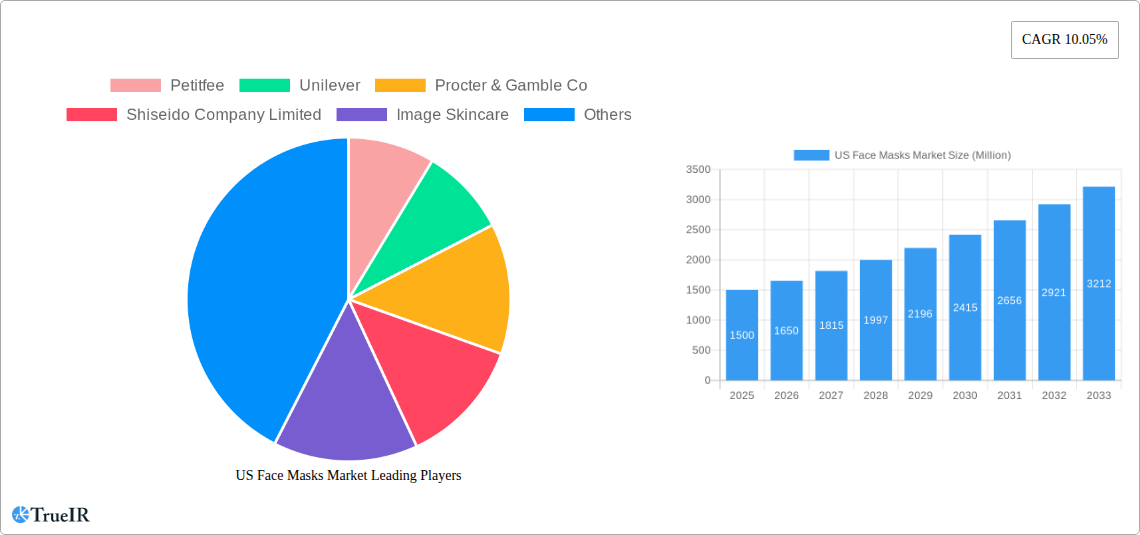
The U.S. face mask market, estimated at 9.17 billion in 2022, is poised for steady expansion. Growth is primarily fueled by heightened consumer awareness of skincare benefits and the pervasive influence of Korean beauty trends. Projections indicate a Compound Annual Growth Rate (CAGR) of 0.9%, suggesting sustained market development. Sheet masks currently lead product segments due to their convenience and affordability. However, wash-off and leave-in masks are gaining traction, offering targeted solutions for specific dermatological concerns. E-commerce channels are experiencing significant growth, complementing established retail avenues like convenience stores and supermarkets, ensuring broad consumer accessibility. Key industry players, including Petitfee, Unilever, Procter & Gamble, and L'Oréal, are actively investing in innovation and brand development. Their strategies emphasize natural and organic ingredients, personalized skincare solutions, and sustainable packaging to align with evolving consumer preferences. Regional adoption within the U.S. varies, presenting opportunities for market penetration in less developed skincare segments. Competitive pricing and effective marketing campaigns are critical market drivers, alongside increasing consumer demand for specialized masks addressing acne, anti-aging, and skin brightening.
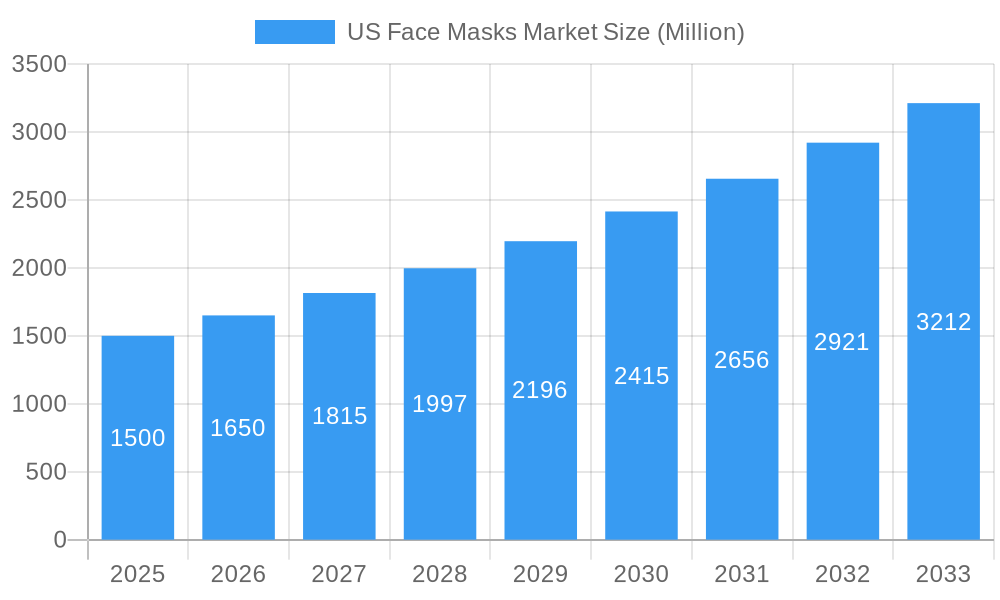
US Face Masks Market Market Size (In Billion)
Market expansion is anticipated through 2033, potentially moderating due to market saturation and economic factors. Key challenges include intense competition, fluctuating raw material costs, and the imperative for continuous product innovation. Strategic market segmentation is crucial for achieving projected growth, with companies focusing on specific demographics and skincare needs. The emphasis on eco-friendly and ethically sourced ingredients is increasingly influencing consumer purchasing decisions, offering a competitive advantage to sustainable brands. The integration of advanced manufacturing and marketing technologies will continue to shape the U.S. face mask market landscape.
US Face Masks Market Company Market Share
This report offers a comprehensive analysis of the U.S. face masks market, providing critical insights for businesses, investors, and stakeholders. Covering the period from 2022 to 2033, it details market trends, competitive dynamics, and growth opportunities within the U.S. face mask industry. The analysis includes robust data, such as CAGR projections, to illustrate market evolution and future potential.
US Face Masks Market Structure & Competitive Landscape
The US face masks market exhibits a moderately concentrated structure, with key players like Unilever, Procter & Gamble Co, and L'Oréal SA holding significant market share. However, the presence of numerous smaller niche brands and private labels fosters competitive intensity. Innovation is a crucial driver, with ongoing development of new mask formulations (e.g., bio-cellulose, hydrogel), advanced delivery systems, and specialized functionalities (e.g., anti-aging, brightening). Regulatory compliance, particularly regarding ingredient safety and labeling, plays a significant role, impacting product formulation and market entry. Product substitutes, including serums and other skincare treatments, present competitive pressure. The market is segmented by end-user demographics (e.g., age, gender, skin type), influencing product development and marketing strategies. M&A activity has been moderate, primarily involving smaller brands being acquired by larger players to expand their product portfolios and market reach. Concentration ratios for 2025 are estimated at xx% for the top 3 players and xx% for the top 5. The number of M&A transactions in the historical period (2019-2024) averaged xx per year.
US Face Masks Market Market Trends & Opportunities
The US face masks market experienced significant growth during the historical period (2019-2024), driven by increased consumer awareness of skincare benefits and the rising popularity of Korean beauty trends. The market size reached an estimated value of $xx Million in 2024 and is projected to reach $xx Million by 2033, exhibiting a CAGR of xx% during the forecast period (2025-2033). Technological advancements, including the introduction of innovative mask materials and functionalities, contribute to market expansion. Changing consumer preferences towards natural and organic ingredients are creating new opportunities for brands. The heightened awareness of skincare routines, particularly among millennials and Gen Z, fuels demand. Competitive dynamics are characterized by product differentiation, brand building, and strategic pricing strategies. Market penetration rates for sheet masks and wash-off masks are estimated at xx% and xx%, respectively, in 2025.
Dominant Markets & Segments in US Face Masks Market
The sheet mask segment dominates the US face masks market in terms of both value and volume, driven by its convenience and efficacy. Wash-off/leave-in masks hold a substantial share, appealing to consumers seeking more intense treatments.
By Product Type:
- Sheet Mask: High demand due to convenience, ease of use, and diverse formulations. Growth fueled by increasing disposable incomes and a preference for quick, effective skincare solutions.
- Wash-Off Mask/Leave-in Mask: Growing popularity due to targeted treatments for specific skin concerns, like acne or dryness. This segment benefits from increasing consumer interest in sophisticated skincare regimens.
By Distribution Channel:
- Online Retail Stores: The fastest-growing channel, benefiting from e-commerce expansion and direct-to-consumer marketing.
- Specialty Stores: Maintain a strong position due to expert advice and curated product selection.
- Supermarkets/Hypermarkets: Provide widespread accessibility and convenience, capturing a significant market share.
- Convenience Stores: Offer a smaller, more selective range of face masks, catering to quick purchases.
The South-West region shows highest growth due to factors such as favorable climate and high concentration of beauty-conscious consumers.
US Face Masks Market Product Analysis
Product innovation is central to the US face masks market. Advancements in material science have led to the development of bio-cellulose masks, hydrogel masks, and masks infused with advanced active ingredients, offering superior hydration, absorption, and targeted treatment. The market showcases a wide range of applications, addressing various skin concerns—from acne and dryness to anti-aging and brightening—to cater to diverse consumer needs. The competitive advantage hinges on unique formulations, innovative delivery systems, and compelling branding that aligns with consumer values and preferences.
Key Drivers, Barriers & Challenges in US Face Masks Market
Key Drivers:
The market is propelled by rising consumer disposable incomes, a growing awareness of skincare benefits, and the increasing popularity of Korean beauty trends. Technological advancements in mask formulations and delivery systems fuel innovation and market expansion. Favorable regulatory environments encourage market entry and growth.
Key Challenges:
Supply chain disruptions, particularly regarding raw materials and packaging, pose significant challenges. Intense competition from both established brands and new entrants creates pressure on pricing and profitability. Stringent regulatory requirements related to ingredient safety and labeling necessitate compliance costs and potentially limit product innovation.
Growth Drivers in the US Face Masks Market Market
Growth is primarily driven by increasing consumer awareness of skincare and beauty routines, coupled with the rising popularity of at-home skincare treatments. Economic factors, including disposable income growth and consumer spending on personal care, also contribute to market expansion. Favorable regulatory frameworks and technological innovation (such as biodegradable materials) further stimulate market growth.
Challenges Impacting US Face Masks Market Growth
The market faces challenges from fluctuations in raw material costs impacting production and pricing. Stringent regulations on ingredients and labeling necessitate compliance costs that can be a barrier for smaller companies. The increasing dominance of large players presents a challenge for smaller brands to compete effectively.
Key Players Shaping the US Face Masks Market Market
- Petitfee
- Unilever
- Procter & Gamble Co
- Shiseido Company Limited
- Image Skincare
- LOreal SA
- Natura & Co
- Mary Kay Inc
- Johnson & Johnson Inc
- Masqueology
Significant US Face Masks Market Industry Milestones
- 2020: Increased demand for face masks due to the COVID-19 pandemic.
- 2021: Launch of several innovative bio-cellulose and hydrogel face mask lines by major players.
- 2022: Significant increase in online sales of face masks.
- 2023: Growing focus on sustainability and eco-friendly packaging for face masks.
Future Outlook for US Face Masks Market Market
The US face masks market is poised for continued growth, driven by ongoing innovation, evolving consumer preferences, and the expansion of e-commerce. Strategic opportunities exist in developing personalized, customized masks catering to specific skin concerns and leveraging digital marketing to reach a wider audience. The market's potential is significant, with projected substantial growth over the forecast period.
US Face Masks Market Segmentation
-
1. Product Type
- 1.1. Sheet Mask
- 1.2. Wash-Off Mask/Leave-in Mask
-
2. Distribution Channel
- 2.1. Convenience Stores
- 2.2. Supermarkets/Hypermarkets
- 2.3. Specialty Stores
- 2.4. Online Retail Stores
- 2.5. Other Distribution Channels
US Face Masks Market Segmentation By Geography
-
1. North America
- 1.1. United States
- 1.2. Canada
- 1.3. Mexico
-
2. South America
- 2.1. Brazil
- 2.2. Argentina
- 2.3. Rest of South America
-
3. Europe
- 3.1. United Kingdom
- 3.2. Germany
- 3.3. France
- 3.4. Italy
- 3.5. Spain
- 3.6. Russia
- 3.7. Benelux
- 3.8. Nordics
- 3.9. Rest of Europe
-
4. Middle East & Africa
- 4.1. Turkey
- 4.2. Israel
- 4.3. GCC
- 4.4. North Africa
- 4.5. South Africa
- 4.6. Rest of Middle East & Africa
-
5. Asia Pacific
- 5.1. China
- 5.2. India
- 5.3. Japan
- 5.4. South Korea
- 5.5. ASEAN
- 5.6. Oceania
- 5.7. Rest of Asia Pacific
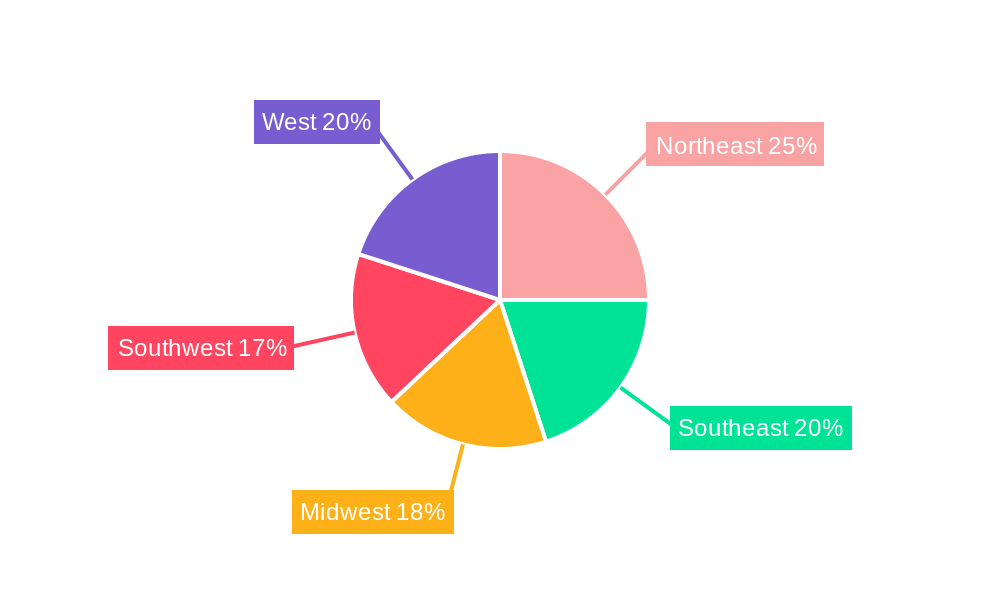
US Face Masks Market Regional Market Share
Geographic Coverage of US Face Masks Market
US Face Masks Market REPORT HIGHLIGHTS
| Aspects | Details |
|---|---|
| Study Period | 2020-2034 |
| Base Year | 2025 |
| Estimated Year | 2026 |
| Forecast Period | 2026-2034 |
| Historical Period | 2020-2025 |
| Growth Rate | CAGR of 0.9% from 2020-2034 |
| Segmentation |
|
Table of Contents
- 1. Introduction
- 1.1. Research Scope
- 1.2. Market Segmentation
- 1.3. Research Objective
- 1.4. Definitions and Assumptions
- 2. Executive Summary
- 2.1. Market Snapshot
- 3. Market Dynamics
- 3.1. Market Drivers
- 3.2. Market Restrains
- 3.3. Market Trends
- 3.4. Market Opportunities
- 4. Market Factor Analysis
- 4.1. Porters Five Forces
- 4.1.1. Bargaining Power of Suppliers
- 4.1.2. Bargaining Power of Buyers
- 4.1.3. Threat of New Entrants
- 4.1.4. Threat of Substitutes
- 4.1.5. Competitive Rivalry
- 4.2. PESTEL analysis
- 4.3. BCG Analysis
- 4.3.1. Stars (High Growth, High Market Share)
- 4.3.2. Cash Cows (Low Growth, High Market Share)
- 4.3.3. Question Mark (High Growth, Low Market Share)
- 4.3.4. Dogs (Low Growth, Low Market Share)
- 4.4. Ansoff Matrix Analysis
- 4.5. Supply Chain Analysis
- 4.6. Regulatory Landscape
- 4.7. Current Market Potential and Opportunity Assessment (TAM–SAM–SOM Framework)
- 4.8. TIR Analyst Note
- 4.1. Porters Five Forces
- 5. Market Analysis, Insights and Forecast 2021-2033
- 5.1. Market Analysis, Insights and Forecast - by Product Type
- 5.1.1. Sheet Mask
- 5.1.2. Wash-Off Mask/Leave-in Mask
- 5.2. Market Analysis, Insights and Forecast - by Distribution Channel
- 5.2.1. Convenience Stores
- 5.2.2. Supermarkets/Hypermarkets
- 5.2.3. Specialty Stores
- 5.2.4. Online Retail Stores
- 5.2.5. Other Distribution Channels
- 5.3. Market Analysis, Insights and Forecast - by Region
- 5.3.1. North America
- 5.3.2. South America
- 5.3.3. Europe
- 5.3.4. Middle East & Africa
- 5.3.5. Asia Pacific
- 5.1. Market Analysis, Insights and Forecast - by Product Type
- 6. Global US Face Masks Market Analysis, Insights and Forecast, 2021-2033
- 6.1. Market Analysis, Insights and Forecast - by Product Type
- 6.1.1. Sheet Mask
- 6.1.2. Wash-Off Mask/Leave-in Mask
- 6.2. Market Analysis, Insights and Forecast - by Distribution Channel
- 6.2.1. Convenience Stores
- 6.2.2. Supermarkets/Hypermarkets
- 6.2.3. Specialty Stores
- 6.2.4. Online Retail Stores
- 6.2.5. Other Distribution Channels
- 6.1. Market Analysis, Insights and Forecast - by Product Type
- 7. North America US Face Masks Market Analysis, Insights and Forecast, 2020-2032
- 7.1. Market Analysis, Insights and Forecast - by Product Type
- 7.1.1. Sheet Mask
- 7.1.2. Wash-Off Mask/Leave-in Mask
- 7.2. Market Analysis, Insights and Forecast - by Distribution Channel
- 7.2.1. Convenience Stores
- 7.2.2. Supermarkets/Hypermarkets
- 7.2.3. Specialty Stores
- 7.2.4. Online Retail Stores
- 7.2.5. Other Distribution Channels
- 7.1. Market Analysis, Insights and Forecast - by Product Type
- 8. South America US Face Masks Market Analysis, Insights and Forecast, 2020-2032
- 8.1. Market Analysis, Insights and Forecast - by Product Type
- 8.1.1. Sheet Mask
- 8.1.2. Wash-Off Mask/Leave-in Mask
- 8.2. Market Analysis, Insights and Forecast - by Distribution Channel
- 8.2.1. Convenience Stores
- 8.2.2. Supermarkets/Hypermarkets
- 8.2.3. Specialty Stores
- 8.2.4. Online Retail Stores
- 8.2.5. Other Distribution Channels
- 8.1. Market Analysis, Insights and Forecast - by Product Type
- 9. Europe US Face Masks Market Analysis, Insights and Forecast, 2020-2032
- 9.1. Market Analysis, Insights and Forecast - by Product Type
- 9.1.1. Sheet Mask
- 9.1.2. Wash-Off Mask/Leave-in Mask
- 9.2. Market Analysis, Insights and Forecast - by Distribution Channel
- 9.2.1. Convenience Stores
- 9.2.2. Supermarkets/Hypermarkets
- 9.2.3. Specialty Stores
- 9.2.4. Online Retail Stores
- 9.2.5. Other Distribution Channels
- 9.1. Market Analysis, Insights and Forecast - by Product Type
- 10. Middle East & Africa US Face Masks Market Analysis, Insights and Forecast, 2020-2032
- 10.1. Market Analysis, Insights and Forecast - by Product Type
- 10.1.1. Sheet Mask
- 10.1.2. Wash-Off Mask/Leave-in Mask
- 10.2. Market Analysis, Insights and Forecast - by Distribution Channel
- 10.2.1. Convenience Stores
- 10.2.2. Supermarkets/Hypermarkets
- 10.2.3. Specialty Stores
- 10.2.4. Online Retail Stores
- 10.2.5. Other Distribution Channels
- 10.1. Market Analysis, Insights and Forecast - by Product Type
- 11. Asia Pacific US Face Masks Market Analysis, Insights and Forecast, 2020-2032
- 11.1. Market Analysis, Insights and Forecast - by Product Type
- 11.1.1. Sheet Mask
- 11.1.2. Wash-Off Mask/Leave-in Mask
- 11.2. Market Analysis, Insights and Forecast - by Distribution Channel
- 11.2.1. Convenience Stores
- 11.2.2. Supermarkets/Hypermarkets
- 11.2.3. Specialty Stores
- 11.2.4. Online Retail Stores
- 11.2.5. Other Distribution Channels
- 11.1. Market Analysis, Insights and Forecast - by Product Type
- 12. Competitive Analysis
- 12.1. Company Profiles
- 12.1.1 Petitfee
- 12.1.1.1. Company Overview
- 12.1.1.2. Products
- 12.1.1.3. Company Financials
- 12.1.1.4. SWOT Analysis
- 12.1.2 Unilever
- 12.1.2.1. Company Overview
- 12.1.2.2. Products
- 12.1.2.3. Company Financials
- 12.1.2.4. SWOT Analysis
- 12.1.3 Procter & Gamble Co
- 12.1.3.1. Company Overview
- 12.1.3.2. Products
- 12.1.3.3. Company Financials
- 12.1.3.4. SWOT Analysis
- 12.1.4 Shiseido Company Limited
- 12.1.4.1. Company Overview
- 12.1.4.2. Products
- 12.1.4.3. Company Financials
- 12.1.4.4. SWOT Analysis
- 12.1.5 Image Skincare
- 12.1.5.1. Company Overview
- 12.1.5.2. Products
- 12.1.5.3. Company Financials
- 12.1.5.4. SWOT Analysis
- 12.1.6 LOreal SA
- 12.1.6.1. Company Overview
- 12.1.6.2. Products
- 12.1.6.3. Company Financials
- 12.1.6.4. SWOT Analysis
- 12.1.7 Natura & Co
- 12.1.7.1. Company Overview
- 12.1.7.2. Products
- 12.1.7.3. Company Financials
- 12.1.7.4. SWOT Analysis
- 12.1.8 Mary Kay Inc *List Not Exhaustive
- 12.1.8.1. Company Overview
- 12.1.8.2. Products
- 12.1.8.3. Company Financials
- 12.1.8.4. SWOT Analysis
- 12.1.9 Johnson & Johnson Inc
- 12.1.9.1. Company Overview
- 12.1.9.2. Products
- 12.1.9.3. Company Financials
- 12.1.9.4. SWOT Analysis
- 12.1.10 Masqueology
- 12.1.10.1. Company Overview
- 12.1.10.2. Products
- 12.1.10.3. Company Financials
- 12.1.10.4. SWOT Analysis
- 12.1.1 Petitfee
- 12.2. Market Entropy
- 12.2.1 Company's Key Areas Served
- 12.2.2 Recent Developments
- 12.3. Company Market Share Analysis 2025
- 12.3.1 Top 5 Companies Market Share Analysis
- 12.3.2 Top 3 Companies Market Share Analysis
- 12.4. List of Potential Customers
- 13. Research Methodology
List of Figures
- Figure 1: Global US Face Masks Market Revenue Breakdown (billion, %) by Region 2025 & 2033
- Figure 2: Global US Face Masks Market Volume Breakdown (K Units, %) by Region 2025 & 2033
- Figure 3: North America US Face Masks Market Revenue (billion), by Product Type 2025 & 2033
- Figure 4: North America US Face Masks Market Volume (K Units), by Product Type 2025 & 2033
- Figure 5: North America US Face Masks Market Revenue Share (%), by Product Type 2025 & 2033
- Figure 6: North America US Face Masks Market Volume Share (%), by Product Type 2025 & 2033
- Figure 7: North America US Face Masks Market Revenue (billion), by Distribution Channel 2025 & 2033
- Figure 8: North America US Face Masks Market Volume (K Units), by Distribution Channel 2025 & 2033
- Figure 9: North America US Face Masks Market Revenue Share (%), by Distribution Channel 2025 & 2033
- Figure 10: North America US Face Masks Market Volume Share (%), by Distribution Channel 2025 & 2033
- Figure 11: North America US Face Masks Market Revenue (billion), by Country 2025 & 2033
- Figure 12: North America US Face Masks Market Volume (K Units), by Country 2025 & 2033
- Figure 13: North America US Face Masks Market Revenue Share (%), by Country 2025 & 2033
- Figure 14: North America US Face Masks Market Volume Share (%), by Country 2025 & 2033
- Figure 15: South America US Face Masks Market Revenue (billion), by Product Type 2025 & 2033
- Figure 16: South America US Face Masks Market Volume (K Units), by Product Type 2025 & 2033
- Figure 17: South America US Face Masks Market Revenue Share (%), by Product Type 2025 & 2033
- Figure 18: South America US Face Masks Market Volume Share (%), by Product Type 2025 & 2033
- Figure 19: South America US Face Masks Market Revenue (billion), by Distribution Channel 2025 & 2033
- Figure 20: South America US Face Masks Market Volume (K Units), by Distribution Channel 2025 & 2033
- Figure 21: South America US Face Masks Market Revenue Share (%), by Distribution Channel 2025 & 2033
- Figure 22: South America US Face Masks Market Volume Share (%), by Distribution Channel 2025 & 2033
- Figure 23: South America US Face Masks Market Revenue (billion), by Country 2025 & 2033
- Figure 24: South America US Face Masks Market Volume (K Units), by Country 2025 & 2033
- Figure 25: South America US Face Masks Market Revenue Share (%), by Country 2025 & 2033
- Figure 26: South America US Face Masks Market Volume Share (%), by Country 2025 & 2033
- Figure 27: Europe US Face Masks Market Revenue (billion), by Product Type 2025 & 2033
- Figure 28: Europe US Face Masks Market Volume (K Units), by Product Type 2025 & 2033
- Figure 29: Europe US Face Masks Market Revenue Share (%), by Product Type 2025 & 2033
- Figure 30: Europe US Face Masks Market Volume Share (%), by Product Type 2025 & 2033
- Figure 31: Europe US Face Masks Market Revenue (billion), by Distribution Channel 2025 & 2033
- Figure 32: Europe US Face Masks Market Volume (K Units), by Distribution Channel 2025 & 2033
- Figure 33: Europe US Face Masks Market Revenue Share (%), by Distribution Channel 2025 & 2033
- Figure 34: Europe US Face Masks Market Volume Share (%), by Distribution Channel 2025 & 2033
- Figure 35: Europe US Face Masks Market Revenue (billion), by Country 2025 & 2033
- Figure 36: Europe US Face Masks Market Volume (K Units), by Country 2025 & 2033
- Figure 37: Europe US Face Masks Market Revenue Share (%), by Country 2025 & 2033
- Figure 38: Europe US Face Masks Market Volume Share (%), by Country 2025 & 2033
- Figure 39: Middle East & Africa US Face Masks Market Revenue (billion), by Product Type 2025 & 2033
- Figure 40: Middle East & Africa US Face Masks Market Volume (K Units), by Product Type 2025 & 2033
- Figure 41: Middle East & Africa US Face Masks Market Revenue Share (%), by Product Type 2025 & 2033
- Figure 42: Middle East & Africa US Face Masks Market Volume Share (%), by Product Type 2025 & 2033
- Figure 43: Middle East & Africa US Face Masks Market Revenue (billion), by Distribution Channel 2025 & 2033
- Figure 44: Middle East & Africa US Face Masks Market Volume (K Units), by Distribution Channel 2025 & 2033
- Figure 45: Middle East & Africa US Face Masks Market Revenue Share (%), by Distribution Channel 2025 & 2033
- Figure 46: Middle East & Africa US Face Masks Market Volume Share (%), by Distribution Channel 2025 & 2033
- Figure 47: Middle East & Africa US Face Masks Market Revenue (billion), by Country 2025 & 2033
- Figure 48: Middle East & Africa US Face Masks Market Volume (K Units), by Country 2025 & 2033
- Figure 49: Middle East & Africa US Face Masks Market Revenue Share (%), by Country 2025 & 2033
- Figure 50: Middle East & Africa US Face Masks Market Volume Share (%), by Country 2025 & 2033
- Figure 51: Asia Pacific US Face Masks Market Revenue (billion), by Product Type 2025 & 2033
- Figure 52: Asia Pacific US Face Masks Market Volume (K Units), by Product Type 2025 & 2033
- Figure 53: Asia Pacific US Face Masks Market Revenue Share (%), by Product Type 2025 & 2033
- Figure 54: Asia Pacific US Face Masks Market Volume Share (%), by Product Type 2025 & 2033
- Figure 55: Asia Pacific US Face Masks Market Revenue (billion), by Distribution Channel 2025 & 2033
- Figure 56: Asia Pacific US Face Masks Market Volume (K Units), by Distribution Channel 2025 & 2033
- Figure 57: Asia Pacific US Face Masks Market Revenue Share (%), by Distribution Channel 2025 & 2033
- Figure 58: Asia Pacific US Face Masks Market Volume Share (%), by Distribution Channel 2025 & 2033
- Figure 59: Asia Pacific US Face Masks Market Revenue (billion), by Country 2025 & 2033
- Figure 60: Asia Pacific US Face Masks Market Volume (K Units), by Country 2025 & 2033
- Figure 61: Asia Pacific US Face Masks Market Revenue Share (%), by Country 2025 & 2033
- Figure 62: Asia Pacific US Face Masks Market Volume Share (%), by Country 2025 & 2033
List of Tables
- Table 1: Global US Face Masks Market Revenue billion Forecast, by Product Type 2020 & 2033
- Table 2: Global US Face Masks Market Volume K Units Forecast, by Product Type 2020 & 2033
- Table 3: Global US Face Masks Market Revenue billion Forecast, by Distribution Channel 2020 & 2033
- Table 4: Global US Face Masks Market Volume K Units Forecast, by Distribution Channel 2020 & 2033
- Table 5: Global US Face Masks Market Revenue billion Forecast, by Region 2020 & 2033
- Table 6: Global US Face Masks Market Volume K Units Forecast, by Region 2020 & 2033
- Table 7: Global US Face Masks Market Revenue billion Forecast, by Product Type 2020 & 2033
- Table 8: Global US Face Masks Market Volume K Units Forecast, by Product Type 2020 & 2033
- Table 9: Global US Face Masks Market Revenue billion Forecast, by Distribution Channel 2020 & 2033
- Table 10: Global US Face Masks Market Volume K Units Forecast, by Distribution Channel 2020 & 2033
- Table 11: Global US Face Masks Market Revenue billion Forecast, by Country 2020 & 2033
- Table 12: Global US Face Masks Market Volume K Units Forecast, by Country 2020 & 2033
- Table 13: United States US Face Masks Market Revenue (billion) Forecast, by Application 2020 & 2033
- Table 14: United States US Face Masks Market Volume (K Units) Forecast, by Application 2020 & 2033
- Table 15: Canada US Face Masks Market Revenue (billion) Forecast, by Application 2020 & 2033
- Table 16: Canada US Face Masks Market Volume (K Units) Forecast, by Application 2020 & 2033
- Table 17: Mexico US Face Masks Market Revenue (billion) Forecast, by Application 2020 & 2033
- Table 18: Mexico US Face Masks Market Volume (K Units) Forecast, by Application 2020 & 2033
- Table 19: Global US Face Masks Market Revenue billion Forecast, by Product Type 2020 & 2033
- Table 20: Global US Face Masks Market Volume K Units Forecast, by Product Type 2020 & 2033
- Table 21: Global US Face Masks Market Revenue billion Forecast, by Distribution Channel 2020 & 2033
- Table 22: Global US Face Masks Market Volume K Units Forecast, by Distribution Channel 2020 & 2033
- Table 23: Global US Face Masks Market Revenue billion Forecast, by Country 2020 & 2033
- Table 24: Global US Face Masks Market Volume K Units Forecast, by Country 2020 & 2033
- Table 25: Brazil US Face Masks Market Revenue (billion) Forecast, by Application 2020 & 2033
- Table 26: Brazil US Face Masks Market Volume (K Units) Forecast, by Application 2020 & 2033
- Table 27: Argentina US Face Masks Market Revenue (billion) Forecast, by Application 2020 & 2033
- Table 28: Argentina US Face Masks Market Volume (K Units) Forecast, by Application 2020 & 2033
- Table 29: Rest of South America US Face Masks Market Revenue (billion) Forecast, by Application 2020 & 2033
- Table 30: Rest of South America US Face Masks Market Volume (K Units) Forecast, by Application 2020 & 2033
- Table 31: Global US Face Masks Market Revenue billion Forecast, by Product Type 2020 & 2033
- Table 32: Global US Face Masks Market Volume K Units Forecast, by Product Type 2020 & 2033
- Table 33: Global US Face Masks Market Revenue billion Forecast, by Distribution Channel 2020 & 2033
- Table 34: Global US Face Masks Market Volume K Units Forecast, by Distribution Channel 2020 & 2033
- Table 35: Global US Face Masks Market Revenue billion Forecast, by Country 2020 & 2033
- Table 36: Global US Face Masks Market Volume K Units Forecast, by Country 2020 & 2033
- Table 37: United Kingdom US Face Masks Market Revenue (billion) Forecast, by Application 2020 & 2033
- Table 38: United Kingdom US Face Masks Market Volume (K Units) Forecast, by Application 2020 & 2033
- Table 39: Germany US Face Masks Market Revenue (billion) Forecast, by Application 2020 & 2033
- Table 40: Germany US Face Masks Market Volume (K Units) Forecast, by Application 2020 & 2033
- Table 41: France US Face Masks Market Revenue (billion) Forecast, by Application 2020 & 2033
- Table 42: France US Face Masks Market Volume (K Units) Forecast, by Application 2020 & 2033
- Table 43: Italy US Face Masks Market Revenue (billion) Forecast, by Application 2020 & 2033
- Table 44: Italy US Face Masks Market Volume (K Units) Forecast, by Application 2020 & 2033
- Table 45: Spain US Face Masks Market Revenue (billion) Forecast, by Application 2020 & 2033
- Table 46: Spain US Face Masks Market Volume (K Units) Forecast, by Application 2020 & 2033
- Table 47: Russia US Face Masks Market Revenue (billion) Forecast, by Application 2020 & 2033
- Table 48: Russia US Face Masks Market Volume (K Units) Forecast, by Application 2020 & 2033
- Table 49: Benelux US Face Masks Market Revenue (billion) Forecast, by Application 2020 & 2033
- Table 50: Benelux US Face Masks Market Volume (K Units) Forecast, by Application 2020 & 2033
- Table 51: Nordics US Face Masks Market Revenue (billion) Forecast, by Application 2020 & 2033
- Table 52: Nordics US Face Masks Market Volume (K Units) Forecast, by Application 2020 & 2033
- Table 53: Rest of Europe US Face Masks Market Revenue (billion) Forecast, by Application 2020 & 2033
- Table 54: Rest of Europe US Face Masks Market Volume (K Units) Forecast, by Application 2020 & 2033
- Table 55: Global US Face Masks Market Revenue billion Forecast, by Product Type 2020 & 2033
- Table 56: Global US Face Masks Market Volume K Units Forecast, by Product Type 2020 & 2033
- Table 57: Global US Face Masks Market Revenue billion Forecast, by Distribution Channel 2020 & 2033
- Table 58: Global US Face Masks Market Volume K Units Forecast, by Distribution Channel 2020 & 2033
- Table 59: Global US Face Masks Market Revenue billion Forecast, by Country 2020 & 2033
- Table 60: Global US Face Masks Market Volume K Units Forecast, by Country 2020 & 2033
- Table 61: Turkey US Face Masks Market Revenue (billion) Forecast, by Application 2020 & 2033
- Table 62: Turkey US Face Masks Market Volume (K Units) Forecast, by Application 2020 & 2033
- Table 63: Israel US Face Masks Market Revenue (billion) Forecast, by Application 2020 & 2033
- Table 64: Israel US Face Masks Market Volume (K Units) Forecast, by Application 2020 & 2033
- Table 65: GCC US Face Masks Market Revenue (billion) Forecast, by Application 2020 & 2033
- Table 66: GCC US Face Masks Market Volume (K Units) Forecast, by Application 2020 & 2033
- Table 67: North Africa US Face Masks Market Revenue (billion) Forecast, by Application 2020 & 2033
- Table 68: North Africa US Face Masks Market Volume (K Units) Forecast, by Application 2020 & 2033
- Table 69: South Africa US Face Masks Market Revenue (billion) Forecast, by Application 2020 & 2033
- Table 70: South Africa US Face Masks Market Volume (K Units) Forecast, by Application 2020 & 2033
- Table 71: Rest of Middle East & Africa US Face Masks Market Revenue (billion) Forecast, by Application 2020 & 2033
- Table 72: Rest of Middle East & Africa US Face Masks Market Volume (K Units) Forecast, by Application 2020 & 2033
- Table 73: Global US Face Masks Market Revenue billion Forecast, by Product Type 2020 & 2033
- Table 74: Global US Face Masks Market Volume K Units Forecast, by Product Type 2020 & 2033
- Table 75: Global US Face Masks Market Revenue billion Forecast, by Distribution Channel 2020 & 2033
- Table 76: Global US Face Masks Market Volume K Units Forecast, by Distribution Channel 2020 & 2033
- Table 77: Global US Face Masks Market Revenue billion Forecast, by Country 2020 & 2033
- Table 78: Global US Face Masks Market Volume K Units Forecast, by Country 2020 & 2033
- Table 79: China US Face Masks Market Revenue (billion) Forecast, by Application 2020 & 2033
- Table 80: China US Face Masks Market Volume (K Units) Forecast, by Application 2020 & 2033
- Table 81: India US Face Masks Market Revenue (billion) Forecast, by Application 2020 & 2033
- Table 82: India US Face Masks Market Volume (K Units) Forecast, by Application 2020 & 2033
- Table 83: Japan US Face Masks Market Revenue (billion) Forecast, by Application 2020 & 2033
- Table 84: Japan US Face Masks Market Volume (K Units) Forecast, by Application 2020 & 2033
- Table 85: South Korea US Face Masks Market Revenue (billion) Forecast, by Application 2020 & 2033
- Table 86: South Korea US Face Masks Market Volume (K Units) Forecast, by Application 2020 & 2033
- Table 87: ASEAN US Face Masks Market Revenue (billion) Forecast, by Application 2020 & 2033
- Table 88: ASEAN US Face Masks Market Volume (K Units) Forecast, by Application 2020 & 2033
- Table 89: Oceania US Face Masks Market Revenue (billion) Forecast, by Application 2020 & 2033
- Table 90: Oceania US Face Masks Market Volume (K Units) Forecast, by Application 2020 & 2033
- Table 91: Rest of Asia Pacific US Face Masks Market Revenue (billion) Forecast, by Application 2020 & 2033
- Table 92: Rest of Asia Pacific US Face Masks Market Volume (K Units) Forecast, by Application 2020 & 2033
Frequently Asked Questions
1. What is the projected Compound Annual Growth Rate (CAGR) of the US Face Masks Market?
The projected CAGR is approximately 0.9%.
2. Which companies are prominent players in the US Face Masks Market?
Key companies in the market include Petitfee, Unilever, Procter & Gamble Co, Shiseido Company Limited, Image Skincare, LOreal SA, Natura & Co, Mary Kay Inc *List Not Exhaustive, Johnson & Johnson Inc, Masqueology.
3. What are the main segments of the US Face Masks Market?
The market segments include Product Type, Distribution Channel.
4. Can you provide details about the market size?
The market size is estimated to be USD 9.17 billion as of 2022.
5. What are some drivers contributing to market growth?
Increasing Demand for Natural/Organic Products; Increased Focus on Facial Care Regimes.
6. What are the notable trends driving market growth?
Rising Consumer Spending on Skin and Facial Care Products.
7. Are there any restraints impacting market growth?
Presence of Counterfeit Products Restraints Growth.
8. Can you provide examples of recent developments in the market?
N/A
9. What pricing options are available for accessing the report?
Pricing options include single-user, multi-user, and enterprise licenses priced at USD 3800, USD 4500, and USD 5800 respectively.
10. Is the market size provided in terms of value or volume?
The market size is provided in terms of value, measured in billion and volume, measured in K Units.
11. Are there any specific market keywords associated with the report?
Yes, the market keyword associated with the report is "US Face Masks Market," which aids in identifying and referencing the specific market segment covered.
12. How do I determine which pricing option suits my needs best?
The pricing options vary based on user requirements and access needs. Individual users may opt for single-user licenses, while businesses requiring broader access may choose multi-user or enterprise licenses for cost-effective access to the report.
13. Are there any additional resources or data provided in the US Face Masks Market report?
While the report offers comprehensive insights, it's advisable to review the specific contents or supplementary materials provided to ascertain if additional resources or data are available.
14. How can I stay updated on further developments or reports in the US Face Masks Market?
To stay informed about further developments, trends, and reports in the US Face Masks Market, consider subscribing to industry newsletters, following relevant companies and organizations, or regularly checking reputable industry news sources and publications.
Methodology
Step 1 - Identification of Relevant Samples Size from Population Database


Step 2 - Approaches for Defining Global Market Size (Value, Volume* & Price*)

Note*: In applicable scenarios
Step 3 - Data Sources
Primary Research
- Web Analytics
- Survey Reports
- Research Institute
- Latest Research Reports
- Opinion Leaders
Secondary Research
- Annual Reports
- White Paper
- Latest Press Release
- Industry Association
- Paid Database
- Investor Presentations

Step 4 - Data Triangulation
Involves using different sources of information in order to increase the validity of a study
These sources are likely to be stakeholders in a program - participants, other researchers, program staff, other community members, and so on.
Then we put all data in single framework & apply various statistical tools to find out the dynamic on the market.
During the analysis stage, feedback from the stakeholder groups would be compared to determine areas of agreement as well as areas of divergence