

Key Insights
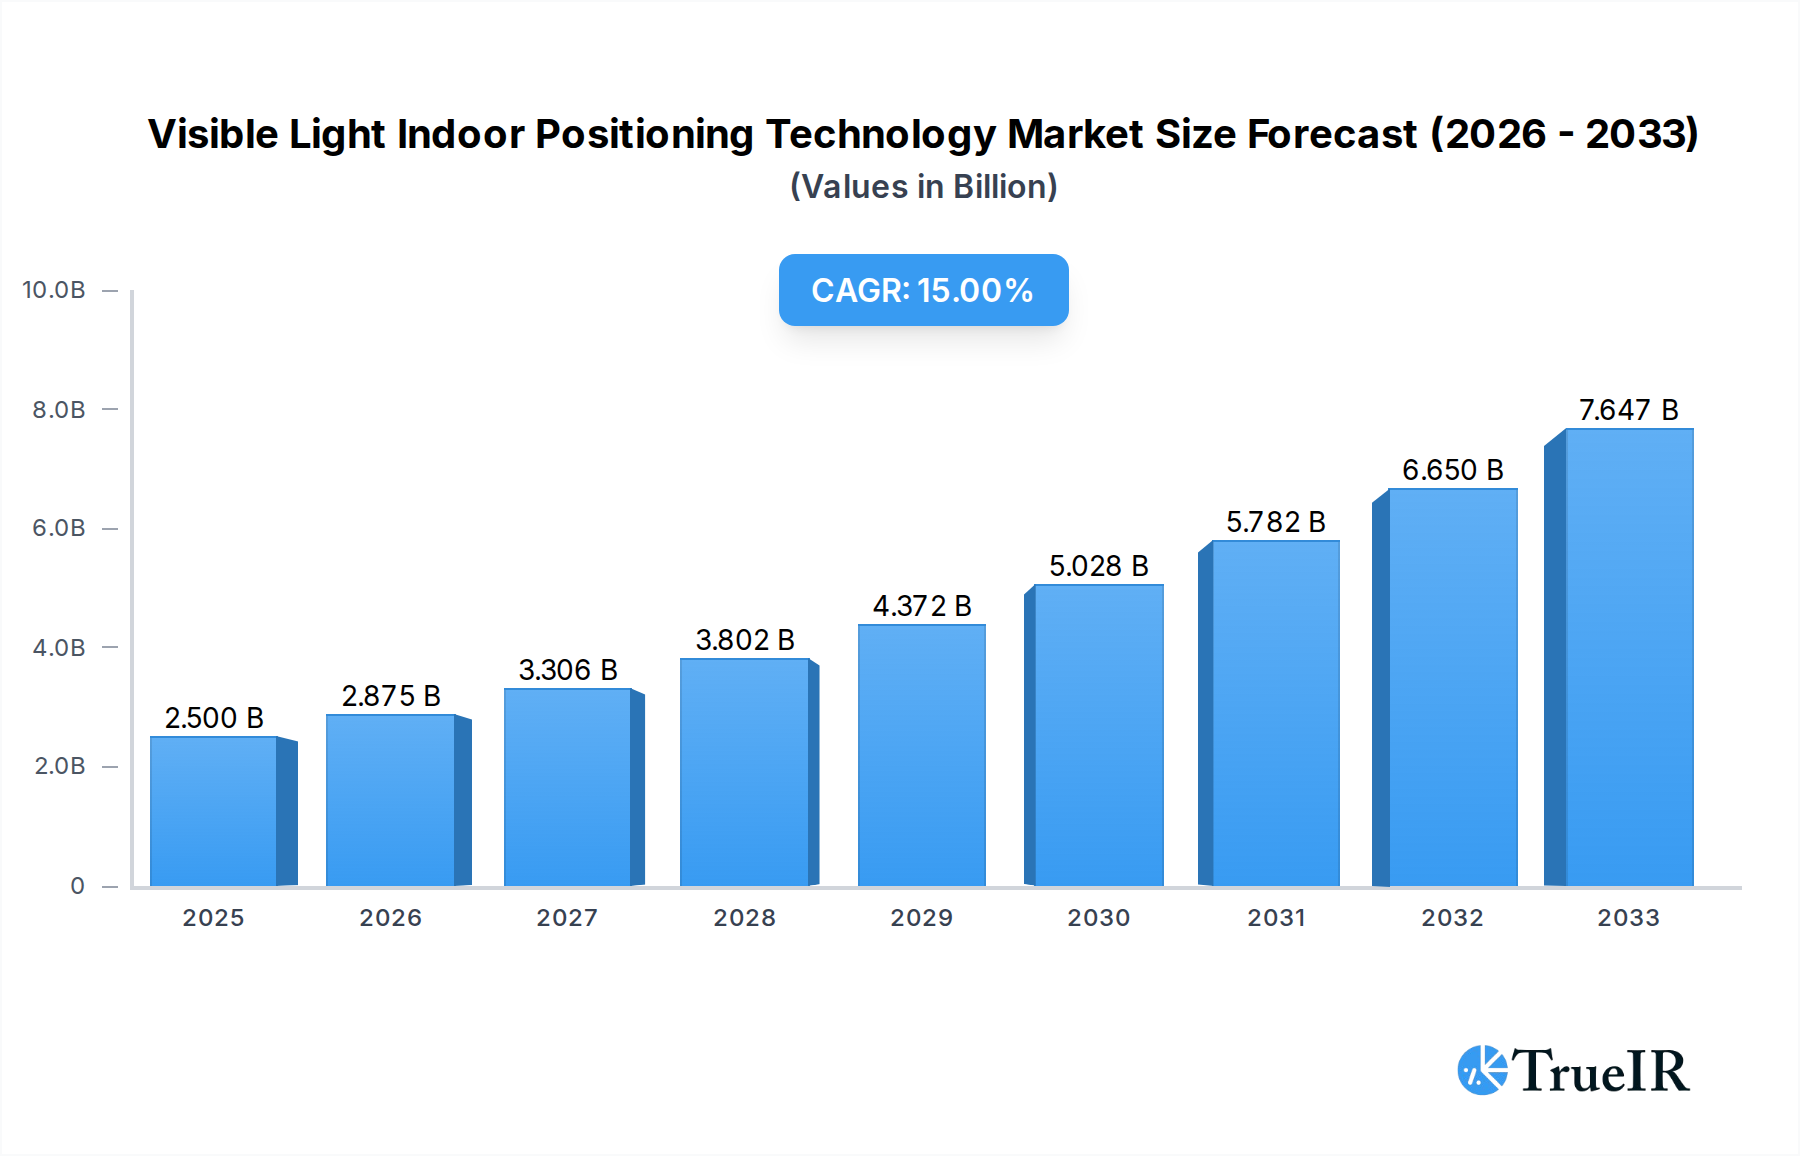
The Visible Light Indoor Positioning Technology market is poised for significant expansion, projected to reach an estimated $2.5 billion in 2025. This robust growth is fueled by a compelling Compound Annual Growth Rate (CAGR) of 15% anticipated over the forecast period of 2025-2033. Key drivers behind this surge include the escalating demand for precise location-based services across various sectors, particularly in military applications where enhanced situational awareness and navigation are paramount. The increasing adoption of smart devices and the development of sophisticated indoor navigation systems are also contributing to market momentum. Furthermore, the continuous evolution of LED lighting infrastructure, coupled with advancements in sensor technology and data processing capabilities, creates a fertile ground for the widespread deployment of visible light positioning solutions.

Visible Light Indoor Positioning Technology Market Size (In Billion)
The market landscape for Visible Light Indoor Positioning Technology is characterized by a dynamic interplay of emerging trends and strategic initiatives from key players. Innovations in integrating imaging and non-imaging positioning techniques are broadening the applicability of these systems, moving beyond simple location tracking to enable richer contextual services. While the inherent benefits of high accuracy and security offer substantial advantages, the market does face certain restraints. These include the initial investment costs associated with infrastructure upgrades, the need for standardization across different platforms, and potential concerns regarding privacy in certain civilian applications. Nevertheless, the inherent advantages of visible light as a secure and precise positioning medium, coupled with ongoing technological advancements, are expected to drive sustained market penetration across diverse applications and geographical regions.
Visible Light Indoor Positioning Technology Company Market Share
Visible Light Indoor Positioning Technology Market Structure & Competitive Landscape
The Visible Light Indoor Positioning Technology market exhibits a dynamic and evolving competitive landscape, characterized by a moderate to high concentration of key players driving innovation. Market analysis reveals a significant emphasis on research and development, fueled by the increasing demand for precise indoor location services across diverse sectors. Innovation drivers include advancements in LED lighting efficiency, sensor technology miniaturization, and sophisticated algorithms for signal processing and trilateration. Regulatory impacts are gradually shaping the market, with an increasing focus on data privacy and security standards, particularly in commercial and civil applications. Product substitutes, such as Wi-Fi-based indoor positioning and Bluetooth Low Energy (BLE) beacons, are present but often fall short in terms of accuracy and latency compared to advanced Visible Light Positioning (VLP) systems. End-user segmentation highlights a growing adoption in retail for enhanced customer experiences, in healthcare for asset tracking and patient navigation, and in industrial settings for operational efficiency. Mergers and acquisitions (M&A) trends are evident as larger technology firms seek to integrate VLP capabilities into their existing product portfolios, aiming to capture a greater share of the burgeoning indoor location market. The concentration ratio in the top five players is estimated to be around 65%, with an anticipated M&A volume of approximately 5 billion in the forecast period. This indicates a trend towards consolidation and strategic partnerships to leverage synergies and expand market reach.
Visible Light Indoor Positioning Technology Market Trends & Opportunities
The global Visible Light Indoor Positioning Technology market is poised for substantial growth, projected to reach a valuation of approximately 300 billion by 2033, expanding at a Compound Annual Growth Rate (CAGR) of roughly 18% from the base year of 2025. This robust expansion is being propelled by a confluence of technological advancements, evolving consumer preferences, and a widening array of industry-specific applications. Technological shifts are central to this growth trajectory. The continuous improvement in LED luminaire technology, enabling higher modulation frequencies and greater data transmission capabilities, is directly enhancing the accuracy and responsiveness of VLP systems. Furthermore, the integration of advanced sensing technologies, including photodiodes and image sensors, is facilitating more precise real-time location tracking and positioning. The miniaturization of these components, coupled with decreasing costs, is making VLP solutions more accessible and deployable across a wider spectrum of indoor environments.
Consumer preferences are increasingly leaning towards personalized and seamless indoor experiences. In retail, for instance, consumers are actively seeking location-aware services that can guide them to specific products, offer personalized promotions based on their proximity to certain displays, and provide efficient store navigation. This demand for enhanced customer engagement is a significant catalyst for VLP adoption. Similarly, in public spaces like airports and shopping malls, the need for intuitive wayfinding and information services is driving the deployment of VLP technology to improve visitor experience.
Competitive dynamics are intensifying as more companies enter the market, offering specialized VLP solutions tailored to specific industry needs. The competitive landscape is characterized by both established technology giants and agile startups vying for market share. Companies are focusing on developing differentiated VLP systems that offer superior accuracy, lower latency, enhanced security, and seamless integration with existing infrastructure. The development of open standards and interoperability protocols is also becoming crucial to foster wider adoption and reduce vendor lock-in.
Market penetration rates are expected to climb significantly, moving from an estimated 15% in 2025 to over 50% by 2033. This penetration will be driven by the declining cost of VLP hardware and software, coupled with the increasing awareness of its benefits among businesses. The market is also witnessing a growing trend towards hybrid positioning systems that combine VLP with other technologies like inertial measurement units (IMUs) and Wi-Fi to achieve even greater accuracy and robustness, especially in challenging indoor environments. The development of sophisticated analytics platforms that leverage VLP data to derive actionable insights into customer behavior, operational efficiency, and asset utilization will further fuel market growth and unlock new revenue streams for VLP solution providers.
Dominant Markets & Segments in Visible Light Indoor Positioning Technology
The Visible Light Indoor Positioning Technology (VLP) market is experiencing significant growth and diversification across various geographical regions and application segments. Among the key segments, Commercial applications are emerging as the dominant force, driven by the pervasive need for enhanced operational efficiency, customer engagement, and asset management in sectors like retail, hospitality, and corporate offices. The estimated market share for Commercial applications is projected to be around 60% of the total market by 2033, with a projected market value of approximately 180 billion.
Within the Commercial segment, retail stands out as a primary growth engine. Retailers are leveraging VLP for in-store navigation, personalized promotions, inventory management, and footfall analytics. The ability of VLP to provide centimeter-level accuracy is crucial for precise product location and targeted marketing campaigns, leading to improved customer experiences and increased sales. For instance, the implementation of VLP in large retail chains is expected to contribute over 70 billion to the VLP market by 2033.
The Military segment, while smaller in terms of market share (estimated at 20%, or 60 billion by 2033), represents a critical area for VLP development and adoption. The need for secure, reliable, and high-precision indoor positioning in defense operations, such as navigation in complex military installations, battlefield awareness, and asset tracking, makes VLP an attractive solution. The strict requirements for accuracy and non-interference in military environments drive significant investment in advanced VLP technologies, often leading to breakthroughs that later find commercial applications.
The Civil segment, encompassing public spaces like airports, hospitals, museums, and transportation hubs, is also a significant contributor, expected to hold approximately 15% of the market share (45 billion by 2033). VLP in civil applications focuses on improving wayfinding for visitors, guiding patients in healthcare facilities, and enhancing the overall visitor experience. The increasing emphasis on smart cities and connected environments further bolsters the demand for VLP in these public infrastructures.
The Others segment, including niche applications in industrial automation, warehousing, and smart homes, is projected to account for the remaining 5% (15 billion by 2033). While smaller, this segment is characterized by rapid innovation and the potential for high growth as VLP technology matures and becomes more integrated into various smart systems.
In terms of Types, Imaging Positioning is anticipated to capture a larger market share, estimated at around 70% (210 billion by 2033), compared to Non-Imaging Positioning (30%, or 90 billion by 2033). Imaging positioning systems, which utilize cameras or image sensors to detect and interpret patterns from LED lights, offer superior accuracy and the potential for richer data extraction. Non-imaging positioning systems, relying on simpler light sensors, are generally more cost-effective and easier to deploy, making them suitable for less demanding applications. However, the trend towards higher precision and more advanced functionalities favors the growth of imaging-based VLP solutions.
Key growth drivers across these segments include the increasing need for hyper-accurate indoor location data, the declining cost of VLP hardware and software, and the development of sophisticated analytical tools that leverage VLP data. Government initiatives promoting smart infrastructure and digitalization also play a crucial role. Furthermore, the development of industry-specific standards and the growing ecosystem of VLP solution providers are paving the way for widespread adoption and market expansion.
Visible Light Indoor Positioning Technology Product Analysis
Visible Light Indoor Positioning Technology (VLP) products are characterized by their innovative integration of LED lighting infrastructure with advanced sensing and processing capabilities. These solutions offer unparalleled indoor location accuracy, often achieving centimeter-level precision, which is a significant advantage over traditional indoor positioning methods. Key product innovations include the development of highly modulated LED lights capable of transmitting unique identifiers and spatial data at high speeds, alongside miniaturized and highly sensitive photodetectors and image sensors that can rapidly decode this information. Competitive advantages stem from VLP's inherent security, its ability to coexist with existing electrical infrastructure, and its potential for ubiquitous deployment in any environment with lighting. Applications range from precise asset tracking in warehouses and hospitals to enhanced customer navigation in retail and robust indoor guidance for military operations.
Key Drivers, Barriers & Challenges in Visible Light Indoor Positioning Technology
The Visible Light Indoor Positioning Technology market is primarily propelled by the surging demand for hyper-accurate indoor location services across diverse sectors. Technological advancements in LED lighting, sensor miniaturization, and data processing algorithms are key drivers, enabling higher precision and lower latency positioning. The increasing adoption of IoT devices and the growing imperative for real-time data analytics further fuel market growth. Furthermore, government initiatives and investments in smart city infrastructure and digitalization are creating a favorable ecosystem for VLP deployment.
However, the market faces several barriers and challenges. The initial cost of deploying VLP infrastructure, including specialized LED luminaires and sensors, can be a restraint for some organizations, despite decreasing costs. Standardization of VLP protocols and interoperability between different vendor solutions remain crucial challenges to widespread adoption. Regulatory hurdles related to data privacy and security, especially in sensitive applications, also require careful navigation. Supply chain disruptions and the availability of skilled personnel for installation and maintenance can also impact market growth. Competitive pressures from established indoor positioning technologies like Wi-Fi and Bluetooth also necessitate continuous innovation and differentiation.
Growth Drivers in the Visible Light Indoor Positioning Technology Market
The growth of the Visible Light Indoor Positioning Technology market is primarily driven by the escalating demand for highly precise and reliable indoor location services. Advancements in LED technology, enabling faster modulation and higher data transmission rates, are directly enhancing the performance of VLP systems. The continuous innovation in sensor technology, leading to smaller, more accurate, and cost-effective photodiodes and image sensors, is a crucial enabler. Furthermore, the widespread adoption of the Internet of Things (IoT) across industries creates a significant need for accurate indoor positioning to manage connected devices and gather real-time data. The increasing investment in smart city initiatives and the development of smart buildings worldwide are also creating a fertile ground for VLP deployment, fostering demand for efficient wayfinding, asset tracking, and operational optimization.
Challenges Impacting Visible Light Indoor Positioning Technology Growth
Despite its promising growth trajectory, the Visible Light Indoor Positioning Technology market faces several challenges. The initial capital investment required for upgrading existing lighting infrastructure to VLP-compatible systems can be a significant barrier for many businesses, especially small and medium-sized enterprises. The lack of universally adopted industry standards for VLP protocols can lead to interoperability issues between different vendor solutions, hindering seamless integration and wider adoption. Stringent data privacy and security regulations, particularly in sectors like healthcare and government, necessitate robust compliance measures and can slow down deployment. Moreover, the competitive landscape is intense, with established indoor positioning technologies like Wi-Fi and Bluetooth offering established ecosystems and lower initial deployment costs, posing a challenge for VLP to gain market share. Ensuring the availability of skilled technicians for installation, calibration, and maintenance of VLP systems is also a growing concern.
Key Players Shaping the Visible Light Indoor Positioning Technology Market
- Beijing OceanEco Technology Co.,Ltd.
- Wh-Fso
- Beijing Shiyuan Dongli Technology Co.,Ltd.
- Hccl Tech
- Gw-Ocean
- Beijing Fengmao Technology Co.,Ltd.
- Lite Share
- Joanneum Research
Significant Visible Light Indoor Positioning Technology Industry Milestones
- 2019: Release of advanced photodiode sensors with enhanced sensitivity and faster response times, improving VLP accuracy.
- 2020: Major advancements in LED modulation techniques enabling higher data transmission rates, facilitating richer location information.
- 2021: Introduction of integrated VLP chipsets, reducing hardware size and cost, making deployment more accessible.
- 2022: Significant research breakthroughs in AI-powered algorithms for robust VLP in challenging indoor environments with occlusions.
- 2023: Key players begin showcasing hybrid VLP systems combining with other positioning technologies for enhanced performance.
- 2024: Growing industry consensus towards standardization of VLP protocols and data formats.
Future Outlook for Visible Light Indoor Positioning Technology Market
The future outlook for the Visible Light Indoor Positioning Technology market is exceptionally promising, driven by continuous technological innovation and expanding application horizons. The market is anticipated to witness significant growth as VLP systems become more integrated into smart buildings, smart retail environments, and industrial IoT ecosystems. Strategic collaborations between lighting manufacturers, sensor providers, and software developers will foster the creation of more comprehensive and user-friendly VLP solutions. The declining cost of hardware and the increasing availability of specialized VLP services are expected to democratize access to high-precision indoor positioning, unlocking new opportunities in areas such as augmented reality navigation, advanced analytics for customer behavior, and highly efficient logistics operations. The market's trajectory indicates a future where seamless and accurate indoor location awareness is a fundamental utility, integrated into the fabric of our daily lives.
Visible Light Indoor Positioning Technology Segmentation
-
1. Application
- 1.1. Military
- 1.2. Commercial
- 1.3. Civil
- 1.4. Others
-
2. Types
- 2.1. Imaging Positioning
- 2.2. Non-Imaging Positioning
Visible Light Indoor Positioning Technology Segmentation By Geography
-
1. North America
- 1.1. United States
- 1.2. Canada
- 1.3. Mexico
-
2. South America
- 2.1. Brazil
- 2.2. Argentina
- 2.3. Rest of South America
-
3. Europe
- 3.1. United Kingdom
- 3.2. Germany
- 3.3. France
- 3.4. Italy
- 3.5. Spain
- 3.6. Russia
- 3.7. Benelux
- 3.8. Nordics
- 3.9. Rest of Europe
-
4. Middle East & Africa
- 4.1. Turkey
- 4.2. Israel
- 4.3. GCC
- 4.4. North Africa
- 4.5. South Africa
- 4.6. Rest of Middle East & Africa
-
5. Asia Pacific
- 5.1. China
- 5.2. India
- 5.3. Japan
- 5.4. South Korea
- 5.5. ASEAN
- 5.6. Oceania
- 5.7. Rest of Asia Pacific
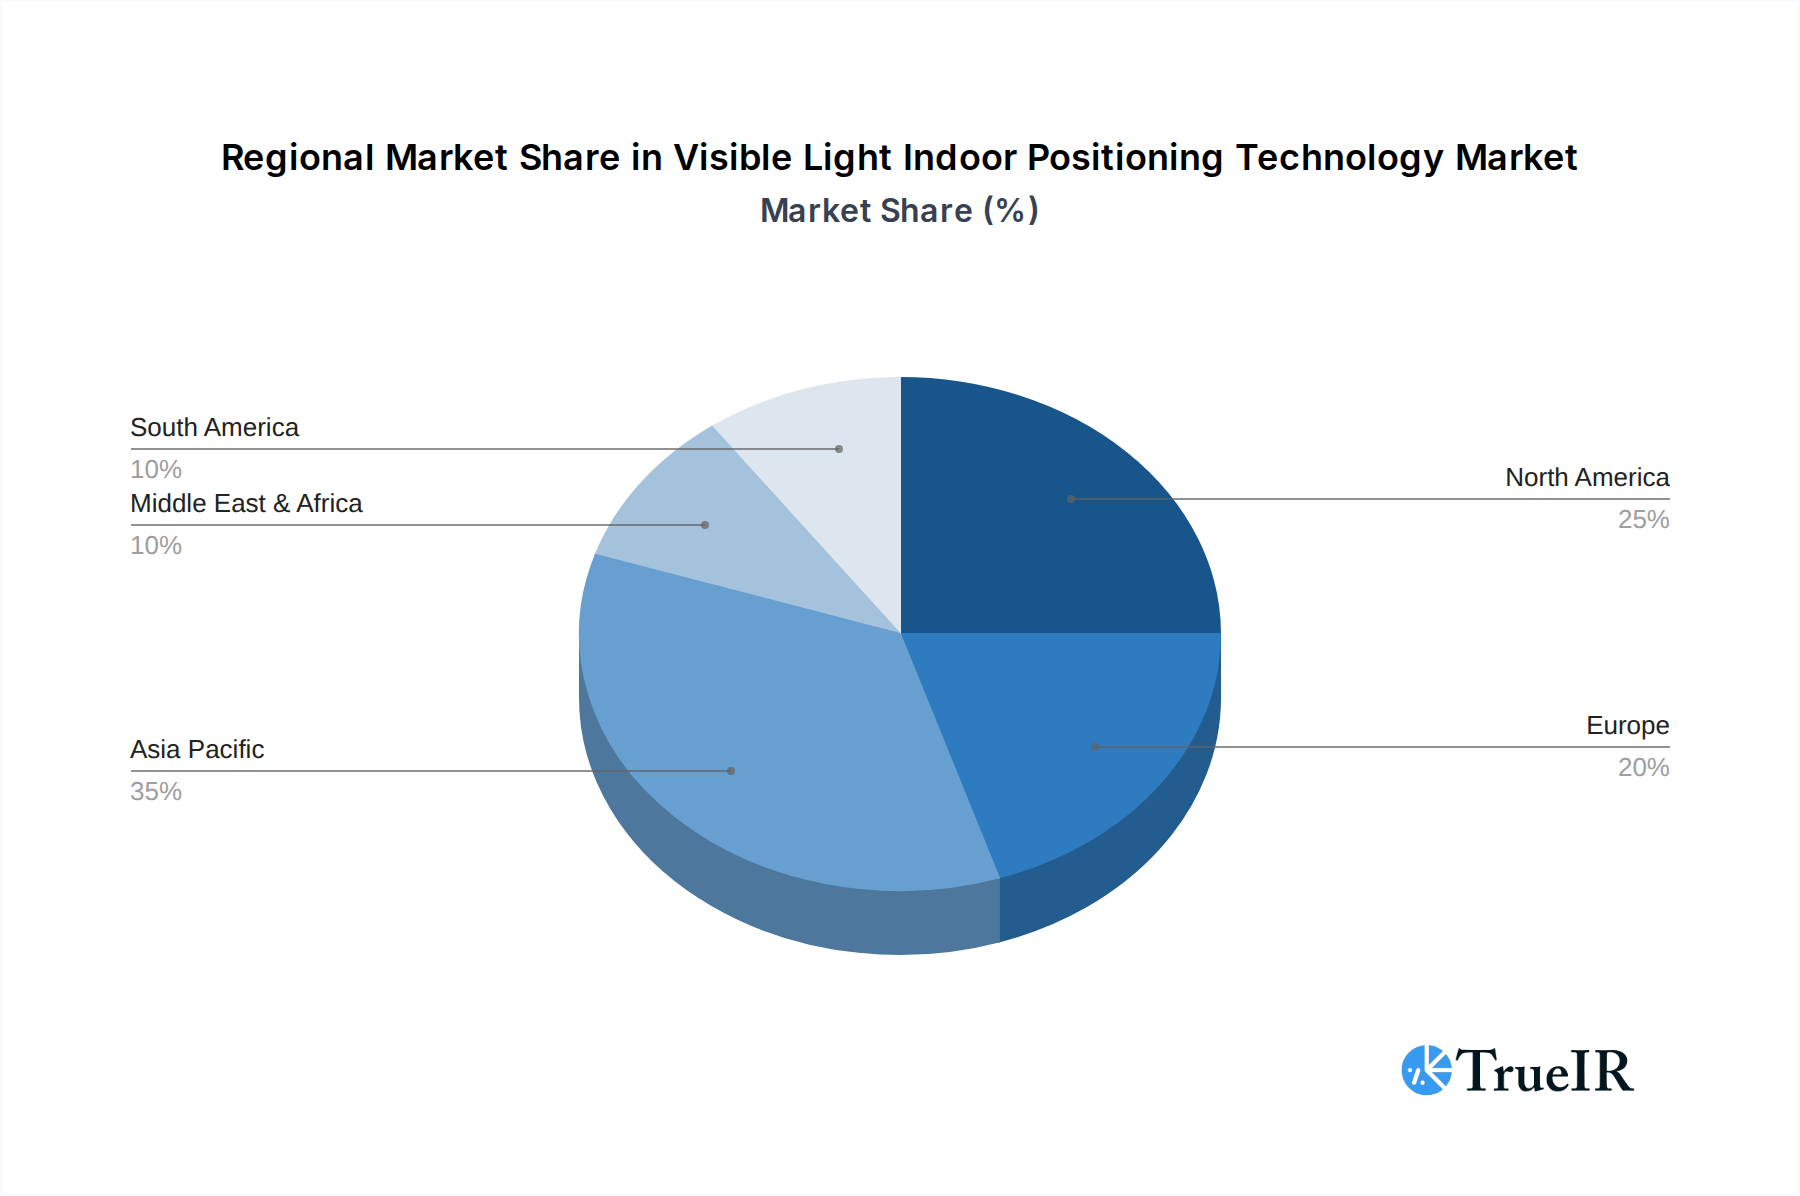
Visible Light Indoor Positioning Technology Regional Market Share
Geographic Coverage of Visible Light Indoor Positioning Technology
Visible Light Indoor Positioning Technology REPORT HIGHLIGHTS
| Aspects | Details |
|---|---|
| Study Period | 2020-2034 |
| Base Year | 2025 |
| Estimated Year | 2026 |
| Forecast Period | 2026-2034 |
| Historical Period | 2020-2025 |
| Growth Rate | CAGR of 15% from 2020-2034 |
| Segmentation |
|
Table of Contents
- 1. Introduction
- 1.1. Research Scope
- 1.2. Market Segmentation
- 1.3. Research Methodology
- 1.4. Definitions and Assumptions
- 2. Executive Summary
- 2.1. Introduction
- 3. Market Dynamics
- 3.1. Introduction
- 3.2. Market Drivers
- 3.3. Market Restrains
- 3.4. Market Trends
- 4. Market Factor Analysis
- 4.1. Porters Five Forces
- 4.2. Supply/Value Chain
- 4.3. PESTEL analysis
- 4.4. Market Entropy
- 4.5. Patent/Trademark Analysis
- 5. Global Visible Light Indoor Positioning Technology Analysis, Insights and Forecast, 2020-2032
- 5.1. Market Analysis, Insights and Forecast - by Application
- 5.1.1. Military
- 5.1.2. Commercial
- 5.1.3. Civil
- 5.1.4. Others
- 5.2. Market Analysis, Insights and Forecast - by Types
- 5.2.1. Imaging Positioning
- 5.2.2. Non-Imaging Positioning
- 5.3. Market Analysis, Insights and Forecast - by Region
- 5.3.1. North America
- 5.3.2. South America
- 5.3.3. Europe
- 5.3.4. Middle East & Africa
- 5.3.5. Asia Pacific
- 5.1. Market Analysis, Insights and Forecast - by Application
- 6. North America Visible Light Indoor Positioning Technology Analysis, Insights and Forecast, 2020-2032
- 6.1. Market Analysis, Insights and Forecast - by Application
- 6.1.1. Military
- 6.1.2. Commercial
- 6.1.3. Civil
- 6.1.4. Others
- 6.2. Market Analysis, Insights and Forecast - by Types
- 6.2.1. Imaging Positioning
- 6.2.2. Non-Imaging Positioning
- 6.1. Market Analysis, Insights and Forecast - by Application
- 7. South America Visible Light Indoor Positioning Technology Analysis, Insights and Forecast, 2020-2032
- 7.1. Market Analysis, Insights and Forecast - by Application
- 7.1.1. Military
- 7.1.2. Commercial
- 7.1.3. Civil
- 7.1.4. Others
- 7.2. Market Analysis, Insights and Forecast - by Types
- 7.2.1. Imaging Positioning
- 7.2.2. Non-Imaging Positioning
- 7.1. Market Analysis, Insights and Forecast - by Application
- 8. Europe Visible Light Indoor Positioning Technology Analysis, Insights and Forecast, 2020-2032
- 8.1. Market Analysis, Insights and Forecast - by Application
- 8.1.1. Military
- 8.1.2. Commercial
- 8.1.3. Civil
- 8.1.4. Others
- 8.2. Market Analysis, Insights and Forecast - by Types
- 8.2.1. Imaging Positioning
- 8.2.2. Non-Imaging Positioning
- 8.1. Market Analysis, Insights and Forecast - by Application
- 9. Middle East & Africa Visible Light Indoor Positioning Technology Analysis, Insights and Forecast, 2020-2032
- 9.1. Market Analysis, Insights and Forecast - by Application
- 9.1.1. Military
- 9.1.2. Commercial
- 9.1.3. Civil
- 9.1.4. Others
- 9.2. Market Analysis, Insights and Forecast - by Types
- 9.2.1. Imaging Positioning
- 9.2.2. Non-Imaging Positioning
- 9.1. Market Analysis, Insights and Forecast - by Application
- 10. Asia Pacific Visible Light Indoor Positioning Technology Analysis, Insights and Forecast, 2020-2032
- 10.1. Market Analysis, Insights and Forecast - by Application
- 10.1.1. Military
- 10.1.2. Commercial
- 10.1.3. Civil
- 10.1.4. Others
- 10.2. Market Analysis, Insights and Forecast - by Types
- 10.2.1. Imaging Positioning
- 10.2.2. Non-Imaging Positioning
- 10.1. Market Analysis, Insights and Forecast - by Application
- 11. Competitive Analysis
- 11.1. Global Market Share Analysis 2025
- 11.2. Company Profiles
- 11.2.1 Beijing OceanEco Technology Co.
- 11.2.1.1. Overview
- 11.2.1.2. Products
- 11.2.1.3. SWOT Analysis
- 11.2.1.4. Recent Developments
- 11.2.1.5. Financials (Based on Availability)
- 11.2.2 Ltd.
- 11.2.2.1. Overview
- 11.2.2.2. Products
- 11.2.2.3. SWOT Analysis
- 11.2.2.4. Recent Developments
- 11.2.2.5. Financials (Based on Availability)
- 11.2.3 Wh-Fso
- 11.2.3.1. Overview
- 11.2.3.2. Products
- 11.2.3.3. SWOT Analysis
- 11.2.3.4. Recent Developments
- 11.2.3.5. Financials (Based on Availability)
- 11.2.4 Beijing Shiyuan DongliTechnology Co.
- 11.2.4.1. Overview
- 11.2.4.2. Products
- 11.2.4.3. SWOT Analysis
- 11.2.4.4. Recent Developments
- 11.2.4.5. Financials (Based on Availability)
- 11.2.5 Ltd.
- 11.2.5.1. Overview
- 11.2.5.2. Products
- 11.2.5.3. SWOT Analysis
- 11.2.5.4. Recent Developments
- 11.2.5.5. Financials (Based on Availability)
- 11.2.6 Hccl Tech
- 11.2.6.1. Overview
- 11.2.6.2. Products
- 11.2.6.3. SWOT Analysis
- 11.2.6.4. Recent Developments
- 11.2.6.5. Financials (Based on Availability)
- 11.2.7 Gw-Ocean
- 11.2.7.1. Overview
- 11.2.7.2. Products
- 11.2.7.3. SWOT Analysis
- 11.2.7.4. Recent Developments
- 11.2.7.5. Financials (Based on Availability)
- 11.2.8 Beijing Fengmao Technology Co.
- 11.2.8.1. Overview
- 11.2.8.2. Products
- 11.2.8.3. SWOT Analysis
- 11.2.8.4. Recent Developments
- 11.2.8.5. Financials (Based on Availability)
- 11.2.9 Ltd.
- 11.2.9.1. Overview
- 11.2.9.2. Products
- 11.2.9.3. SWOT Analysis
- 11.2.9.4. Recent Developments
- 11.2.9.5. Financials (Based on Availability)
- 11.2.10 Lite Share
- 11.2.10.1. Overview
- 11.2.10.2. Products
- 11.2.10.3. SWOT Analysis
- 11.2.10.4. Recent Developments
- 11.2.10.5. Financials (Based on Availability)
- 11.2.11 Joanneum Research
- 11.2.11.1. Overview
- 11.2.11.2. Products
- 11.2.11.3. SWOT Analysis
- 11.2.11.4. Recent Developments
- 11.2.11.5. Financials (Based on Availability)
- 11.2.1 Beijing OceanEco Technology Co.
List of Figures
- Figure 1: Global Visible Light Indoor Positioning Technology Revenue Breakdown (undefined, %) by Region 2025 & 2033
- Figure 2: North America Visible Light Indoor Positioning Technology Revenue (undefined), by Application 2025 & 2033
- Figure 3: North America Visible Light Indoor Positioning Technology Revenue Share (%), by Application 2025 & 2033
- Figure 4: North America Visible Light Indoor Positioning Technology Revenue (undefined), by Types 2025 & 2033
- Figure 5: North America Visible Light Indoor Positioning Technology Revenue Share (%), by Types 2025 & 2033
- Figure 6: North America Visible Light Indoor Positioning Technology Revenue (undefined), by Country 2025 & 2033
- Figure 7: North America Visible Light Indoor Positioning Technology Revenue Share (%), by Country 2025 & 2033
- Figure 8: South America Visible Light Indoor Positioning Technology Revenue (undefined), by Application 2025 & 2033
- Figure 9: South America Visible Light Indoor Positioning Technology Revenue Share (%), by Application 2025 & 2033
- Figure 10: South America Visible Light Indoor Positioning Technology Revenue (undefined), by Types 2025 & 2033
- Figure 11: South America Visible Light Indoor Positioning Technology Revenue Share (%), by Types 2025 & 2033
- Figure 12: South America Visible Light Indoor Positioning Technology Revenue (undefined), by Country 2025 & 2033
- Figure 13: South America Visible Light Indoor Positioning Technology Revenue Share (%), by Country 2025 & 2033
- Figure 14: Europe Visible Light Indoor Positioning Technology Revenue (undefined), by Application 2025 & 2033
- Figure 15: Europe Visible Light Indoor Positioning Technology Revenue Share (%), by Application 2025 & 2033
- Figure 16: Europe Visible Light Indoor Positioning Technology Revenue (undefined), by Types 2025 & 2033
- Figure 17: Europe Visible Light Indoor Positioning Technology Revenue Share (%), by Types 2025 & 2033
- Figure 18: Europe Visible Light Indoor Positioning Technology Revenue (undefined), by Country 2025 & 2033
- Figure 19: Europe Visible Light Indoor Positioning Technology Revenue Share (%), by Country 2025 & 2033
- Figure 20: Middle East & Africa Visible Light Indoor Positioning Technology Revenue (undefined), by Application 2025 & 2033
- Figure 21: Middle East & Africa Visible Light Indoor Positioning Technology Revenue Share (%), by Application 2025 & 2033
- Figure 22: Middle East & Africa Visible Light Indoor Positioning Technology Revenue (undefined), by Types 2025 & 2033
- Figure 23: Middle East & Africa Visible Light Indoor Positioning Technology Revenue Share (%), by Types 2025 & 2033
- Figure 24: Middle East & Africa Visible Light Indoor Positioning Technology Revenue (undefined), by Country 2025 & 2033
- Figure 25: Middle East & Africa Visible Light Indoor Positioning Technology Revenue Share (%), by Country 2025 & 2033
- Figure 26: Asia Pacific Visible Light Indoor Positioning Technology Revenue (undefined), by Application 2025 & 2033
- Figure 27: Asia Pacific Visible Light Indoor Positioning Technology Revenue Share (%), by Application 2025 & 2033
- Figure 28: Asia Pacific Visible Light Indoor Positioning Technology Revenue (undefined), by Types 2025 & 2033
- Figure 29: Asia Pacific Visible Light Indoor Positioning Technology Revenue Share (%), by Types 2025 & 2033
- Figure 30: Asia Pacific Visible Light Indoor Positioning Technology Revenue (undefined), by Country 2025 & 2033
- Figure 31: Asia Pacific Visible Light Indoor Positioning Technology Revenue Share (%), by Country 2025 & 2033
List of Tables
- Table 1: Global Visible Light Indoor Positioning Technology Revenue undefined Forecast, by Application 2020 & 2033
- Table 2: Global Visible Light Indoor Positioning Technology Revenue undefined Forecast, by Types 2020 & 2033
- Table 3: Global Visible Light Indoor Positioning Technology Revenue undefined Forecast, by Region 2020 & 2033
- Table 4: Global Visible Light Indoor Positioning Technology Revenue undefined Forecast, by Application 2020 & 2033
- Table 5: Global Visible Light Indoor Positioning Technology Revenue undefined Forecast, by Types 2020 & 2033
- Table 6: Global Visible Light Indoor Positioning Technology Revenue undefined Forecast, by Country 2020 & 2033
- Table 7: United States Visible Light Indoor Positioning Technology Revenue (undefined) Forecast, by Application 2020 & 2033
- Table 8: Canada Visible Light Indoor Positioning Technology Revenue (undefined) Forecast, by Application 2020 & 2033
- Table 9: Mexico Visible Light Indoor Positioning Technology Revenue (undefined) Forecast, by Application 2020 & 2033
- Table 10: Global Visible Light Indoor Positioning Technology Revenue undefined Forecast, by Application 2020 & 2033
- Table 11: Global Visible Light Indoor Positioning Technology Revenue undefined Forecast, by Types 2020 & 2033
- Table 12: Global Visible Light Indoor Positioning Technology Revenue undefined Forecast, by Country 2020 & 2033
- Table 13: Brazil Visible Light Indoor Positioning Technology Revenue (undefined) Forecast, by Application 2020 & 2033
- Table 14: Argentina Visible Light Indoor Positioning Technology Revenue (undefined) Forecast, by Application 2020 & 2033
- Table 15: Rest of South America Visible Light Indoor Positioning Technology Revenue (undefined) Forecast, by Application 2020 & 2033
- Table 16: Global Visible Light Indoor Positioning Technology Revenue undefined Forecast, by Application 2020 & 2033
- Table 17: Global Visible Light Indoor Positioning Technology Revenue undefined Forecast, by Types 2020 & 2033
- Table 18: Global Visible Light Indoor Positioning Technology Revenue undefined Forecast, by Country 2020 & 2033
- Table 19: United Kingdom Visible Light Indoor Positioning Technology Revenue (undefined) Forecast, by Application 2020 & 2033
- Table 20: Germany Visible Light Indoor Positioning Technology Revenue (undefined) Forecast, by Application 2020 & 2033
- Table 21: France Visible Light Indoor Positioning Technology Revenue (undefined) Forecast, by Application 2020 & 2033
- Table 22: Italy Visible Light Indoor Positioning Technology Revenue (undefined) Forecast, by Application 2020 & 2033
- Table 23: Spain Visible Light Indoor Positioning Technology Revenue (undefined) Forecast, by Application 2020 & 2033
- Table 24: Russia Visible Light Indoor Positioning Technology Revenue (undefined) Forecast, by Application 2020 & 2033
- Table 25: Benelux Visible Light Indoor Positioning Technology Revenue (undefined) Forecast, by Application 2020 & 2033
- Table 26: Nordics Visible Light Indoor Positioning Technology Revenue (undefined) Forecast, by Application 2020 & 2033
- Table 27: Rest of Europe Visible Light Indoor Positioning Technology Revenue (undefined) Forecast, by Application 2020 & 2033
- Table 28: Global Visible Light Indoor Positioning Technology Revenue undefined Forecast, by Application 2020 & 2033
- Table 29: Global Visible Light Indoor Positioning Technology Revenue undefined Forecast, by Types 2020 & 2033
- Table 30: Global Visible Light Indoor Positioning Technology Revenue undefined Forecast, by Country 2020 & 2033
- Table 31: Turkey Visible Light Indoor Positioning Technology Revenue (undefined) Forecast, by Application 2020 & 2033
- Table 32: Israel Visible Light Indoor Positioning Technology Revenue (undefined) Forecast, by Application 2020 & 2033
- Table 33: GCC Visible Light Indoor Positioning Technology Revenue (undefined) Forecast, by Application 2020 & 2033
- Table 34: North Africa Visible Light Indoor Positioning Technology Revenue (undefined) Forecast, by Application 2020 & 2033
- Table 35: South Africa Visible Light Indoor Positioning Technology Revenue (undefined) Forecast, by Application 2020 & 2033
- Table 36: Rest of Middle East & Africa Visible Light Indoor Positioning Technology Revenue (undefined) Forecast, by Application 2020 & 2033
- Table 37: Global Visible Light Indoor Positioning Technology Revenue undefined Forecast, by Application 2020 & 2033
- Table 38: Global Visible Light Indoor Positioning Technology Revenue undefined Forecast, by Types 2020 & 2033
- Table 39: Global Visible Light Indoor Positioning Technology Revenue undefined Forecast, by Country 2020 & 2033
- Table 40: China Visible Light Indoor Positioning Technology Revenue (undefined) Forecast, by Application 2020 & 2033
- Table 41: India Visible Light Indoor Positioning Technology Revenue (undefined) Forecast, by Application 2020 & 2033
- Table 42: Japan Visible Light Indoor Positioning Technology Revenue (undefined) Forecast, by Application 2020 & 2033
- Table 43: South Korea Visible Light Indoor Positioning Technology Revenue (undefined) Forecast, by Application 2020 & 2033
- Table 44: ASEAN Visible Light Indoor Positioning Technology Revenue (undefined) Forecast, by Application 2020 & 2033
- Table 45: Oceania Visible Light Indoor Positioning Technology Revenue (undefined) Forecast, by Application 2020 & 2033
- Table 46: Rest of Asia Pacific Visible Light Indoor Positioning Technology Revenue (undefined) Forecast, by Application 2020 & 2033
Frequently Asked Questions
1. What is the projected Compound Annual Growth Rate (CAGR) of the Visible Light Indoor Positioning Technology?
The projected CAGR is approximately 15%.
2. Which companies are prominent players in the Visible Light Indoor Positioning Technology?
Key companies in the market include Beijing OceanEco Technology Co., Ltd., Wh-Fso, Beijing Shiyuan DongliTechnology Co., Ltd., Hccl Tech, Gw-Ocean, Beijing Fengmao Technology Co., Ltd., Lite Share, Joanneum Research.
3. What are the main segments of the Visible Light Indoor Positioning Technology?
The market segments include Application, Types.
4. Can you provide details about the market size?
The market size is estimated to be USD XXX N/A as of 2022.
5. What are some drivers contributing to market growth?
N/A
6. What are the notable trends driving market growth?
N/A
7. Are there any restraints impacting market growth?
N/A
8. Can you provide examples of recent developments in the market?
N/A
9. What pricing options are available for accessing the report?
Pricing options include single-user, multi-user, and enterprise licenses priced at USD 2900.00, USD 4350.00, and USD 5800.00 respectively.
10. Is the market size provided in terms of value or volume?
The market size is provided in terms of value, measured in N/A.
11. Are there any specific market keywords associated with the report?
Yes, the market keyword associated with the report is "Visible Light Indoor Positioning Technology," which aids in identifying and referencing the specific market segment covered.
12. How do I determine which pricing option suits my needs best?
The pricing options vary based on user requirements and access needs. Individual users may opt for single-user licenses, while businesses requiring broader access may choose multi-user or enterprise licenses for cost-effective access to the report.
13. Are there any additional resources or data provided in the Visible Light Indoor Positioning Technology report?
While the report offers comprehensive insights, it's advisable to review the specific contents or supplementary materials provided to ascertain if additional resources or data are available.
14. How can I stay updated on further developments or reports in the Visible Light Indoor Positioning Technology?
To stay informed about further developments, trends, and reports in the Visible Light Indoor Positioning Technology, consider subscribing to industry newsletters, following relevant companies and organizations, or regularly checking reputable industry news sources and publications.
Methodology
Step 1 - Identification of Relevant Samples Size from Population Database


Step 2 - Approaches for Defining Global Market Size (Value, Volume* & Price*)

Note*: In applicable scenarios
Step 3 - Data Sources
Primary Research
- Web Analytics
- Survey Reports
- Research Institute
- Latest Research Reports
- Opinion Leaders
Secondary Research
- Annual Reports
- White Paper
- Latest Press Release
- Industry Association
- Paid Database
- Investor Presentations

Step 4 - Data Triangulation
Involves using different sources of information in order to increase the validity of a study
These sources are likely to be stakeholders in a program - participants, other researchers, program staff, other community members, and so on.
Then we put all data in single framework & apply various statistical tools to find out the dynamic on the market.
During the analysis stage, feedback from the stakeholder groups would be compared to determine areas of agreement as well as areas of divergence