

Key Insights
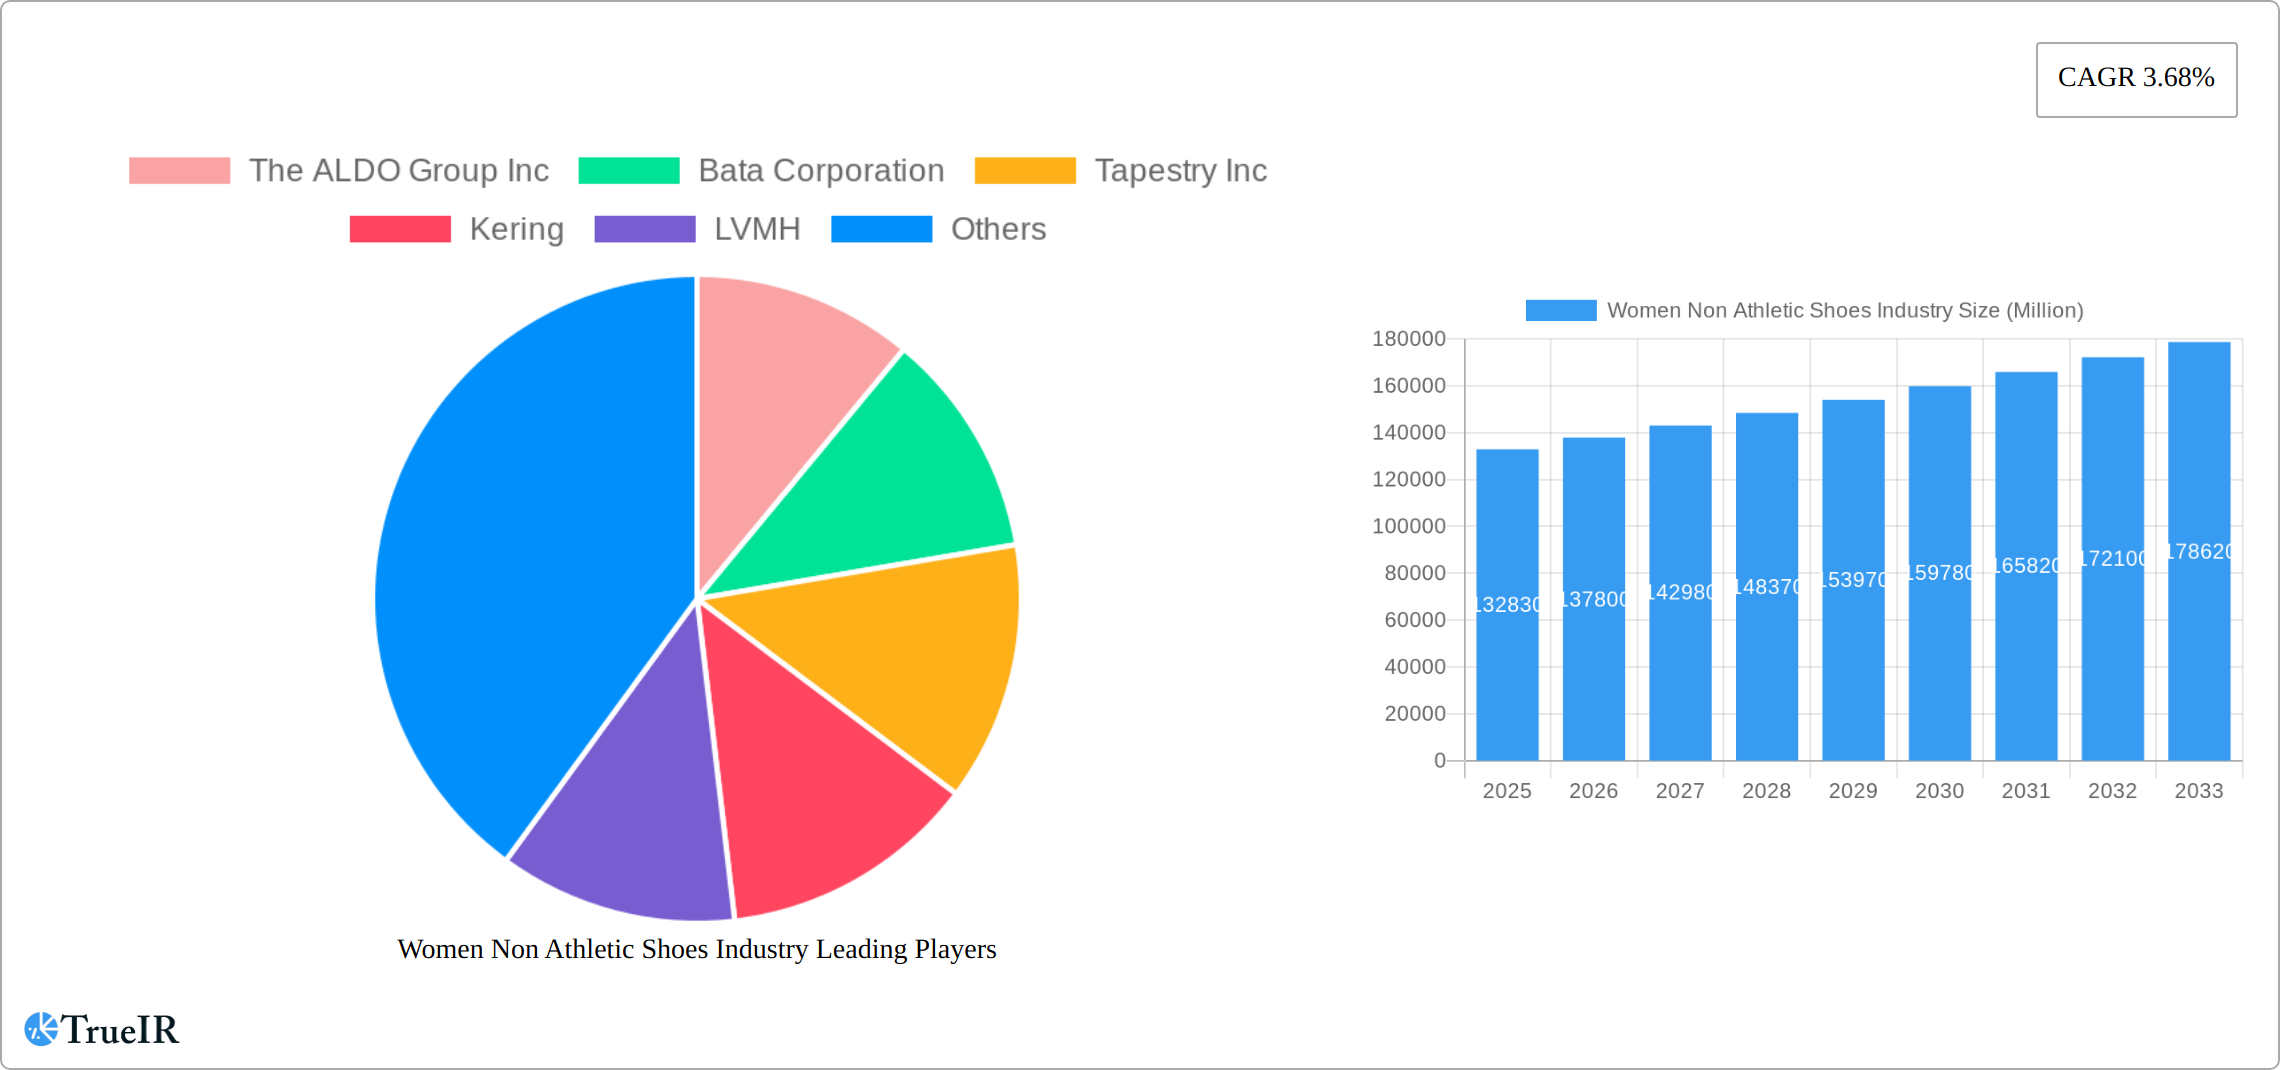
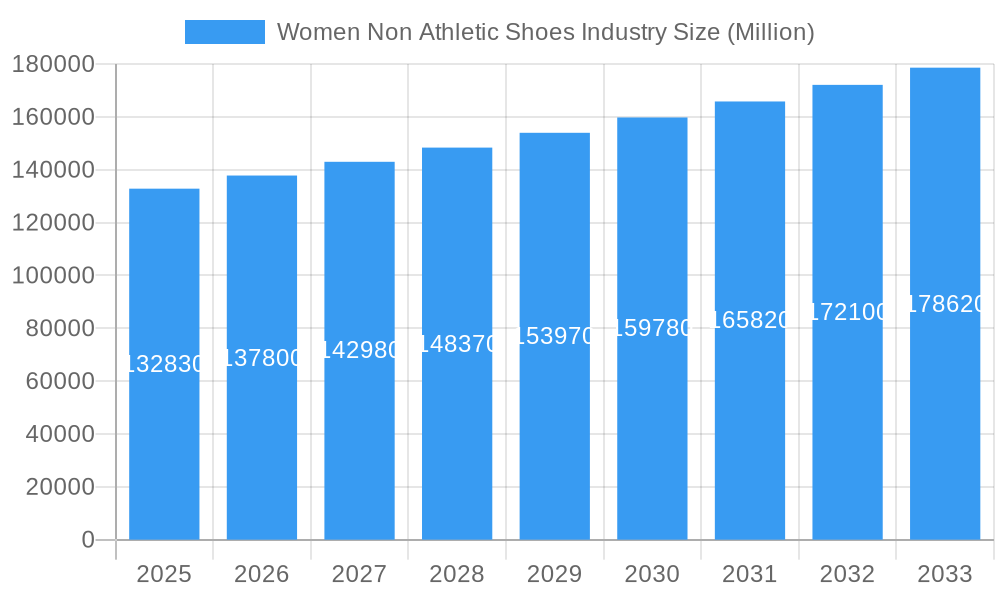
The women's non-athletic footwear market, valued at $132.83 billion in 2025, is projected to experience steady growth, driven by several key factors. The 3.68% CAGR indicates a consistent expansion throughout the forecast period (2025-2033). Premium segment growth is likely outpacing the mass market due to increasing disposable incomes and a rising preference for high-quality, designer footwear. The online distribution channel continues to gain traction, fueled by e-commerce's convenience and expanding reach, although offline retail remains a significant sales avenue. Consumer preferences are shifting towards diverse styles; while boots and shoes, heels and pumps, and flats remain dominant, the "Other Footwear Types" segment— encompassing trendy styles like loafers, mules, and espadrilles—shows strong potential for future growth. Competitive pressures are intense, with established global players like ALDO, Bata, Tapestry, and luxury brands such as LVMH and Prada vying for market share alongside emerging brands. Geographic distribution reflects established markets in North America and Europe, but the Asia-Pacific region, particularly China and India, presents significant growth opportunities due to rising middle classes and changing fashion trends. The market is also influenced by evolving fashion trends, seasonal demands, and material innovations focusing on comfort and sustainability.
Women Non Athletic Shoes Industry Market Size (In Billion)
The market's future hinges on effectively catering to evolving consumer preferences. Brands must strategically invest in online presence and omnichannel strategies to reach diverse customer segments. Focus on sustainability and ethical sourcing will increasingly influence purchasing decisions, and offering diverse styles and sizes to cater to a broader range of consumers will be crucial. Understanding regional variations in fashion trends and tailoring product offerings accordingly will be essential for maximizing growth across geographical markets. The premium segment’s growth will necessitate innovative designs and marketing strategies to justify higher price points, while the mass market will rely on affordability and accessible styles to maintain competitiveness. The continued expansion of e-commerce will reshape the competitive landscape, necessitating adaptable logistics and supply chains to fulfill online orders efficiently.
Women Non Athletic Shoes Industry Company Market Share
Women's Non-Athletic Shoes Industry Market Report: 2019-2033
This comprehensive report provides a detailed analysis of the global women's non-athletic footwear market, covering market size, trends, competitive landscape, and future outlook from 2019 to 2033. The report leverages extensive market research and data analysis to provide actionable insights for industry stakeholders, including manufacturers, retailers, and investors. The study period covers 2019-2033, with 2025 as the base and estimated year. The forecast period is 2025-2033, and the historical period is 2019-2024.
Women's Non-Athletic Shoes Industry Market Structure & Competitive Landscape
The global women's non-athletic shoe market is characterized by a moderately concentrated landscape with a few major players holding significant market share. The industry is witnessing increasing innovation, driven by evolving consumer preferences and technological advancements in materials and manufacturing processes. Regulatory impacts, particularly those related to labor practices and environmental sustainability, are becoming increasingly significant. Product substitutes, such as athletic shoes worn in casual settings, pose a competitive challenge. The market is segmented by end-user (various demographics and styles), with premium and mass segments showing significant distinctions in pricing, branding, and consumer behavior. Mergers and acquisitions (M&A) activity is relatively high, with strategic partnerships and acquisitions aimed at strengthening supply chains and expanding market reach.
- Market Concentration: The four-firm concentration ratio is estimated at xx%, indicating a moderately concentrated market.
- Innovation Drivers: Technological advancements in materials (e.g., sustainable alternatives, improved comfort technologies), design innovation (e.g., unique styles and collaborations), and manufacturing processes (e.g., 3D printing).
- Regulatory Impacts: Growing focus on ethical sourcing, labor standards, and environmental regulations influences manufacturing practices and supply chain management.
- Product Substitutes: Increasing popularity of athletic shoes for casual wear poses a significant competitive pressure.
- End-User Segmentation: The market is segmented by age, style preference, income level, and lifestyle.
- M&A Trends: Significant M&A activity observed in recent years, with an estimated xx Million USD worth of deals recorded between 2019-2024. These transactions focused on securing supply chains, accessing new markets, and expanding product portfolios.
Women's Non-Athletic Shoes Industry Market Trends & Opportunities
The global women's non-athletic footwear market exhibits substantial growth potential, driven by several key factors. The market size is projected to reach xx Million USD by 2033, with a Compound Annual Growth Rate (CAGR) of xx% during the forecast period (2025-2033). Technological shifts, such as the increased use of sustainable materials and advanced manufacturing techniques, are reshaping the industry landscape. Consumer preferences are evolving towards more comfortable, stylish, and ethically sourced footwear. The rise of online retail is transforming distribution channels, leading to increased market penetration rates. Competitive dynamics are intense, with established players and new entrants vying for market share through innovation, branding, and strategic partnerships. The market penetration rate is projected to increase from xx% in 2025 to xx% by 2033.
Dominant Markets & Segments in Women's Non-Athletic Shoes Industry
The North American market currently holds the leading position in the women's non-athletic shoe industry, driven by high consumer spending and strong brand presence. Within market segments:
- By Type: Heels and Pumps consistently hold the largest segment share, followed by Boots and Shoes and Flats, driven by fashion trends and diverse occasions.
- By Distribution Channel: Offline retail remains dominant, accounting for approximately xx Million USD in 2025, but the online channel is experiencing rapid growth.
- By Category: The Premium segment exhibits higher growth potential, due to rising disposable incomes and increasing demand for luxury goods.
Key Growth Drivers:
- Strong consumer spending: Increased disposable incomes in key markets fuel demand for diverse styles and higher quality footwear.
- Fashion trends: Changing fashion trends directly impact demand for specific styles, leading to innovation and product diversification.
- E-commerce growth: Online retail provides ease of access and expands the reach of brands.
- Infrastructure development: Improved logistics and distribution networks facilitate efficient supply chains.
Women's Non-Athletic Shoes Industry Product Analysis
Product innovation focuses on enhancing comfort, durability, and style. Technological advancements include the use of lightweight and sustainable materials, improved cushioning technologies, and ergonomic designs. These innovations cater to the diverse needs and preferences of consumers, offering competitive advantages in terms of product differentiation and appeal. The market sees a strong push towards sustainable and ethically produced footwear.
Key Drivers, Barriers & Challenges in Women's Non-Athletic Shoes Industry
Key Drivers:
- Rising disposable incomes in emerging markets: Increased purchasing power expands market access and creates opportunities for growth.
- Technological advancements: Innovation in materials, manufacturing processes, and design improves product quality and offers enhanced customer value.
- Growing online retail: E-commerce platforms provide expanded market reach and convenience to consumers.
Challenges:
- Supply chain disruptions: Geopolitical instability, natural disasters, and pandemics can impact material sourcing and manufacturing processes, increasing costs and causing delays. This can account for a xx% reduction in overall production capacity in certain periods.
- Intense competition: A large number of established and emerging brands compete fiercely for market share.
- Fluctuating raw material prices: The cost of leather, rubber, and other raw materials can significantly impact manufacturing costs and profitability.
Growth Drivers in the Women's Non-Athletic Shoes Industry Market
Technological advancements, particularly in material science and manufacturing processes (e.g., 3D printing, sustainable materials), remain a primary growth driver. Expanding e-commerce platforms enhance market access, while shifting consumer preferences towards stylish and comfortable footwear continue to fuel demand.
Challenges Impacting Women's Non-Athletic Shoes Industry Growth
Supply chain vulnerabilities, fluctuating raw material prices, and intense competition remain significant hurdles to growth. Furthermore, stringent environmental regulations and ethical sourcing requirements increase manufacturing costs and operational complexity.
Key Players Shaping the Women's Non-Athletic Shoes Industry Market
- The ALDO Group Inc
- Bata Corporation
- Tapestry Inc
- Kering
- LVMH
- Capri Holdings
- Prada SpA
- LIR SRL
- CHANEL
- VF Corporation
- List Not Exhaustive
Significant Women's Non-Athletic Shoes Industry Milestones
- June 2021: Louis Vuitton launched the LV Squad sneaker and LV Sunset mule footwear campaign featuring Emma Chamberlain and Charli D'Amelio, significantly boosting brand visibility and sales.
- June 2021: Prada SPA and Ermenegildo Zegna acquired a major stake in Filati Biagioli Modesto SPA, securing control over a crucial element of the supply chain and enhancing vertical integration.
- October 2020: CHANEL acquired a majority stake in Italian Shoemaker Ballin, strengthening its supply chain and securing access to high-quality craftsmanship.
Future Outlook for Women's Non-Athletic Shoes Industry Market
The future of the women's non-athletic footwear market appears bright, with continued growth driven by evolving consumer preferences, technological innovations, and the expansion of e-commerce. Strategic partnerships, product diversification, and a focus on sustainability will be crucial for success in this dynamic and competitive market. The market is poised for continued expansion, with significant opportunities for brands that can successfully adapt to changing consumer demands and navigate the challenges of the global supply chain.
Women Non Athletic Shoes Industry Segmentation
-
1. Type
- 1.1. Boots and Shoes
- 1.2. Heels and Pumps
- 1.3. Flats
- 1.4. Sandals
- 1.5. Other Footwear Types
-
2. Distribution Channel
- 2.1. Online
- 2.2. Offline
-
3. Category
- 3.1. Mass
- 3.2. Premium
Women Non Athletic Shoes Industry Segmentation By Geography
-
1. North America
- 1.1. United States
- 1.2. Canada
- 1.3. Rest of North America
-
2. Europe
- 2.1. Spain
- 2.2. United Kingdom
- 2.3. Germany
- 2.4. France
- 2.5. Italy
- 2.6. Rest of Europe
-
3. Asia Pacific
- 3.1. China
- 3.2. Japan
- 3.3. India
- 3.4. Australia
- 3.5. Rest of Asia Pacific
-
4. South America
- 4.1. Brazil
- 4.2. Argentina
- 4.3. Rest of South America
-
5. Middle East and Africa
- 5.1. South Africa
- 5.2. Saudi Arabia
- 5.3. Rest of Middle East and Africa
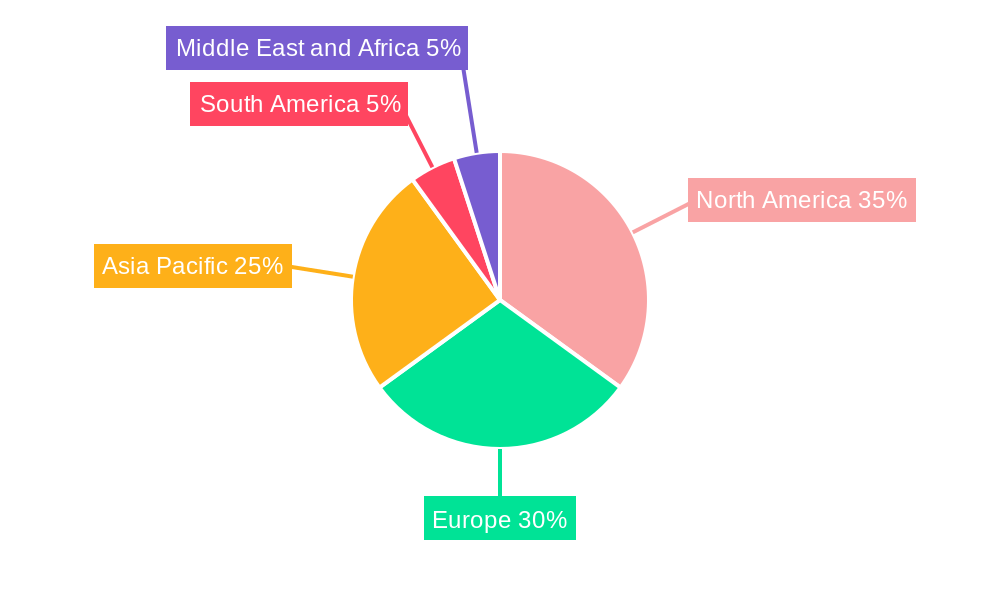
Women Non Athletic Shoes Industry Regional Market Share
Geographic Coverage of Women Non Athletic Shoes Industry
Women Non Athletic Shoes Industry REPORT HIGHLIGHTS
| Aspects | Details |
|---|---|
| Study Period | 2020-2034 |
| Base Year | 2025 |
| Estimated Year | 2026 |
| Forecast Period | 2026-2034 |
| Historical Period | 2020-2025 |
| Growth Rate | CAGR of 3.68% from 2020-2034 |
| Segmentation |
|
Table of Contents
- 1. Introduction
- 1.1. Research Scope
- 1.2. Market Segmentation
- 1.3. Research Objective
- 1.4. Definitions and Assumptions
- 2. Executive Summary
- 2.1. Market Snapshot
- 3. Market Dynamics
- 3.1. Market Drivers
- 3.2. Market Restrains
- 3.3. Market Trends
- 3.4. Market Opportunities
- 4. Market Factor Analysis
- 4.1. Porters Five Forces
- 4.1.1. Bargaining Power of Suppliers
- 4.1.2. Bargaining Power of Buyers
- 4.1.3. Threat of New Entrants
- 4.1.4. Threat of Substitutes
- 4.1.5. Competitive Rivalry
- 4.2. PESTEL analysis
- 4.3. BCG Analysis
- 4.3.1. Stars (High Growth, High Market Share)
- 4.3.2. Cash Cows (Low Growth, High Market Share)
- 4.3.3. Question Mark (High Growth, Low Market Share)
- 4.3.4. Dogs (Low Growth, Low Market Share)
- 4.4. Ansoff Matrix Analysis
- 4.5. Supply Chain Analysis
- 4.6. Regulatory Landscape
- 4.7. Current Market Potential and Opportunity Assessment (TAM–SAM–SOM Framework)
- 4.8. TIR Analyst Note
- 4.1. Porters Five Forces
- 5. Market Analysis, Insights and Forecast 2021-2033
- 5.1. Market Analysis, Insights and Forecast - by Type
- 5.1.1. Boots and Shoes
- 5.1.2. Heels and Pumps
- 5.1.3. Flats
- 5.1.4. Sandals
- 5.1.5. Other Footwear Types
- 5.2. Market Analysis, Insights and Forecast - by Distribution Channel
- 5.2.1. Online
- 5.2.2. Offline
- 5.3. Market Analysis, Insights and Forecast - by Category
- 5.3.1. Mass
- 5.3.2. Premium
- 5.4. Market Analysis, Insights and Forecast - by Region
- 5.4.1. North America
- 5.4.2. Europe
- 5.4.3. Asia Pacific
- 5.4.4. South America
- 5.4.5. Middle East and Africa
- 5.1. Market Analysis, Insights and Forecast - by Type
- 6. Global Women Non Athletic Shoes Industry Analysis, Insights and Forecast, 2021-2033
- 6.1. Market Analysis, Insights and Forecast - by Type
- 6.1.1. Boots and Shoes
- 6.1.2. Heels and Pumps
- 6.1.3. Flats
- 6.1.4. Sandals
- 6.1.5. Other Footwear Types
- 6.2. Market Analysis, Insights and Forecast - by Distribution Channel
- 6.2.1. Online
- 6.2.2. Offline
- 6.3. Market Analysis, Insights and Forecast - by Category
- 6.3.1. Mass
- 6.3.2. Premium
- 6.1. Market Analysis, Insights and Forecast - by Type
- 7. North America Women Non Athletic Shoes Industry Analysis, Insights and Forecast, 2020-2032
- 7.1. Market Analysis, Insights and Forecast - by Type
- 7.1.1. Boots and Shoes
- 7.1.2. Heels and Pumps
- 7.1.3. Flats
- 7.1.4. Sandals
- 7.1.5. Other Footwear Types
- 7.2. Market Analysis, Insights and Forecast - by Distribution Channel
- 7.2.1. Online
- 7.2.2. Offline
- 7.3. Market Analysis, Insights and Forecast - by Category
- 7.3.1. Mass
- 7.3.2. Premium
- 7.1. Market Analysis, Insights and Forecast - by Type
- 8. Europe Women Non Athletic Shoes Industry Analysis, Insights and Forecast, 2020-2032
- 8.1. Market Analysis, Insights and Forecast - by Type
- 8.1.1. Boots and Shoes
- 8.1.2. Heels and Pumps
- 8.1.3. Flats
- 8.1.4. Sandals
- 8.1.5. Other Footwear Types
- 8.2. Market Analysis, Insights and Forecast - by Distribution Channel
- 8.2.1. Online
- 8.2.2. Offline
- 8.3. Market Analysis, Insights and Forecast - by Category
- 8.3.1. Mass
- 8.3.2. Premium
- 8.1. Market Analysis, Insights and Forecast - by Type
- 9. Asia Pacific Women Non Athletic Shoes Industry Analysis, Insights and Forecast, 2020-2032
- 9.1. Market Analysis, Insights and Forecast - by Type
- 9.1.1. Boots and Shoes
- 9.1.2. Heels and Pumps
- 9.1.3. Flats
- 9.1.4. Sandals
- 9.1.5. Other Footwear Types
- 9.2. Market Analysis, Insights and Forecast - by Distribution Channel
- 9.2.1. Online
- 9.2.2. Offline
- 9.3. Market Analysis, Insights and Forecast - by Category
- 9.3.1. Mass
- 9.3.2. Premium
- 9.1. Market Analysis, Insights and Forecast - by Type
- 10. South America Women Non Athletic Shoes Industry Analysis, Insights and Forecast, 2020-2032
- 10.1. Market Analysis, Insights and Forecast - by Type
- 10.1.1. Boots and Shoes
- 10.1.2. Heels and Pumps
- 10.1.3. Flats
- 10.1.4. Sandals
- 10.1.5. Other Footwear Types
- 10.2. Market Analysis, Insights and Forecast - by Distribution Channel
- 10.2.1. Online
- 10.2.2. Offline
- 10.3. Market Analysis, Insights and Forecast - by Category
- 10.3.1. Mass
- 10.3.2. Premium
- 10.1. Market Analysis, Insights and Forecast - by Type
- 11. Middle East and Africa Women Non Athletic Shoes Industry Analysis, Insights and Forecast, 2020-2032
- 11.1. Market Analysis, Insights and Forecast - by Type
- 11.1.1. Boots and Shoes
- 11.1.2. Heels and Pumps
- 11.1.3. Flats
- 11.1.4. Sandals
- 11.1.5. Other Footwear Types
- 11.2. Market Analysis, Insights and Forecast - by Distribution Channel
- 11.2.1. Online
- 11.2.2. Offline
- 11.3. Market Analysis, Insights and Forecast - by Category
- 11.3.1. Mass
- 11.3.2. Premium
- 11.1. Market Analysis, Insights and Forecast - by Type
- 12. Competitive Analysis
- 12.1. Company Profiles
- 12.1.1 The ALDO Group Inc
- 12.1.1.1. Company Overview
- 12.1.1.2. Products
- 12.1.1.3. Company Financials
- 12.1.1.4. SWOT Analysis
- 12.1.2 Bata Corporation
- 12.1.2.1. Company Overview
- 12.1.2.2. Products
- 12.1.2.3. Company Financials
- 12.1.2.4. SWOT Analysis
- 12.1.3 Tapestry Inc
- 12.1.3.1. Company Overview
- 12.1.3.2. Products
- 12.1.3.3. Company Financials
- 12.1.3.4. SWOT Analysis
- 12.1.4 Kering
- 12.1.4.1. Company Overview
- 12.1.4.2. Products
- 12.1.4.3. Company Financials
- 12.1.4.4. SWOT Analysis
- 12.1.5 LVMH
- 12.1.5.1. Company Overview
- 12.1.5.2. Products
- 12.1.5.3. Company Financials
- 12.1.5.4. SWOT Analysis
- 12.1.6 Capri Holdings
- 12.1.6.1. Company Overview
- 12.1.6.2. Products
- 12.1.6.3. Company Financials
- 12.1.6.4. SWOT Analysis
- 12.1.7 Prada SpA
- 12.1.7.1. Company Overview
- 12.1.7.2. Products
- 12.1.7.3. Company Financials
- 12.1.7.4. SWOT Analysis
- 12.1.8 LIR SRL
- 12.1.8.1. Company Overview
- 12.1.8.2. Products
- 12.1.8.3. Company Financials
- 12.1.8.4. SWOT Analysis
- 12.1.9 CHANEL
- 12.1.9.1. Company Overview
- 12.1.9.2. Products
- 12.1.9.3. Company Financials
- 12.1.9.4. SWOT Analysis
- 12.1.10 VF Corporation*List Not Exhaustive
- 12.1.10.1. Company Overview
- 12.1.10.2. Products
- 12.1.10.3. Company Financials
- 12.1.10.4. SWOT Analysis
- 12.1.1 The ALDO Group Inc
- 12.2. Market Entropy
- 12.2.1 Company's Key Areas Served
- 12.2.2 Recent Developments
- 12.3. Company Market Share Analysis 2025
- 12.3.1 Top 5 Companies Market Share Analysis
- 12.3.2 Top 3 Companies Market Share Analysis
- 12.4. List of Potential Customers
- 13. Research Methodology
List of Figures
- Figure 1: Global Women Non Athletic Shoes Industry Revenue Breakdown (Million, %) by Region 2025 & 2033
- Figure 2: Global Women Non Athletic Shoes Industry Volume Breakdown (K Units, %) by Region 2025 & 2033
- Figure 3: North America Women Non Athletic Shoes Industry Revenue (Million), by Type 2025 & 2033
- Figure 4: North America Women Non Athletic Shoes Industry Volume (K Units), by Type 2025 & 2033
- Figure 5: North America Women Non Athletic Shoes Industry Revenue Share (%), by Type 2025 & 2033
- Figure 6: North America Women Non Athletic Shoes Industry Volume Share (%), by Type 2025 & 2033
- Figure 7: North America Women Non Athletic Shoes Industry Revenue (Million), by Distribution Channel 2025 & 2033
- Figure 8: North America Women Non Athletic Shoes Industry Volume (K Units), by Distribution Channel 2025 & 2033
- Figure 9: North America Women Non Athletic Shoes Industry Revenue Share (%), by Distribution Channel 2025 & 2033
- Figure 10: North America Women Non Athletic Shoes Industry Volume Share (%), by Distribution Channel 2025 & 2033
- Figure 11: North America Women Non Athletic Shoes Industry Revenue (Million), by Category 2025 & 2033
- Figure 12: North America Women Non Athletic Shoes Industry Volume (K Units), by Category 2025 & 2033
- Figure 13: North America Women Non Athletic Shoes Industry Revenue Share (%), by Category 2025 & 2033
- Figure 14: North America Women Non Athletic Shoes Industry Volume Share (%), by Category 2025 & 2033
- Figure 15: North America Women Non Athletic Shoes Industry Revenue (Million), by Country 2025 & 2033
- Figure 16: North America Women Non Athletic Shoes Industry Volume (K Units), by Country 2025 & 2033
- Figure 17: North America Women Non Athletic Shoes Industry Revenue Share (%), by Country 2025 & 2033
- Figure 18: North America Women Non Athletic Shoes Industry Volume Share (%), by Country 2025 & 2033
- Figure 19: Europe Women Non Athletic Shoes Industry Revenue (Million), by Type 2025 & 2033
- Figure 20: Europe Women Non Athletic Shoes Industry Volume (K Units), by Type 2025 & 2033
- Figure 21: Europe Women Non Athletic Shoes Industry Revenue Share (%), by Type 2025 & 2033
- Figure 22: Europe Women Non Athletic Shoes Industry Volume Share (%), by Type 2025 & 2033
- Figure 23: Europe Women Non Athletic Shoes Industry Revenue (Million), by Distribution Channel 2025 & 2033
- Figure 24: Europe Women Non Athletic Shoes Industry Volume (K Units), by Distribution Channel 2025 & 2033
- Figure 25: Europe Women Non Athletic Shoes Industry Revenue Share (%), by Distribution Channel 2025 & 2033
- Figure 26: Europe Women Non Athletic Shoes Industry Volume Share (%), by Distribution Channel 2025 & 2033
- Figure 27: Europe Women Non Athletic Shoes Industry Revenue (Million), by Category 2025 & 2033
- Figure 28: Europe Women Non Athletic Shoes Industry Volume (K Units), by Category 2025 & 2033
- Figure 29: Europe Women Non Athletic Shoes Industry Revenue Share (%), by Category 2025 & 2033
- Figure 30: Europe Women Non Athletic Shoes Industry Volume Share (%), by Category 2025 & 2033
- Figure 31: Europe Women Non Athletic Shoes Industry Revenue (Million), by Country 2025 & 2033
- Figure 32: Europe Women Non Athletic Shoes Industry Volume (K Units), by Country 2025 & 2033
- Figure 33: Europe Women Non Athletic Shoes Industry Revenue Share (%), by Country 2025 & 2033
- Figure 34: Europe Women Non Athletic Shoes Industry Volume Share (%), by Country 2025 & 2033
- Figure 35: Asia Pacific Women Non Athletic Shoes Industry Revenue (Million), by Type 2025 & 2033
- Figure 36: Asia Pacific Women Non Athletic Shoes Industry Volume (K Units), by Type 2025 & 2033
- Figure 37: Asia Pacific Women Non Athletic Shoes Industry Revenue Share (%), by Type 2025 & 2033
- Figure 38: Asia Pacific Women Non Athletic Shoes Industry Volume Share (%), by Type 2025 & 2033
- Figure 39: Asia Pacific Women Non Athletic Shoes Industry Revenue (Million), by Distribution Channel 2025 & 2033
- Figure 40: Asia Pacific Women Non Athletic Shoes Industry Volume (K Units), by Distribution Channel 2025 & 2033
- Figure 41: Asia Pacific Women Non Athletic Shoes Industry Revenue Share (%), by Distribution Channel 2025 & 2033
- Figure 42: Asia Pacific Women Non Athletic Shoes Industry Volume Share (%), by Distribution Channel 2025 & 2033
- Figure 43: Asia Pacific Women Non Athletic Shoes Industry Revenue (Million), by Category 2025 & 2033
- Figure 44: Asia Pacific Women Non Athletic Shoes Industry Volume (K Units), by Category 2025 & 2033
- Figure 45: Asia Pacific Women Non Athletic Shoes Industry Revenue Share (%), by Category 2025 & 2033
- Figure 46: Asia Pacific Women Non Athletic Shoes Industry Volume Share (%), by Category 2025 & 2033
- Figure 47: Asia Pacific Women Non Athletic Shoes Industry Revenue (Million), by Country 2025 & 2033
- Figure 48: Asia Pacific Women Non Athletic Shoes Industry Volume (K Units), by Country 2025 & 2033
- Figure 49: Asia Pacific Women Non Athletic Shoes Industry Revenue Share (%), by Country 2025 & 2033
- Figure 50: Asia Pacific Women Non Athletic Shoes Industry Volume Share (%), by Country 2025 & 2033
- Figure 51: South America Women Non Athletic Shoes Industry Revenue (Million), by Type 2025 & 2033
- Figure 52: South America Women Non Athletic Shoes Industry Volume (K Units), by Type 2025 & 2033
- Figure 53: South America Women Non Athletic Shoes Industry Revenue Share (%), by Type 2025 & 2033
- Figure 54: South America Women Non Athletic Shoes Industry Volume Share (%), by Type 2025 & 2033
- Figure 55: South America Women Non Athletic Shoes Industry Revenue (Million), by Distribution Channel 2025 & 2033
- Figure 56: South America Women Non Athletic Shoes Industry Volume (K Units), by Distribution Channel 2025 & 2033
- Figure 57: South America Women Non Athletic Shoes Industry Revenue Share (%), by Distribution Channel 2025 & 2033
- Figure 58: South America Women Non Athletic Shoes Industry Volume Share (%), by Distribution Channel 2025 & 2033
- Figure 59: South America Women Non Athletic Shoes Industry Revenue (Million), by Category 2025 & 2033
- Figure 60: South America Women Non Athletic Shoes Industry Volume (K Units), by Category 2025 & 2033
- Figure 61: South America Women Non Athletic Shoes Industry Revenue Share (%), by Category 2025 & 2033
- Figure 62: South America Women Non Athletic Shoes Industry Volume Share (%), by Category 2025 & 2033
- Figure 63: South America Women Non Athletic Shoes Industry Revenue (Million), by Country 2025 & 2033
- Figure 64: South America Women Non Athletic Shoes Industry Volume (K Units), by Country 2025 & 2033
- Figure 65: South America Women Non Athletic Shoes Industry Revenue Share (%), by Country 2025 & 2033
- Figure 66: South America Women Non Athletic Shoes Industry Volume Share (%), by Country 2025 & 2033
- Figure 67: Middle East and Africa Women Non Athletic Shoes Industry Revenue (Million), by Type 2025 & 2033
- Figure 68: Middle East and Africa Women Non Athletic Shoes Industry Volume (K Units), by Type 2025 & 2033
- Figure 69: Middle East and Africa Women Non Athletic Shoes Industry Revenue Share (%), by Type 2025 & 2033
- Figure 70: Middle East and Africa Women Non Athletic Shoes Industry Volume Share (%), by Type 2025 & 2033
- Figure 71: Middle East and Africa Women Non Athletic Shoes Industry Revenue (Million), by Distribution Channel 2025 & 2033
- Figure 72: Middle East and Africa Women Non Athletic Shoes Industry Volume (K Units), by Distribution Channel 2025 & 2033
- Figure 73: Middle East and Africa Women Non Athletic Shoes Industry Revenue Share (%), by Distribution Channel 2025 & 2033
- Figure 74: Middle East and Africa Women Non Athletic Shoes Industry Volume Share (%), by Distribution Channel 2025 & 2033
- Figure 75: Middle East and Africa Women Non Athletic Shoes Industry Revenue (Million), by Category 2025 & 2033
- Figure 76: Middle East and Africa Women Non Athletic Shoes Industry Volume (K Units), by Category 2025 & 2033
- Figure 77: Middle East and Africa Women Non Athletic Shoes Industry Revenue Share (%), by Category 2025 & 2033
- Figure 78: Middle East and Africa Women Non Athletic Shoes Industry Volume Share (%), by Category 2025 & 2033
- Figure 79: Middle East and Africa Women Non Athletic Shoes Industry Revenue (Million), by Country 2025 & 2033
- Figure 80: Middle East and Africa Women Non Athletic Shoes Industry Volume (K Units), by Country 2025 & 2033
- Figure 81: Middle East and Africa Women Non Athletic Shoes Industry Revenue Share (%), by Country 2025 & 2033
- Figure 82: Middle East and Africa Women Non Athletic Shoes Industry Volume Share (%), by Country 2025 & 2033
List of Tables
- Table 1: Global Women Non Athletic Shoes Industry Revenue Million Forecast, by Type 2020 & 2033
- Table 2: Global Women Non Athletic Shoes Industry Volume K Units Forecast, by Type 2020 & 2033
- Table 3: Global Women Non Athletic Shoes Industry Revenue Million Forecast, by Distribution Channel 2020 & 2033
- Table 4: Global Women Non Athletic Shoes Industry Volume K Units Forecast, by Distribution Channel 2020 & 2033
- Table 5: Global Women Non Athletic Shoes Industry Revenue Million Forecast, by Category 2020 & 2033
- Table 6: Global Women Non Athletic Shoes Industry Volume K Units Forecast, by Category 2020 & 2033
- Table 7: Global Women Non Athletic Shoes Industry Revenue Million Forecast, by Region 2020 & 2033
- Table 8: Global Women Non Athletic Shoes Industry Volume K Units Forecast, by Region 2020 & 2033
- Table 9: Global Women Non Athletic Shoes Industry Revenue Million Forecast, by Type 2020 & 2033
- Table 10: Global Women Non Athletic Shoes Industry Volume K Units Forecast, by Type 2020 & 2033
- Table 11: Global Women Non Athletic Shoes Industry Revenue Million Forecast, by Distribution Channel 2020 & 2033
- Table 12: Global Women Non Athletic Shoes Industry Volume K Units Forecast, by Distribution Channel 2020 & 2033
- Table 13: Global Women Non Athletic Shoes Industry Revenue Million Forecast, by Category 2020 & 2033
- Table 14: Global Women Non Athletic Shoes Industry Volume K Units Forecast, by Category 2020 & 2033
- Table 15: Global Women Non Athletic Shoes Industry Revenue Million Forecast, by Country 2020 & 2033
- Table 16: Global Women Non Athletic Shoes Industry Volume K Units Forecast, by Country 2020 & 2033
- Table 17: United States Women Non Athletic Shoes Industry Revenue (Million) Forecast, by Application 2020 & 2033
- Table 18: United States Women Non Athletic Shoes Industry Volume (K Units) Forecast, by Application 2020 & 2033
- Table 19: Canada Women Non Athletic Shoes Industry Revenue (Million) Forecast, by Application 2020 & 2033
- Table 20: Canada Women Non Athletic Shoes Industry Volume (K Units) Forecast, by Application 2020 & 2033
- Table 21: Rest of North America Women Non Athletic Shoes Industry Revenue (Million) Forecast, by Application 2020 & 2033
- Table 22: Rest of North America Women Non Athletic Shoes Industry Volume (K Units) Forecast, by Application 2020 & 2033
- Table 23: Global Women Non Athletic Shoes Industry Revenue Million Forecast, by Type 2020 & 2033
- Table 24: Global Women Non Athletic Shoes Industry Volume K Units Forecast, by Type 2020 & 2033
- Table 25: Global Women Non Athletic Shoes Industry Revenue Million Forecast, by Distribution Channel 2020 & 2033
- Table 26: Global Women Non Athletic Shoes Industry Volume K Units Forecast, by Distribution Channel 2020 & 2033
- Table 27: Global Women Non Athletic Shoes Industry Revenue Million Forecast, by Category 2020 & 2033
- Table 28: Global Women Non Athletic Shoes Industry Volume K Units Forecast, by Category 2020 & 2033
- Table 29: Global Women Non Athletic Shoes Industry Revenue Million Forecast, by Country 2020 & 2033
- Table 30: Global Women Non Athletic Shoes Industry Volume K Units Forecast, by Country 2020 & 2033
- Table 31: Spain Women Non Athletic Shoes Industry Revenue (Million) Forecast, by Application 2020 & 2033
- Table 32: Spain Women Non Athletic Shoes Industry Volume (K Units) Forecast, by Application 2020 & 2033
- Table 33: United Kingdom Women Non Athletic Shoes Industry Revenue (Million) Forecast, by Application 2020 & 2033
- Table 34: United Kingdom Women Non Athletic Shoes Industry Volume (K Units) Forecast, by Application 2020 & 2033
- Table 35: Germany Women Non Athletic Shoes Industry Revenue (Million) Forecast, by Application 2020 & 2033
- Table 36: Germany Women Non Athletic Shoes Industry Volume (K Units) Forecast, by Application 2020 & 2033
- Table 37: France Women Non Athletic Shoes Industry Revenue (Million) Forecast, by Application 2020 & 2033
- Table 38: France Women Non Athletic Shoes Industry Volume (K Units) Forecast, by Application 2020 & 2033
- Table 39: Italy Women Non Athletic Shoes Industry Revenue (Million) Forecast, by Application 2020 & 2033
- Table 40: Italy Women Non Athletic Shoes Industry Volume (K Units) Forecast, by Application 2020 & 2033
- Table 41: Rest of Europe Women Non Athletic Shoes Industry Revenue (Million) Forecast, by Application 2020 & 2033
- Table 42: Rest of Europe Women Non Athletic Shoes Industry Volume (K Units) Forecast, by Application 2020 & 2033
- Table 43: Global Women Non Athletic Shoes Industry Revenue Million Forecast, by Type 2020 & 2033
- Table 44: Global Women Non Athletic Shoes Industry Volume K Units Forecast, by Type 2020 & 2033
- Table 45: Global Women Non Athletic Shoes Industry Revenue Million Forecast, by Distribution Channel 2020 & 2033
- Table 46: Global Women Non Athletic Shoes Industry Volume K Units Forecast, by Distribution Channel 2020 & 2033
- Table 47: Global Women Non Athletic Shoes Industry Revenue Million Forecast, by Category 2020 & 2033
- Table 48: Global Women Non Athletic Shoes Industry Volume K Units Forecast, by Category 2020 & 2033
- Table 49: Global Women Non Athletic Shoes Industry Revenue Million Forecast, by Country 2020 & 2033
- Table 50: Global Women Non Athletic Shoes Industry Volume K Units Forecast, by Country 2020 & 2033
- Table 51: China Women Non Athletic Shoes Industry Revenue (Million) Forecast, by Application 2020 & 2033
- Table 52: China Women Non Athletic Shoes Industry Volume (K Units) Forecast, by Application 2020 & 2033
- Table 53: Japan Women Non Athletic Shoes Industry Revenue (Million) Forecast, by Application 2020 & 2033
- Table 54: Japan Women Non Athletic Shoes Industry Volume (K Units) Forecast, by Application 2020 & 2033
- Table 55: India Women Non Athletic Shoes Industry Revenue (Million) Forecast, by Application 2020 & 2033
- Table 56: India Women Non Athletic Shoes Industry Volume (K Units) Forecast, by Application 2020 & 2033
- Table 57: Australia Women Non Athletic Shoes Industry Revenue (Million) Forecast, by Application 2020 & 2033
- Table 58: Australia Women Non Athletic Shoes Industry Volume (K Units) Forecast, by Application 2020 & 2033
- Table 59: Rest of Asia Pacific Women Non Athletic Shoes Industry Revenue (Million) Forecast, by Application 2020 & 2033
- Table 60: Rest of Asia Pacific Women Non Athletic Shoes Industry Volume (K Units) Forecast, by Application 2020 & 2033
- Table 61: Global Women Non Athletic Shoes Industry Revenue Million Forecast, by Type 2020 & 2033
- Table 62: Global Women Non Athletic Shoes Industry Volume K Units Forecast, by Type 2020 & 2033
- Table 63: Global Women Non Athletic Shoes Industry Revenue Million Forecast, by Distribution Channel 2020 & 2033
- Table 64: Global Women Non Athletic Shoes Industry Volume K Units Forecast, by Distribution Channel 2020 & 2033
- Table 65: Global Women Non Athletic Shoes Industry Revenue Million Forecast, by Category 2020 & 2033
- Table 66: Global Women Non Athletic Shoes Industry Volume K Units Forecast, by Category 2020 & 2033
- Table 67: Global Women Non Athletic Shoes Industry Revenue Million Forecast, by Country 2020 & 2033
- Table 68: Global Women Non Athletic Shoes Industry Volume K Units Forecast, by Country 2020 & 2033
- Table 69: Brazil Women Non Athletic Shoes Industry Revenue (Million) Forecast, by Application 2020 & 2033
- Table 70: Brazil Women Non Athletic Shoes Industry Volume (K Units) Forecast, by Application 2020 & 2033
- Table 71: Argentina Women Non Athletic Shoes Industry Revenue (Million) Forecast, by Application 2020 & 2033
- Table 72: Argentina Women Non Athletic Shoes Industry Volume (K Units) Forecast, by Application 2020 & 2033
- Table 73: Rest of South America Women Non Athletic Shoes Industry Revenue (Million) Forecast, by Application 2020 & 2033
- Table 74: Rest of South America Women Non Athletic Shoes Industry Volume (K Units) Forecast, by Application 2020 & 2033
- Table 75: Global Women Non Athletic Shoes Industry Revenue Million Forecast, by Type 2020 & 2033
- Table 76: Global Women Non Athletic Shoes Industry Volume K Units Forecast, by Type 2020 & 2033
- Table 77: Global Women Non Athletic Shoes Industry Revenue Million Forecast, by Distribution Channel 2020 & 2033
- Table 78: Global Women Non Athletic Shoes Industry Volume K Units Forecast, by Distribution Channel 2020 & 2033
- Table 79: Global Women Non Athletic Shoes Industry Revenue Million Forecast, by Category 2020 & 2033
- Table 80: Global Women Non Athletic Shoes Industry Volume K Units Forecast, by Category 2020 & 2033
- Table 81: Global Women Non Athletic Shoes Industry Revenue Million Forecast, by Country 2020 & 2033
- Table 82: Global Women Non Athletic Shoes Industry Volume K Units Forecast, by Country 2020 & 2033
- Table 83: South Africa Women Non Athletic Shoes Industry Revenue (Million) Forecast, by Application 2020 & 2033
- Table 84: South Africa Women Non Athletic Shoes Industry Volume (K Units) Forecast, by Application 2020 & 2033
- Table 85: Saudi Arabia Women Non Athletic Shoes Industry Revenue (Million) Forecast, by Application 2020 & 2033
- Table 86: Saudi Arabia Women Non Athletic Shoes Industry Volume (K Units) Forecast, by Application 2020 & 2033
- Table 87: Rest of Middle East and Africa Women Non Athletic Shoes Industry Revenue (Million) Forecast, by Application 2020 & 2033
- Table 88: Rest of Middle East and Africa Women Non Athletic Shoes Industry Volume (K Units) Forecast, by Application 2020 & 2033
Frequently Asked Questions
1. What is the projected Compound Annual Growth Rate (CAGR) of the Women Non Athletic Shoes Industry?
The projected CAGR is approximately 3.68%.
2. Which companies are prominent players in the Women Non Athletic Shoes Industry?
Key companies in the market include The ALDO Group Inc, Bata Corporation, Tapestry Inc, Kering, LVMH, Capri Holdings, Prada SpA, LIR SRL, CHANEL, VF Corporation*List Not Exhaustive.
3. What are the main segments of the Women Non Athletic Shoes Industry?
The market segments include Type, Distribution Channel, Category.
4. Can you provide details about the market size?
The market size is estimated to be USD 132.83 Million as of 2022.
5. What are some drivers contributing to market growth?
Fast Fashion Trend; Inflating Income Level of Individuals.
6. What are the notable trends driving market growth?
Emergence of E-Commerce.
7. Are there any restraints impacting market growth?
The Presence Of Counterfeit Products.
8. Can you provide examples of recent developments in the market?
In June 2021, Louis Vuitton collaborated with internet superstars Emma Chamberlain and Charli D'Amelio for the launch of the LV Squad sneaker and LV Sunset mule footwear campaign. The new footwear variants have been made available across the brand's stores and online websites.
9. What pricing options are available for accessing the report?
Pricing options include single-user, multi-user, and enterprise licenses priced at USD 4750, USD 5250, and USD 8750 respectively.
10. Is the market size provided in terms of value or volume?
The market size is provided in terms of value, measured in Million and volume, measured in K Units.
11. Are there any specific market keywords associated with the report?
Yes, the market keyword associated with the report is "Women Non Athletic Shoes Industry," which aids in identifying and referencing the specific market segment covered.
12. How do I determine which pricing option suits my needs best?
The pricing options vary based on user requirements and access needs. Individual users may opt for single-user licenses, while businesses requiring broader access may choose multi-user or enterprise licenses for cost-effective access to the report.
13. Are there any additional resources or data provided in the Women Non Athletic Shoes Industry report?
While the report offers comprehensive insights, it's advisable to review the specific contents or supplementary materials provided to ascertain if additional resources or data are available.
14. How can I stay updated on further developments or reports in the Women Non Athletic Shoes Industry?
To stay informed about further developments, trends, and reports in the Women Non Athletic Shoes Industry, consider subscribing to industry newsletters, following relevant companies and organizations, or regularly checking reputable industry news sources and publications.
Methodology
Step 1 - Identification of Relevant Samples Size from Population Database


Step 2 - Approaches for Defining Global Market Size (Value, Volume* & Price*)

Note*: In applicable scenarios
Step 3 - Data Sources
Primary Research
- Web Analytics
- Survey Reports
- Research Institute
- Latest Research Reports
- Opinion Leaders
Secondary Research
- Annual Reports
- White Paper
- Latest Press Release
- Industry Association
- Paid Database
- Investor Presentations

Step 4 - Data Triangulation
Involves using different sources of information in order to increase the validity of a study
These sources are likely to be stakeholders in a program - participants, other researchers, program staff, other community members, and so on.
Then we put all data in single framework & apply various statistical tools to find out the dynamic on the market.
During the analysis stage, feedback from the stakeholder groups would be compared to determine areas of agreement as well as areas of divergence