

Key Insights
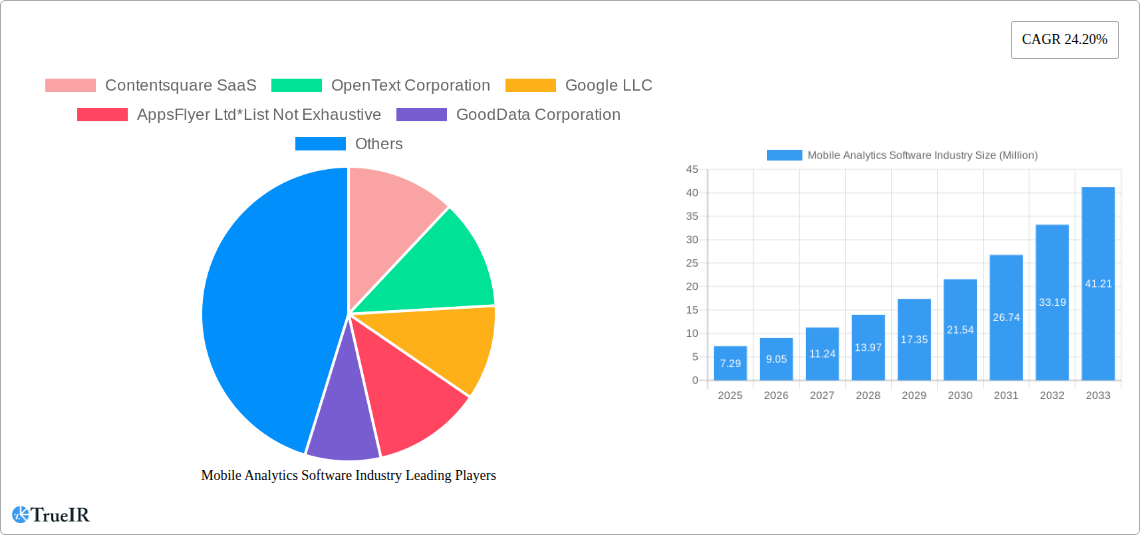
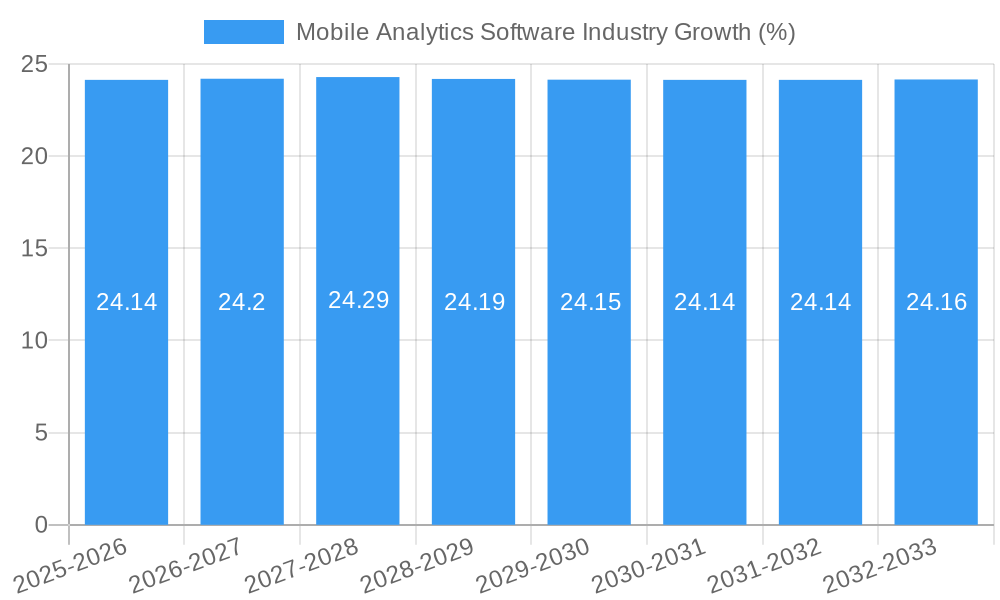
The global Mobile Analytics Software market is poised for substantial growth, projected to reach an estimated $7.29 million in 2025, driven by a remarkable Compound Annual Growth Rate (CAGR) of 24.20%. This robust expansion is primarily fueled by the increasing demand for sophisticated tools that can provide deep insights into user behavior, application performance, and campaign effectiveness. As businesses across various sectors increasingly rely on data-driven decision-making to optimize user engagement, personalize experiences, and maximize ROI, the adoption of mobile analytics solutions is becoming indispensable. Key growth drivers include the escalating proliferation of mobile devices, the ever-growing volume of mobile app usage, and the need for real-time performance monitoring and predictive analytics. Furthermore, the integration of AI and machine learning capabilities within mobile analytics platforms is enhancing their predictive power and enabling more targeted marketing strategies.
The market is segmented by application type, with Application Analytics, Campaign Analytics, and Service Analytics expected to see significant adoption. In terms of end-user verticals, the Retail and BFSI (Banking, Financial Services, and Insurance) sectors are anticipated to be major contributors to market growth, leveraging mobile analytics to understand customer journeys, personalize offers, and improve service delivery. The IT and Telecom sector also presents a strong demand due to the complex nature of their service offerings and the need for continuous performance monitoring. Leading companies such as Google LLC, Microsoft Corporation, Salesforce.com Inc., and Adobe Inc. are actively investing in research and development, introducing advanced features and cloud-based solutions to capture a larger market share. While the market exhibits strong growth potential, potential restraints could include data privacy concerns, the complexity of integrating analytics tools with existing systems, and the availability of skilled professionals to interpret and act upon the data. However, the overarching trend towards a mobile-first digital economy strongly supports sustained market expansion.
Unlock Growth: The Definitive Mobile Analytics Software Industry Report (2019-2033)
Gain unparalleled insights into the booming mobile analytics software industry with this comprehensive report. Covering a dynamic study period from 2019 to 2033, with a deep dive into the base year 2025 and an extensive forecast period of 2025-2033, this report equips you with the crucial data and strategic foresight needed to navigate this rapidly evolving market. Understand how businesses are leveraging mobile app analytics, campaign analytics, and service analytics to drive revenue, enhance user retention, and optimize marketing strategies across key verticals like Retail, BFSI, IT and Telecom, and Media and Entertainment. Discover critical market trends, emerging opportunities, and the competitive landscape shaped by industry giants such as Contentsquare SaaS, OpenText Corporation, Google LLC, AppsFlyer Ltd, GoodData Corporation, Salesforce com Inc, Microsoft Corporation, Adobe Inc, Oracle Corp, and Facebook Inc.
Mobile Analytics Software Industry Market Structure & Competitive Landscape
The mobile analytics software market exhibits a moderately concentrated structure, driven by significant investment in innovation and platform development. Key players, including Contentsquare SaaS, Google LLC, and AppsFlyer Ltd, command substantial market share, fueled by advanced features in application analytics and campaign analytics. The intensity of competition is heightened by the continuous introduction of new solutions, such as IronSource's beta App Analytics tool in February 2022, designed to boost app revenue and retention. Regulatory impacts, while present, are largely focused on data privacy and security, prompting greater transparency and ethical data handling practices from providers like Adjust with their April 2022 release of Adjust Datascape. The threat of product substitutes is low due to the specialized nature of mobile analytics, but indirect competition arises from broader business intelligence platforms. End-user segmentation reveals a strong demand from the IT and Telecom sector, followed closely by Retail and BFSI, as these industries prioritize data-driven decision-making for customer engagement and operational efficiency. Mergers and acquisition (M&A) trends indicate a consolidation phase, with larger entities acquiring innovative startups to enhance their product portfolios and expand market reach. For instance, the market has witnessed a steady stream of strategic partnerships and acquisitions aimed at integrating advanced AI and machine learning capabilities into mobile analytics platforms, further solidifying the competitive landscape. The concentration ratio is estimated at approximately 65%, indicating that the top five players hold a significant portion of the market. M&A activities have averaged 15-20 significant deals per year over the historical period.
Mobile Analytics Software Industry Market Trends & Opportunities
The mobile analytics software industry is experiencing robust growth, projected to reach an estimated USD 15.5 Billion by 2025 and escalate to USD 32.1 Billion by 2033, demonstrating a Compound Annual Growth Rate (CAGR) of 10.5% during the forecast period. This expansion is propelled by the increasing proliferation of mobile devices, the exponential growth of mobile applications, and the escalating need for businesses to derive actionable insights from user behavior data. Technological shifts are central to this growth, with advancements in Artificial Intelligence (AI) and Machine Learning (ML) enabling more sophisticated predictive analytics, real-time data processing, and personalized user experiences. For example, the ability to track in-app user journeys and attribute campaign performance with greater accuracy is revolutionizing marketing spend optimization. Consumer preferences are increasingly leaning towards personalized content and seamless user experiences, making granular mobile app analytics essential for app developers and marketers. This trend is further amplified by the accessibility of data on-the-go, as evidenced by Pinterest's August 2022 release of real-time Pin Analytics on smartphones, allowing users to monitor performance anytime, anywhere. The competitive dynamics are characterized by intense innovation, with companies focusing on enhanced data visualization, predictive modeling, and cross-platform analytics. The market penetration rate for sophisticated mobile analytics solutions stands at approximately 60% of active mobile app developers, with significant room for growth. Emerging opportunities lie in leveraging user analytics for customer lifetime value (CLV) prediction, churn prevention, and hyper-personalization strategies. The increasing adoption of analytics by small and medium-sized enterprises (SMEs) also presents a substantial growth avenue, as more businesses recognize the competitive advantage offered by data-driven insights. Furthermore, the demand for specialized mobile marketing analytics tools that can measure the ROI of various marketing channels and campaigns continues to surge. The integration of Big Data technologies and cloud-based solutions is also a significant trend, offering scalability and enhanced processing power for massive datasets generated by mobile applications. The focus on user engagement metrics, such as session duration, feature adoption, and in-app purchase behavior, is becoming paramount for success in the highly competitive app ecosystem. The continuous evolution of mobile operating systems and app store policies also necessitates agile and responsive analytics solutions that can adapt to these changes. The market is also witnessing a growing interest in privacy-centric analytics solutions, reflecting increasing user awareness and regulatory demands.
Dominant Markets & Segments in Mobile Analytics Software Industry
The IT and Telecom sector consistently emerges as the dominant end-user vertical within the mobile analytics software industry, driven by the high volume of mobile app usage, the complexity of telecommunication services, and the imperative for continuous innovation in digital offerings. Countries with robust digital infrastructure and a high smartphone penetration rate, such as the United States, China, and Germany, lead in adoption and market value, contributing significantly to the global mobile analytics software market size, estimated to be around USD 12.1 Billion in 2025. Within the Type segment, Application Analytics holds the largest market share, accounting for over 45% of the total revenue. This dominance is attributed to the critical need for app developers and publishers to understand user behavior, optimize app performance, and enhance user engagement within their applications. Key growth drivers for Application Analytics include the proliferation of mobile games, e-commerce apps, and social media platforms, all of which rely heavily on in-depth user journey tracking and feature usage analysis.
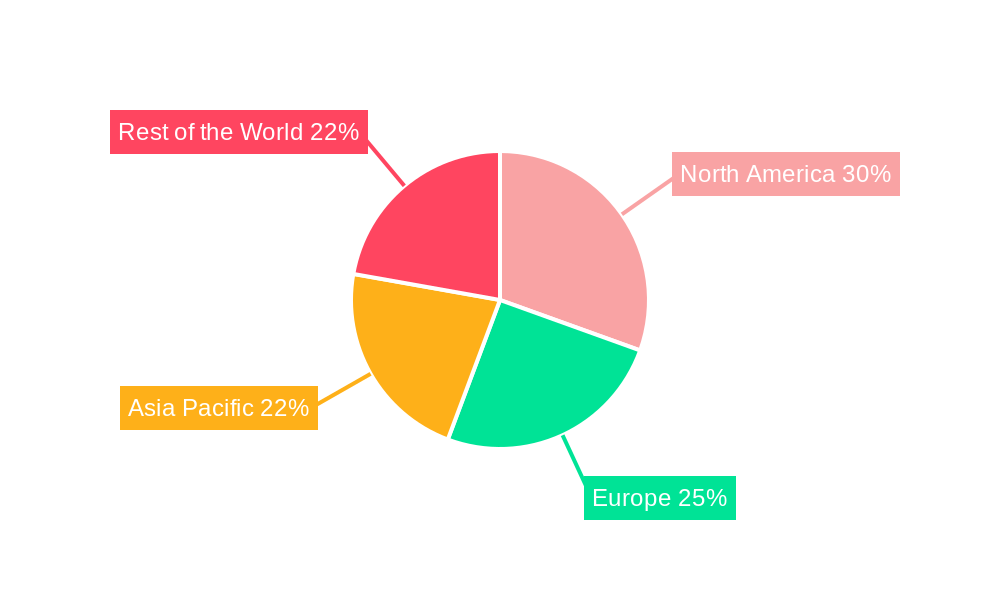
- Leading Region: North America, particularly the United States, is the leading region due to its early adoption of mobile technologies, significant investments in R&D, and the presence of major technology companies.
- Leading Country: The United States, with its massive app market and advanced technological ecosystem, is the largest country-specific market.
- Dominant Segment (Type): Application Analytics – Its growth is fueled by the demand for deeper user insights, including user acquisition, retention, and monetization strategies.
- Dominant Segment (End-User Vertical): IT and Telecom – This sector benefits from the extensive use of mobile applications for customer service, network management, and digital service delivery, driving the need for sophisticated analytics.
The BFSI and Retail verticals also exhibit substantial growth, driven by the increasing adoption of mobile banking, e-commerce, and personalized marketing campaigns. These sectors utilize campaign analytics to measure the effectiveness of their mobile advertising efforts, optimize customer acquisition costs, and personalize customer journeys. The Media and Entertainment sector is another significant contributor, leveraging analytics to understand content consumption patterns, personalize recommendations, and enhance user experience across streaming platforms and mobile gaming. The adoption of Service Analytics is gradually increasing, particularly in sectors where customer support and service delivery are primarily mobile-first. Government initiatives promoting digital transformation and citizen engagement through mobile platforms are also contributing to the expansion of the mobile analytics software market in the Government sector. The underlying growth in these segments is supported by advancements in data processing capabilities, the availability of sophisticated analytical tools, and the growing awareness among businesses about the competitive advantage derived from data-driven decision-making. The penetration of cloud-based analytics solutions further democratizes access to these powerful tools, enabling a wider range of businesses to leverage mobile analytics for growth.
Mobile Analytics Software Industry Product Analysis
The mobile analytics software industry is characterized by continuous product innovation focused on delivering real-time, actionable insights and enhancing user experience. Leading solutions offer advanced features such as predictive analytics, AI-driven segmentation, and sophisticated data visualization tools. For instance, Adjust Datascape, launched in April 2022, exemplifies this trend by providing quicker access to business-critical KPIs and performance metrics, empowering developers with unified data for smarter marketing decisions. The competitive advantage of these products lies in their ability to offer a holistic view of the user journey, from acquisition to in-app behavior and eventual conversion or churn. The integration of machine learning algorithms allows for sophisticated anomaly detection, trend forecasting, and personalized user journey mapping, making the analytics not just descriptive but also prescriptive.
Key Drivers, Barriers & Challenges in Mobile Analytics Software Industry
The mobile analytics software industry is propelled by several key drivers. The exponential growth in mobile device usage and the increasing reliance on mobile applications across all sectors create a fundamental demand for understanding user behavior. Technological advancements, particularly in AI and Big Data analytics, enable more sophisticated data processing and insight generation. Furthermore, the competitive need for businesses to personalize user experiences and optimize marketing ROI drives the adoption of advanced analytics tools.
Key challenges impacting the mobile analytics software industry include data privacy regulations (e.g., GDPR, CCPA) which necessitate robust compliance measures and can limit data collection and usage. The increasing volume and complexity of mobile data can also pose challenges in terms of storage, processing, and effective analysis. Moreover, the highly competitive landscape and the need for continuous innovation require significant investment in R&D, which can be a barrier for smaller players. Supply chain issues are less of a direct concern for software, but the dependency on cloud infrastructure and the availability of skilled data scientists can indirectly impact operations.
Growth Drivers in the Mobile Analytics Software Industry Market
The mobile analytics software industry is experiencing significant growth, fueled by several core factors. The escalating adoption of smartphones and mobile applications globally provides a vast pool of data for analysis. Technological advancements in Artificial Intelligence (AI) and Machine Learning (ML) are enabling more sophisticated predictive capabilities, offering deeper insights into user behavior and market trends. Government initiatives promoting digital transformation and data-driven decision-making across various sectors, such as BFSI and Healthcare, also contribute to market expansion. The increasing demand for personalized customer experiences and the need to optimize marketing spend for better ROI are critical business imperatives driving the adoption of advanced mobile analytics solutions.
Challenges Impacting Mobile Analytics Software Industry Growth
Despite the positive growth trajectory, the mobile analytics software industry faces several challenges. Stringent data privacy regulations, such as GDPR and CCPA, pose compliance hurdles and can impact data collection and utilization strategies, necessitating significant investments in privacy-preserving technologies. The sheer volume and velocity of mobile data generated present complexities in terms of storage, processing, and deriving meaningful insights, requiring scalable and efficient analytical platforms. Furthermore, the highly competitive market environment demands continuous innovation and significant R&D expenditure, which can be a barrier for smaller players. Talent acquisition and retention of skilled data scientists and analysts also remain a challenge.
Key Players Shaping the Mobile Analytics Software Industry Market
- Contentsquare SaaS
- OpenText Corporation
- Google LLC
- AppsFlyer Ltd
- GoodData Corporation
- Salesforce com Inc
- Microsoft Corporation
- Adobe Inc
- Oracle Corp
- Facebook Inc
Significant Mobile Analytics Software Industry Industry Milestones
- February 2022: IronSource announced a new app analytics tool to aid app and game creators in increasing revenue, customer retention, and growth. This beta edition of App Analytics provides a one-stop solution for app monetization, user recruitment, and analytics, with IronSource claiming superior usability (UX) compared to many alternatives.
- April 2022: Adjust released Adjust Datascape, a highly innovative analytics solution designed to deliver business-critical KPIs and performance metrics more quickly and simply. This mobile marketing analytics platform allows phone app developers to extract valuable insights and make smarter marketing strategy decisions in real time through unified data and enhanced visual context.
- August 2022: Pinterest launched real-time statistics for its Pin Analytics on smartphones. These tools aim to provide additional real-time information on how Pins perform, with the platform also accessible on its online Analytics platform, enhancing mobile accessibility for users.
Future Outlook for Mobile Analytics Software Industry Market
The future outlook for the mobile analytics software industry remains exceptionally bright, driven by the persistent growth of mobile ecosystems and the ever-increasing need for data-driven decision-making. Emerging trends such as the integration of advanced AI for predictive user behavior analysis, hyper-personalization at scale, and cross-platform analytics will continue to shape the market. Opportunities abound for solutions that can provide deeper insights into customer lifetime value, churn prediction, and augmented reality (AR) and virtual reality (VR) user experiences. The increasing adoption by SMEs and the demand for privacy-compliant analytics will also fuel market expansion. The industry is poised for continued innovation, with a focus on real-time actionable insights and seamless integration across diverse marketing and operational platforms, solidifying its critical role in business strategy.
Mobile Analytics Software Industry Segmentation
-
1. Type
- 1.1. Application Analytics
- 1.2. Campaign Analytics
- 1.3. Service Analytics
- 1.4. Other Applications
-
2. End-User Vertical
- 2.1. Retail
- 2.2. BFSI
- 2.3. Government
- 2.4. IT and Telecom
- 2.5. Media and Entertainment
- 2.6. Other End-User Verticals
Mobile Analytics Software Industry Segmentation By Geography
- 1. North America
- 2. Europe
- 3. Asia Pacific
- 4. Rest of the World
Mobile Analytics Software Industry REPORT HIGHLIGHTS
| Aspects | Details |
|---|---|
| Study Period | 2019-2033 |
| Base Year | 2024 |
| Estimated Year | 2025 |
| Forecast Period | 2025-2033 |
| Historical Period | 2019-2024 |
| Growth Rate | CAGR of 24.20% from 2019-2033 |
| Segmentation |
|
Table of Contents
- 1. Introduction
- 1.1. Research Scope
- 1.2. Market Segmentation
- 1.3. Research Methodology
- 1.4. Definitions and Assumptions
- 2. Executive Summary
- 2.1. Introduction
- 3. Market Dynamics
- 3.1. Introduction
- 3.2. Market Drivers
- 3.2.1. Smartphone Revolution to Generate Enormous Data; Data Explosion from E- commerce Likely to Propel the Market
- 3.3. Market Restrains
- 3.3.1. Failure of the Widespread Adoption of 4G Services Due to Insufficient Users; Lack of Internet Penetration in Certain Areas
- 3.4. Market Trends
- 3.4.1. Retail Industry Holds Significant Market Share
- 4. Market Factor Analysis
- 4.1. Porters Five Forces
- 4.2. Supply/Value Chain
- 4.3. PESTEL analysis
- 4.4. Market Entropy
- 4.5. Patent/Trademark Analysis
- 5. Global Mobile Analytics Software Industry Analysis, Insights and Forecast, 2019-2031
- 5.1. Market Analysis, Insights and Forecast - by Type
- 5.1.1. Application Analytics
- 5.1.2. Campaign Analytics
- 5.1.3. Service Analytics
- 5.1.4. Other Applications
- 5.2. Market Analysis, Insights and Forecast - by End-User Vertical
- 5.2.1. Retail
- 5.2.2. BFSI
- 5.2.3. Government
- 5.2.4. IT and Telecom
- 5.2.5. Media and Entertainment
- 5.2.6. Other End-User Verticals
- 5.3. Market Analysis, Insights and Forecast - by Region
- 5.3.1. North America
- 5.3.2. Europe
- 5.3.3. Asia Pacific
- 5.3.4. Rest of the World
- 5.1. Market Analysis, Insights and Forecast - by Type
- 6. North America Mobile Analytics Software Industry Analysis, Insights and Forecast, 2019-2031
- 6.1. Market Analysis, Insights and Forecast - by Type
- 6.1.1. Application Analytics
- 6.1.2. Campaign Analytics
- 6.1.3. Service Analytics
- 6.1.4. Other Applications
- 6.2. Market Analysis, Insights and Forecast - by End-User Vertical
- 6.2.1. Retail
- 6.2.2. BFSI
- 6.2.3. Government
- 6.2.4. IT and Telecom
- 6.2.5. Media and Entertainment
- 6.2.6. Other End-User Verticals
- 6.1. Market Analysis, Insights and Forecast - by Type
- 7. Europe Mobile Analytics Software Industry Analysis, Insights and Forecast, 2019-2031
- 7.1. Market Analysis, Insights and Forecast - by Type
- 7.1.1. Application Analytics
- 7.1.2. Campaign Analytics
- 7.1.3. Service Analytics
- 7.1.4. Other Applications
- 7.2. Market Analysis, Insights and Forecast - by End-User Vertical
- 7.2.1. Retail
- 7.2.2. BFSI
- 7.2.3. Government
- 7.2.4. IT and Telecom
- 7.2.5. Media and Entertainment
- 7.2.6. Other End-User Verticals
- 7.1. Market Analysis, Insights and Forecast - by Type
- 8. Asia Pacific Mobile Analytics Software Industry Analysis, Insights and Forecast, 2019-2031
- 8.1. Market Analysis, Insights and Forecast - by Type
- 8.1.1. Application Analytics
- 8.1.2. Campaign Analytics
- 8.1.3. Service Analytics
- 8.1.4. Other Applications
- 8.2. Market Analysis, Insights and Forecast - by End-User Vertical
- 8.2.1. Retail
- 8.2.2. BFSI
- 8.2.3. Government
- 8.2.4. IT and Telecom
- 8.2.5. Media and Entertainment
- 8.2.6. Other End-User Verticals
- 8.1. Market Analysis, Insights and Forecast - by Type
- 9. Rest of the World Mobile Analytics Software Industry Analysis, Insights and Forecast, 2019-2031
- 9.1. Market Analysis, Insights and Forecast - by Type
- 9.1.1. Application Analytics
- 9.1.2. Campaign Analytics
- 9.1.3. Service Analytics
- 9.1.4. Other Applications
- 9.2. Market Analysis, Insights and Forecast - by End-User Vertical
- 9.2.1. Retail
- 9.2.2. BFSI
- 9.2.3. Government
- 9.2.4. IT and Telecom
- 9.2.5. Media and Entertainment
- 9.2.6. Other End-User Verticals
- 9.1. Market Analysis, Insights and Forecast - by Type
- 10. North America Mobile Analytics Software Industry Analysis, Insights and Forecast, 2019-2031
- 10.1. Market Analysis, Insights and Forecast - By Country/Sub-region
- 10.1.1.
- 11. Europe Mobile Analytics Software Industry Analysis, Insights and Forecast, 2019-2031
- 11.1. Market Analysis, Insights and Forecast - By Country/Sub-region
- 11.1.1.
- 12. Asia Pacific Mobile Analytics Software Industry Analysis, Insights and Forecast, 2019-2031
- 12.1. Market Analysis, Insights and Forecast - By Country/Sub-region
- 12.1.1.
- 13. Rest of the World Mobile Analytics Software Industry Analysis, Insights and Forecast, 2019-2031
- 13.1. Market Analysis, Insights and Forecast - By Country/Sub-region
- 13.1.1.
- 14. Competitive Analysis
- 14.1. Global Market Share Analysis 2024
- 14.2. Company Profiles
- 14.2.1 Contentsquare SaaS
- 14.2.1.1. Overview
- 14.2.1.2. Products
- 14.2.1.3. SWOT Analysis
- 14.2.1.4. Recent Developments
- 14.2.1.5. Financials (Based on Availability)
- 14.2.2 OpenText Corporation
- 14.2.2.1. Overview
- 14.2.2.2. Products
- 14.2.2.3. SWOT Analysis
- 14.2.2.4. Recent Developments
- 14.2.2.5. Financials (Based on Availability)
- 14.2.3 Google LLC
- 14.2.3.1. Overview
- 14.2.3.2. Products
- 14.2.3.3. SWOT Analysis
- 14.2.3.4. Recent Developments
- 14.2.3.5. Financials (Based on Availability)
- 14.2.4 AppsFlyer Ltd*List Not Exhaustive
- 14.2.4.1. Overview
- 14.2.4.2. Products
- 14.2.4.3. SWOT Analysis
- 14.2.4.4. Recent Developments
- 14.2.4.5. Financials (Based on Availability)
- 14.2.5 GoodData Corporation
- 14.2.5.1. Overview
- 14.2.5.2. Products
- 14.2.5.3. SWOT Analysis
- 14.2.5.4. Recent Developments
- 14.2.5.5. Financials (Based on Availability)
- 14.2.6 Salesforce com Inc
- 14.2.6.1. Overview
- 14.2.6.2. Products
- 14.2.6.3. SWOT Analysis
- 14.2.6.4. Recent Developments
- 14.2.6.5. Financials (Based on Availability)
- 14.2.7 Microsoft Corporation
- 14.2.7.1. Overview
- 14.2.7.2. Products
- 14.2.7.3. SWOT Analysis
- 14.2.7.4. Recent Developments
- 14.2.7.5. Financials (Based on Availability)
- 14.2.8 Adobe Inc
- 14.2.8.1. Overview
- 14.2.8.2. Products
- 14.2.8.3. SWOT Analysis
- 14.2.8.4. Recent Developments
- 14.2.8.5. Financials (Based on Availability)
- 14.2.9 Oracle Corp
- 14.2.9.1. Overview
- 14.2.9.2. Products
- 14.2.9.3. SWOT Analysis
- 14.2.9.4. Recent Developments
- 14.2.9.5. Financials (Based on Availability)
- 14.2.10 Facebook Inc
- 14.2.10.1. Overview
- 14.2.10.2. Products
- 14.2.10.3. SWOT Analysis
- 14.2.10.4. Recent Developments
- 14.2.10.5. Financials (Based on Availability)
- 14.2.1 Contentsquare SaaS
List of Figures
- Figure 1: Global Mobile Analytics Software Industry Revenue Breakdown (Million, %) by Region 2024 & 2032
- Figure 2: North America Mobile Analytics Software Industry Revenue (Million), by Country 2024 & 2032
- Figure 3: North America Mobile Analytics Software Industry Revenue Share (%), by Country 2024 & 2032
- Figure 4: Europe Mobile Analytics Software Industry Revenue (Million), by Country 2024 & 2032
- Figure 5: Europe Mobile Analytics Software Industry Revenue Share (%), by Country 2024 & 2032
- Figure 6: Asia Pacific Mobile Analytics Software Industry Revenue (Million), by Country 2024 & 2032
- Figure 7: Asia Pacific Mobile Analytics Software Industry Revenue Share (%), by Country 2024 & 2032
- Figure 8: Rest of the World Mobile Analytics Software Industry Revenue (Million), by Country 2024 & 2032
- Figure 9: Rest of the World Mobile Analytics Software Industry Revenue Share (%), by Country 2024 & 2032
- Figure 10: North America Mobile Analytics Software Industry Revenue (Million), by Type 2024 & 2032
- Figure 11: North America Mobile Analytics Software Industry Revenue Share (%), by Type 2024 & 2032
- Figure 12: North America Mobile Analytics Software Industry Revenue (Million), by End-User Vertical 2024 & 2032
- Figure 13: North America Mobile Analytics Software Industry Revenue Share (%), by End-User Vertical 2024 & 2032
- Figure 14: North America Mobile Analytics Software Industry Revenue (Million), by Country 2024 & 2032
- Figure 15: North America Mobile Analytics Software Industry Revenue Share (%), by Country 2024 & 2032
- Figure 16: Europe Mobile Analytics Software Industry Revenue (Million), by Type 2024 & 2032
- Figure 17: Europe Mobile Analytics Software Industry Revenue Share (%), by Type 2024 & 2032
- Figure 18: Europe Mobile Analytics Software Industry Revenue (Million), by End-User Vertical 2024 & 2032
- Figure 19: Europe Mobile Analytics Software Industry Revenue Share (%), by End-User Vertical 2024 & 2032
- Figure 20: Europe Mobile Analytics Software Industry Revenue (Million), by Country 2024 & 2032
- Figure 21: Europe Mobile Analytics Software Industry Revenue Share (%), by Country 2024 & 2032
- Figure 22: Asia Pacific Mobile Analytics Software Industry Revenue (Million), by Type 2024 & 2032
- Figure 23: Asia Pacific Mobile Analytics Software Industry Revenue Share (%), by Type 2024 & 2032
- Figure 24: Asia Pacific Mobile Analytics Software Industry Revenue (Million), by End-User Vertical 2024 & 2032
- Figure 25: Asia Pacific Mobile Analytics Software Industry Revenue Share (%), by End-User Vertical 2024 & 2032
- Figure 26: Asia Pacific Mobile Analytics Software Industry Revenue (Million), by Country 2024 & 2032
- Figure 27: Asia Pacific Mobile Analytics Software Industry Revenue Share (%), by Country 2024 & 2032
- Figure 28: Rest of the World Mobile Analytics Software Industry Revenue (Million), by Type 2024 & 2032
- Figure 29: Rest of the World Mobile Analytics Software Industry Revenue Share (%), by Type 2024 & 2032
- Figure 30: Rest of the World Mobile Analytics Software Industry Revenue (Million), by End-User Vertical 2024 & 2032
- Figure 31: Rest of the World Mobile Analytics Software Industry Revenue Share (%), by End-User Vertical 2024 & 2032
- Figure 32: Rest of the World Mobile Analytics Software Industry Revenue (Million), by Country 2024 & 2032
- Figure 33: Rest of the World Mobile Analytics Software Industry Revenue Share (%), by Country 2024 & 2032
List of Tables
- Table 1: Global Mobile Analytics Software Industry Revenue Million Forecast, by Region 2019 & 2032
- Table 2: Global Mobile Analytics Software Industry Revenue Million Forecast, by Type 2019 & 2032
- Table 3: Global Mobile Analytics Software Industry Revenue Million Forecast, by End-User Vertical 2019 & 2032
- Table 4: Global Mobile Analytics Software Industry Revenue Million Forecast, by Region 2019 & 2032
- Table 5: Global Mobile Analytics Software Industry Revenue Million Forecast, by Country 2019 & 2032
- Table 6: Mobile Analytics Software Industry Revenue (Million) Forecast, by Application 2019 & 2032
- Table 7: Global Mobile Analytics Software Industry Revenue Million Forecast, by Country 2019 & 2032
- Table 8: Mobile Analytics Software Industry Revenue (Million) Forecast, by Application 2019 & 2032
- Table 9: Global Mobile Analytics Software Industry Revenue Million Forecast, by Country 2019 & 2032
- Table 10: Mobile Analytics Software Industry Revenue (Million) Forecast, by Application 2019 & 2032
- Table 11: Global Mobile Analytics Software Industry Revenue Million Forecast, by Country 2019 & 2032
- Table 12: Mobile Analytics Software Industry Revenue (Million) Forecast, by Application 2019 & 2032
- Table 13: Global Mobile Analytics Software Industry Revenue Million Forecast, by Type 2019 & 2032
- Table 14: Global Mobile Analytics Software Industry Revenue Million Forecast, by End-User Vertical 2019 & 2032
- Table 15: Global Mobile Analytics Software Industry Revenue Million Forecast, by Country 2019 & 2032
- Table 16: Global Mobile Analytics Software Industry Revenue Million Forecast, by Type 2019 & 2032
- Table 17: Global Mobile Analytics Software Industry Revenue Million Forecast, by End-User Vertical 2019 & 2032
- Table 18: Global Mobile Analytics Software Industry Revenue Million Forecast, by Country 2019 & 2032
- Table 19: Global Mobile Analytics Software Industry Revenue Million Forecast, by Type 2019 & 2032
- Table 20: Global Mobile Analytics Software Industry Revenue Million Forecast, by End-User Vertical 2019 & 2032
- Table 21: Global Mobile Analytics Software Industry Revenue Million Forecast, by Country 2019 & 2032
- Table 22: Global Mobile Analytics Software Industry Revenue Million Forecast, by Type 2019 & 2032
- Table 23: Global Mobile Analytics Software Industry Revenue Million Forecast, by End-User Vertical 2019 & 2032
- Table 24: Global Mobile Analytics Software Industry Revenue Million Forecast, by Country 2019 & 2032
Frequently Asked Questions
1. What is the projected Compound Annual Growth Rate (CAGR) of the Mobile Analytics Software Industry?
The projected CAGR is approximately 24.20%.
2. Which companies are prominent players in the Mobile Analytics Software Industry?
Key companies in the market include Contentsquare SaaS, OpenText Corporation, Google LLC, AppsFlyer Ltd*List Not Exhaustive, GoodData Corporation, Salesforce com Inc, Microsoft Corporation, Adobe Inc, Oracle Corp, Facebook Inc.
3. What are the main segments of the Mobile Analytics Software Industry?
The market segments include Type, End-User Vertical.
4. Can you provide details about the market size?
The market size is estimated to be USD 7.29 Million as of 2022.
5. What are some drivers contributing to market growth?
Smartphone Revolution to Generate Enormous Data; Data Explosion from E- commerce Likely to Propel the Market.
6. What are the notable trends driving market growth?
Retail Industry Holds Significant Market Share.
7. Are there any restraints impacting market growth?
Failure of the Widespread Adoption of 4G Services Due to Insufficient Users; Lack of Internet Penetration in Certain Areas.
8. Can you provide examples of recent developments in the market?
February 2022 - IronSource has announced a new app analytics tool to help app and game creators increase revenue, customer retention, and growth. IronSource is offering a one-stop solution for app monetization, user recruitment, and analytics with the beta edition of App Analytics. Analytics has grown in popularity, as have platforms and techniques for success in mobile apps and games. IronSource claims that the app analytics platform's usability (UX) is far superior to most other alternatives.
9. What pricing options are available for accessing the report?
Pricing options include single-user, multi-user, and enterprise licenses priced at USD 4750, USD 5250, and USD 8750 respectively.
10. Is the market size provided in terms of value or volume?
The market size is provided in terms of value, measured in Million.
11. Are there any specific market keywords associated with the report?
Yes, the market keyword associated with the report is "Mobile Analytics Software Industry," which aids in identifying and referencing the specific market segment covered.
12. How do I determine which pricing option suits my needs best?
The pricing options vary based on user requirements and access needs. Individual users may opt for single-user licenses, while businesses requiring broader access may choose multi-user or enterprise licenses for cost-effective access to the report.
13. Are there any additional resources or data provided in the Mobile Analytics Software Industry report?
While the report offers comprehensive insights, it's advisable to review the specific contents or supplementary materials provided to ascertain if additional resources or data are available.
14. How can I stay updated on further developments or reports in the Mobile Analytics Software Industry?
To stay informed about further developments, trends, and reports in the Mobile Analytics Software Industry, consider subscribing to industry newsletters, following relevant companies and organizations, or regularly checking reputable industry news sources and publications.
Methodology
Step 1 - Identification of Relevant Samples Size from Population Database


Step 2 - Approaches for Defining Global Market Size (Value, Volume* & Price*)

Note*: In applicable scenarios
Step 3 - Data Sources
Primary Research
- Web Analytics
- Survey Reports
- Research Institute
- Latest Research Reports
- Opinion Leaders
Secondary Research
- Annual Reports
- White Paper
- Latest Press Release
- Industry Association
- Paid Database
- Investor Presentations

Step 4 - Data Triangulation
Involves using different sources of information in order to increase the validity of a study
These sources are likely to be stakeholders in a program - participants, other researchers, program staff, other community members, and so on.
Then we put all data in single framework & apply various statistical tools to find out the dynamic on the market.
During the analysis stage, feedback from the stakeholder groups would be compared to determine areas of agreement as well as areas of divergence
