

Key Insights
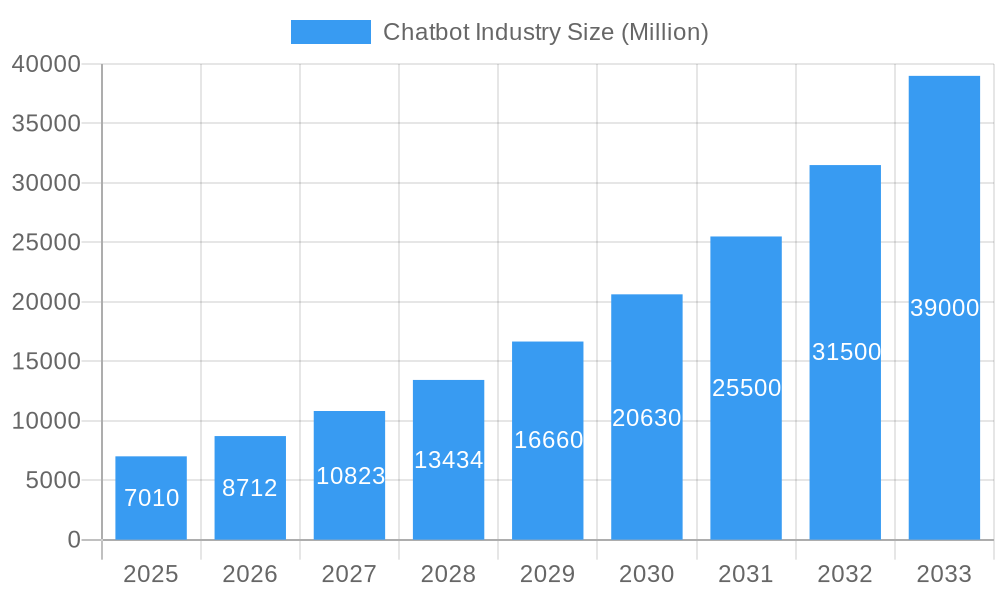
The global chatbot market, valued at $7.01 billion in 2025, is experiencing robust growth, projected to expand at a compound annual growth rate (CAGR) of 24.32% from 2025 to 2033. This surge is driven by several key factors. The increasing adoption of artificial intelligence (AI) across various industries, including BFSI (Banking, Financial Services, and Insurance), healthcare, and retail, is a primary driver. Businesses are leveraging chatbots to automate customer service, improve operational efficiency, and enhance the overall customer experience. The rising demand for personalized and 24/7 customer support fuels the market's expansion. Furthermore, advancements in natural language processing (NLP) and machine learning (ML) technologies are enabling the development of more sophisticated and human-like chatbots, leading to increased user adoption and satisfaction. The integration of chatbots with other communication channels, such as messaging apps and social media platforms, is further broadening their reach and utility.
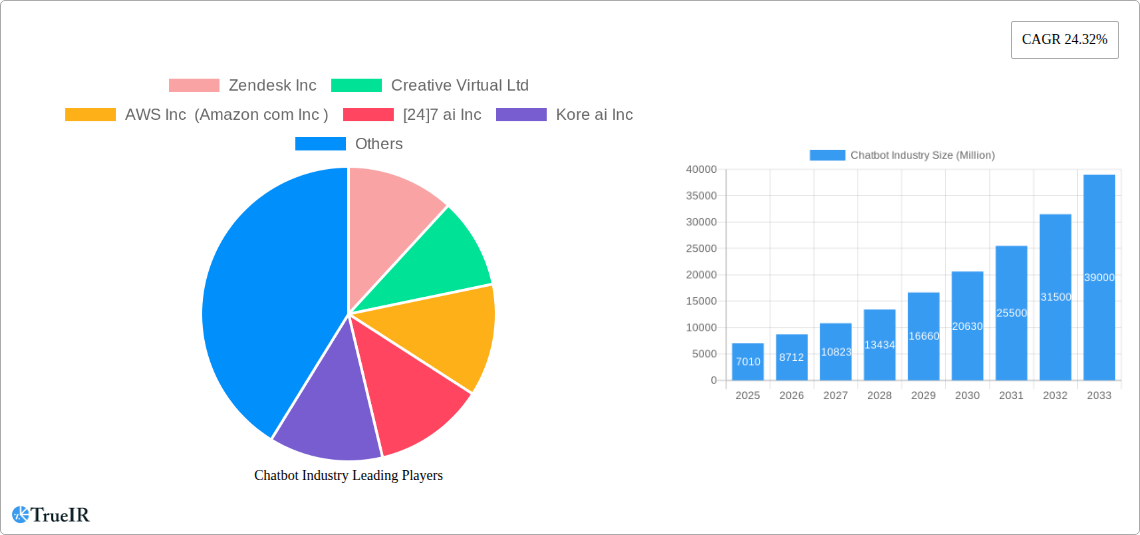
Chatbot Industry Market Size (In Billion)
However, certain challenges remain. Data security and privacy concerns associated with the collection and use of customer data represent significant restraints. The high initial investment costs associated with chatbot implementation and maintenance can deter smaller businesses. Additionally, ensuring the accuracy and consistency of chatbot responses, particularly in complex or nuanced situations, continues to pose a challenge. Despite these restraints, the market's positive trajectory is undeniable, fueled by ongoing technological advancements and increasing adoption across diverse sectors. The market segmentation by end-user vertical reflects the widespread application of chatbots, with BFSI and healthcare showing particularly strong growth due to their need for efficient and scalable customer service solutions. Leading companies like Zendesk, Amazon Web Services (AWS), and others are actively innovating and competing within this dynamic and rapidly evolving market landscape.
Chatbot Industry Company Market Share
Dynamic Chatbot Industry Market Report: 2019-2033
This comprehensive report provides a detailed analysis of the chatbot industry, forecasting robust growth and exploring key market trends from 2019 to 2033. Leveraging extensive data and expert insights, this report is an essential resource for businesses, investors, and researchers seeking to understand and capitalize on opportunities within this rapidly evolving sector. The report projects a market valuation exceeding $XX Million by 2033, representing a significant CAGR.
Chatbot Industry Market Structure & Competitive Landscape
The chatbot market exhibits a moderately concentrated structure, with several major players commanding significant market share. However, the landscape is dynamic, characterized by continuous innovation, strategic mergers and acquisitions (M&A), and the emergence of new entrants. The market concentration ratio (CR4) is estimated at xx%, indicating a moderately consolidated market. Innovation drivers include advancements in natural language processing (NLP), machine learning (ML), and artificial intelligence (AI), leading to increasingly sophisticated and human-like chatbot capabilities. Regulatory impacts vary by region, with data privacy regulations like GDPR significantly influencing development and deployment strategies. Product substitutes include traditional customer service channels like phone and email, but chatbots offer cost-effectiveness and scalability advantages. The end-user segmentation is diverse, spanning various verticals including BFSI, healthcare, retail, and more. M&A activity has been significant, with approximately xx major deals recorded between 2019 and 2024, reflecting industry consolidation and expansion efforts.
- Market Concentration: CR4 estimated at xx%
- Key Innovation Drivers: NLP, ML, AI advancements
- Regulatory Impacts: GDPR, CCPA, and regional variations
- Product Substitutes: Phone, email support
- End-User Segmentation: BFSI, Healthcare, IT & Telecom, Retail, Travel & Hospitality, Others
- M&A Activity: Approximately xx major deals (2019-2024)
Chatbot Industry Market Trends & Opportunities
The chatbot market is experiencing explosive growth, driven by several key factors. Market size is projected to reach $XX Million by 2025 and $XX Million by 2033, reflecting a robust CAGR of xx%. Technological advancements, particularly in AI and NLP, are enabling increasingly sophisticated chatbot functionalities, enhancing user experience and expanding applications across industries. Consumer preferences increasingly favor convenient and readily available customer service channels, boosting chatbot adoption. Competitive dynamics are intense, with both established players and new entrants vying for market share through product innovation, strategic partnerships, and aggressive pricing strategies. Market penetration rates are rising steadily, particularly in sectors such as e-commerce and customer service. The market presents significant opportunities for companies offering advanced chatbot solutions with seamless integration capabilities and tailored features.
Dominant Markets & Segments in Chatbot Industry
The BFSI (Banking, Financial Services, and Insurance) sector currently represents the largest segment, driven by the need for automated customer support and streamlined processes. The North American region dominates the market in terms of revenue, owing to high technology adoption rates and the presence of key players.
- Key Growth Drivers (BFSI):
- Increasing demand for 24/7 customer support
- Cost reduction initiatives
- Improved operational efficiency
- Enhanced customer experience through personalized interactions
- Key Growth Drivers (North America):
- High technology adoption rates
- Presence of major chatbot vendors
- Robust investment in AI and related technologies
- Favorable regulatory environment
Other significant segments include healthcare (driven by increasing demand for telehealth and remote patient monitoring) and retail (driven by the need for enhanced customer engagement and personalized shopping experiences). The Asia-Pacific region exhibits significant growth potential due to increasing digitalization and the expanding adoption of chatbots across industries.
Chatbot Industry Product Analysis
Chatbot products range from simple rule-based systems to sophisticated AI-powered platforms capable of natural language understanding and contextual awareness. Key advancements include improved NLP, personalized user experiences, and seamless integration with existing CRM and customer service systems. Competitive advantages stem from superior AI capabilities, ease of integration, and specialized industry solutions. The market is witnessing a shift towards cloud-based chatbot solutions due to their scalability, cost-effectiveness, and ease of deployment.
Key Drivers, Barriers & Challenges in Chatbot Industry
Key Drivers:
- Advancements in AI and NLP are enabling more sophisticated and human-like interactions.
- Increasing demand for 24/7 customer support across various industries.
- Growing adoption of cloud-based solutions for increased scalability and cost-effectiveness.
- Government initiatives promoting digital transformation and AI adoption.
Challenges:
- High initial implementation costs can deter smaller businesses.
- Ensuring data privacy and security remains a significant concern.
- Maintaining accuracy and consistency in chatbot responses requires ongoing training and refinement.
- Competition is intense, requiring continuous innovation to stay ahead of the curve. This leads to a price war affecting smaller players.
Growth Drivers in the Chatbot Industry Market
Technological advancements, particularly in AI and NLP, are the primary driver, enabling more sophisticated, contextually aware interactions. Increased demand for 24/7 customer support fuels adoption across industries. Cloud-based deployments offer scalability and reduced costs, boosting growth. Government initiatives supporting digitalization create favorable market conditions.
Challenges Impacting Chatbot Industry Growth
High initial investment costs, data security concerns, and the need for continuous maintenance and training present significant hurdles. Intense competition and the potential for inaccurate or inconsistent responses pose ongoing challenges. Regulatory complexities around data privacy also impact growth.
Key Players Shaping the Chatbot Industry Market
- Zendesk Inc
- Creative Virtual Ltd
- AWS Inc (Amazon com Inc)
- [24]7 ai Inc
- Kore ai Inc
- LiveChat Inc
- IBM Corporation
- Nuance Communications Inc (Microsoft Corp)
- Artificial Solutions International AB
- Inbenta Holdings Inc
- Avaamo Inc
- Amelia US LLC (Ipsoft Inc)
- Egain Corporation
- Serviceaide Inc
- Dialogflow (Google)
- EdgeVerve Systems Limited
Significant Chatbot Industry Milestones
- March 2023: Nuance launched Nuance Mix Answers with GPT-powered functionality, enhancing Microsoft's Digital Contact Centre Platform.
- April 2023: Kore.ai integrated its AgentAssist with Zendesk, expanding Zendesk's capabilities across digital channels.
Future Outlook for Chatbot Industry Market
The chatbot market is poised for continued expansion, driven by ongoing technological advancements, rising demand for automated customer service, and increasing adoption across diverse industries. Strategic partnerships and acquisitions will continue to shape the market landscape. The integration of chatbots with other technologies such as IoT and blockchain will unlock new opportunities and further fuel market growth. The market is projected to exceed $XX Million by 2033, with significant growth potential in emerging markets.
Chatbot Industry Segmentation
-
1. End-user Vertical
- 1.1. BFSI
- 1.2. Healthcare
- 1.3. IT and Telecommunication
- 1.4. Retail
- 1.5. Travel and Hospitality
- 1.6. Other End-user Verticals
Chatbot Industry Segmentation By Geography
- 1. North America
- 2. Europe
- 3. Asia
- 4. Australia and New Zealand
- 5. Latin America
- 6. Middle East and Africa
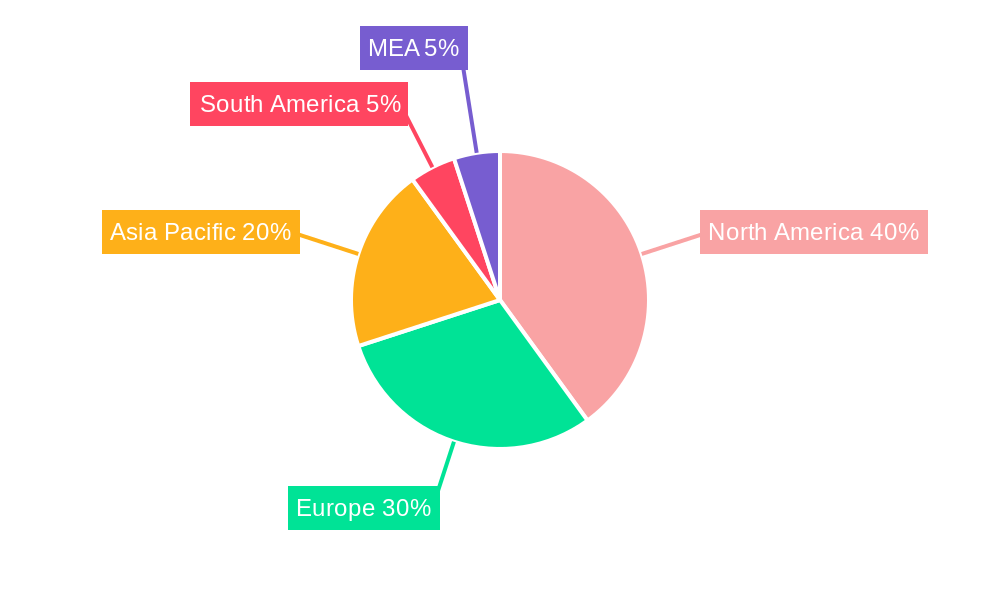
Chatbot Industry Regional Market Share
Geographic Coverage of Chatbot Industry
Chatbot Industry REPORT HIGHLIGHTS
| Aspects | Details |
|---|---|
| Study Period | 2020-2034 |
| Base Year | 2025 |
| Estimated Year | 2026 |
| Forecast Period | 2026-2034 |
| Historical Period | 2020-2025 |
| Growth Rate | CAGR of 24.32% from 2020-2034 |
| Segmentation |
|
Table of Contents
- 1. Introduction
- 1.1. Research Scope
- 1.2. Market Segmentation
- 1.3. Research Objective
- 1.4. Definitions and Assumptions
- 2. Executive Summary
- 2.1. Market Snapshot
- 3. Market Dynamics
- 3.1. Market Drivers
- 3.2. Market Restrains
- 3.3. Market Trends
- 3.4. Market Opportunities
- 4. Market Factor Analysis
- 4.1. Porters Five Forces
- 4.1.1. Bargaining Power of Suppliers
- 4.1.2. Bargaining Power of Buyers
- 4.1.3. Threat of New Entrants
- 4.1.4. Threat of Substitutes
- 4.1.5. Competitive Rivalry
- 4.2. PESTEL analysis
- 4.3. BCG Analysis
- 4.3.1. Stars (High Growth, High Market Share)
- 4.3.2. Cash Cows (Low Growth, High Market Share)
- 4.3.3. Question Mark (High Growth, Low Market Share)
- 4.3.4. Dogs (Low Growth, Low Market Share)
- 4.4. Ansoff Matrix Analysis
- 4.5. Supply Chain Analysis
- 4.6. Regulatory Landscape
- 4.7. Current Market Potential and Opportunity Assessment (TAM–SAM–SOM Framework)
- 4.8. TIR Analyst Note
- 4.1. Porters Five Forces
- 5. Market Analysis, Insights and Forecast 2021-2033
- 5.1. Market Analysis, Insights and Forecast - by End-user Vertical
- 5.1.1. BFSI
- 5.1.2. Healthcare
- 5.1.3. IT and Telecommunication
- 5.1.4. Retail
- 5.1.5. Travel and Hospitality
- 5.1.6. Other End-user Verticals
- 5.2. Market Analysis, Insights and Forecast - by Region
- 5.2.1. North America
- 5.2.2. Europe
- 5.2.3. Asia
- 5.2.4. Australia and New Zealand
- 5.2.5. Latin America
- 5.2.6. Middle East and Africa
- 5.1. Market Analysis, Insights and Forecast - by End-user Vertical
- 6. Global Chatbot Industry Analysis, Insights and Forecast, 2021-2033
- 6.1. Market Analysis, Insights and Forecast - by End-user Vertical
- 6.1.1. BFSI
- 6.1.2. Healthcare
- 6.1.3. IT and Telecommunication
- 6.1.4. Retail
- 6.1.5. Travel and Hospitality
- 6.1.6. Other End-user Verticals
- 6.1. Market Analysis, Insights and Forecast - by End-user Vertical
- 7. North America Chatbot Industry Analysis, Insights and Forecast, 2020-2032
- 7.1. Market Analysis, Insights and Forecast - by End-user Vertical
- 7.1.1. BFSI
- 7.1.2. Healthcare
- 7.1.3. IT and Telecommunication
- 7.1.4. Retail
- 7.1.5. Travel and Hospitality
- 7.1.6. Other End-user Verticals
- 7.1. Market Analysis, Insights and Forecast - by End-user Vertical
- 8. Europe Chatbot Industry Analysis, Insights and Forecast, 2020-2032
- 8.1. Market Analysis, Insights and Forecast - by End-user Vertical
- 8.1.1. BFSI
- 8.1.2. Healthcare
- 8.1.3. IT and Telecommunication
- 8.1.4. Retail
- 8.1.5. Travel and Hospitality
- 8.1.6. Other End-user Verticals
- 8.1. Market Analysis, Insights and Forecast - by End-user Vertical
- 9. Asia Chatbot Industry Analysis, Insights and Forecast, 2020-2032
- 9.1. Market Analysis, Insights and Forecast - by End-user Vertical
- 9.1.1. BFSI
- 9.1.2. Healthcare
- 9.1.3. IT and Telecommunication
- 9.1.4. Retail
- 9.1.5. Travel and Hospitality
- 9.1.6. Other End-user Verticals
- 9.1. Market Analysis, Insights and Forecast - by End-user Vertical
- 10. Australia and New Zealand Chatbot Industry Analysis, Insights and Forecast, 2020-2032
- 10.1. Market Analysis, Insights and Forecast - by End-user Vertical
- 10.1.1. BFSI
- 10.1.2. Healthcare
- 10.1.3. IT and Telecommunication
- 10.1.4. Retail
- 10.1.5. Travel and Hospitality
- 10.1.6. Other End-user Verticals
- 10.1. Market Analysis, Insights and Forecast - by End-user Vertical
- 11. Latin America Chatbot Industry Analysis, Insights and Forecast, 2020-2032
- 11.1. Market Analysis, Insights and Forecast - by End-user Vertical
- 11.1.1. BFSI
- 11.1.2. Healthcare
- 11.1.3. IT and Telecommunication
- 11.1.4. Retail
- 11.1.5. Travel and Hospitality
- 11.1.6. Other End-user Verticals
- 11.1. Market Analysis, Insights and Forecast - by End-user Vertical
- 12. Middle East and Africa Chatbot Industry Analysis, Insights and Forecast, 2020-2032
- 12.1. Market Analysis, Insights and Forecast - by End-user Vertical
- 12.1.1. BFSI
- 12.1.2. Healthcare
- 12.1.3. IT and Telecommunication
- 12.1.4. Retail
- 12.1.5. Travel and Hospitality
- 12.1.6. Other End-user Verticals
- 12.1. Market Analysis, Insights and Forecast - by End-user Vertical
- 13. Competitive Analysis
- 13.1. Company Profiles
- 13.1.1 Zendesk Inc
- 13.1.1.1. Company Overview
- 13.1.1.2. Products
- 13.1.1.3. Company Financials
- 13.1.1.4. SWOT Analysis
- 13.1.2 Creative Virtual Ltd
- 13.1.2.1. Company Overview
- 13.1.2.2. Products
- 13.1.2.3. Company Financials
- 13.1.2.4. SWOT Analysis
- 13.1.3 AWS Inc (Amazon com Inc )
- 13.1.3.1. Company Overview
- 13.1.3.2. Products
- 13.1.3.3. Company Financials
- 13.1.3.4. SWOT Analysis
- 13.1.4 [24]7 ai Inc
- 13.1.4.1. Company Overview
- 13.1.4.2. Products
- 13.1.4.3. Company Financials
- 13.1.4.4. SWOT Analysis
- 13.1.5 Kore ai Inc
- 13.1.5.1. Company Overview
- 13.1.5.2. Products
- 13.1.5.3. Company Financials
- 13.1.5.4. SWOT Analysis
- 13.1.6 LiveChat Inc *List Not Exhaustive
- 13.1.6.1. Company Overview
- 13.1.6.2. Products
- 13.1.6.3. Company Financials
- 13.1.6.4. SWOT Analysis
- 13.1.7 IBM Corporation
- 13.1.7.1. Company Overview
- 13.1.7.2. Products
- 13.1.7.3. Company Financials
- 13.1.7.4. SWOT Analysis
- 13.1.8 Nuance Communications Inc (Microsoft Corp )
- 13.1.8.1. Company Overview
- 13.1.8.2. Products
- 13.1.8.3. Company Financials
- 13.1.8.4. SWOT Analysis
- 13.1.9 Artificial Solutions International AB
- 13.1.9.1. Company Overview
- 13.1.9.2. Products
- 13.1.9.3. Company Financials
- 13.1.9.4. SWOT Analysis
- 13.1.10 Inbenta Holdings Inc
- 13.1.10.1. Company Overview
- 13.1.10.2. Products
- 13.1.10.3. Company Financials
- 13.1.10.4. SWOT Analysis
- 13.1.11 Avaamo Inc
- 13.1.11.1. Company Overview
- 13.1.11.2. Products
- 13.1.11.3. Company Financials
- 13.1.11.4. SWOT Analysis
- 13.1.12 Amelia US LLC (Ipsoft Inc )
- 13.1.12.1. Company Overview
- 13.1.12.2. Products
- 13.1.12.3. Company Financials
- 13.1.12.4. SWOT Analysis
- 13.1.13 Egain Corporation
- 13.1.13.1. Company Overview
- 13.1.13.2. Products
- 13.1.13.3. Company Financials
- 13.1.13.4. SWOT Analysis
- 13.1.14 Serviceaide Inc
- 13.1.14.1. Company Overview
- 13.1.14.2. Products
- 13.1.14.3. Company Financials
- 13.1.14.4. SWOT Analysis
- 13.1.15 Dialogflow (Google)
- 13.1.15.1. Company Overview
- 13.1.15.2. Products
- 13.1.15.3. Company Financials
- 13.1.15.4. SWOT Analysis
- 13.1.16 EdgeVerve Systems Limited
- 13.1.16.1. Company Overview
- 13.1.16.2. Products
- 13.1.16.3. Company Financials
- 13.1.16.4. SWOT Analysis
- 13.1.1 Zendesk Inc
- 13.2. Market Entropy
- 13.2.1 Company's Key Areas Served
- 13.2.2 Recent Developments
- 13.3. Company Market Share Analysis 2025
- 13.3.1 Top 5 Companies Market Share Analysis
- 13.3.2 Top 3 Companies Market Share Analysis
- 13.4. List of Potential Customers
- 14. Research Methodology
List of Figures
- Figure 1: Global Chatbot Industry Revenue Breakdown (Million, %) by Region 2025 & 2033
- Figure 2: North America Chatbot Industry Revenue (Million), by End-user Vertical 2025 & 2033
- Figure 3: North America Chatbot Industry Revenue Share (%), by End-user Vertical 2025 & 2033
- Figure 4: North America Chatbot Industry Revenue (Million), by Country 2025 & 2033
- Figure 5: North America Chatbot Industry Revenue Share (%), by Country 2025 & 2033
- Figure 6: Europe Chatbot Industry Revenue (Million), by End-user Vertical 2025 & 2033
- Figure 7: Europe Chatbot Industry Revenue Share (%), by End-user Vertical 2025 & 2033
- Figure 8: Europe Chatbot Industry Revenue (Million), by Country 2025 & 2033
- Figure 9: Europe Chatbot Industry Revenue Share (%), by Country 2025 & 2033
- Figure 10: Asia Chatbot Industry Revenue (Million), by End-user Vertical 2025 & 2033
- Figure 11: Asia Chatbot Industry Revenue Share (%), by End-user Vertical 2025 & 2033
- Figure 12: Asia Chatbot Industry Revenue (Million), by Country 2025 & 2033
- Figure 13: Asia Chatbot Industry Revenue Share (%), by Country 2025 & 2033
- Figure 14: Australia and New Zealand Chatbot Industry Revenue (Million), by End-user Vertical 2025 & 2033
- Figure 15: Australia and New Zealand Chatbot Industry Revenue Share (%), by End-user Vertical 2025 & 2033
- Figure 16: Australia and New Zealand Chatbot Industry Revenue (Million), by Country 2025 & 2033
- Figure 17: Australia and New Zealand Chatbot Industry Revenue Share (%), by Country 2025 & 2033
- Figure 18: Latin America Chatbot Industry Revenue (Million), by End-user Vertical 2025 & 2033
- Figure 19: Latin America Chatbot Industry Revenue Share (%), by End-user Vertical 2025 & 2033
- Figure 20: Latin America Chatbot Industry Revenue (Million), by Country 2025 & 2033
- Figure 21: Latin America Chatbot Industry Revenue Share (%), by Country 2025 & 2033
- Figure 22: Middle East and Africa Chatbot Industry Revenue (Million), by End-user Vertical 2025 & 2033
- Figure 23: Middle East and Africa Chatbot Industry Revenue Share (%), by End-user Vertical 2025 & 2033
- Figure 24: Middle East and Africa Chatbot Industry Revenue (Million), by Country 2025 & 2033
- Figure 25: Middle East and Africa Chatbot Industry Revenue Share (%), by Country 2025 & 2033
List of Tables
- Table 1: Global Chatbot Industry Revenue Million Forecast, by End-user Vertical 2020 & 2033
- Table 2: Global Chatbot Industry Revenue Million Forecast, by Region 2020 & 2033
- Table 3: Global Chatbot Industry Revenue Million Forecast, by End-user Vertical 2020 & 2033
- Table 4: Global Chatbot Industry Revenue Million Forecast, by Country 2020 & 2033
- Table 5: Global Chatbot Industry Revenue Million Forecast, by End-user Vertical 2020 & 2033
- Table 6: Global Chatbot Industry Revenue Million Forecast, by Country 2020 & 2033
- Table 7: Global Chatbot Industry Revenue Million Forecast, by End-user Vertical 2020 & 2033
- Table 8: Global Chatbot Industry Revenue Million Forecast, by Country 2020 & 2033
- Table 9: Global Chatbot Industry Revenue Million Forecast, by End-user Vertical 2020 & 2033
- Table 10: Global Chatbot Industry Revenue Million Forecast, by Country 2020 & 2033
- Table 11: Global Chatbot Industry Revenue Million Forecast, by End-user Vertical 2020 & 2033
- Table 12: Global Chatbot Industry Revenue Million Forecast, by Country 2020 & 2033
- Table 13: Global Chatbot Industry Revenue Million Forecast, by End-user Vertical 2020 & 2033
- Table 14: Global Chatbot Industry Revenue Million Forecast, by Country 2020 & 2033
Frequently Asked Questions
1. What is the projected Compound Annual Growth Rate (CAGR) of the Chatbot Industry?
The projected CAGR is approximately 24.32%.
2. Which companies are prominent players in the Chatbot Industry?
Key companies in the market include Zendesk Inc, Creative Virtual Ltd, AWS Inc (Amazon com Inc ), [24]7 ai Inc, Kore ai Inc, LiveChat Inc *List Not Exhaustive, IBM Corporation, Nuance Communications Inc (Microsoft Corp ), Artificial Solutions International AB, Inbenta Holdings Inc, Avaamo Inc, Amelia US LLC (Ipsoft Inc ), Egain Corporation, Serviceaide Inc, Dialogflow (Google), EdgeVerve Systems Limited.
3. What are the main segments of the Chatbot Industry?
The market segments include End-user Vertical.
4. Can you provide details about the market size?
The market size is estimated to be USD 7.01 Million as of 2022.
5. What are some drivers contributing to market growth?
Rising Domination of Messenger Applications; Increasing Demand for Consumer Analytics.
6. What are the notable trends driving market growth?
Retail to Have Significant Growth.
7. Are there any restraints impacting market growth?
Integration Complexities and Data Concerns.
8. Can you provide examples of recent developments in the market?
April 2023 - Kore.ai disclosed that the firm had integrated its conversational AgentAssist with automated intelligent virtual assistant (IVA) support for Zendesk Inc. Through an everyday user experience, this AI virtual assistant for contact center employees manages the generation and sales processes, extending the capabilities of Zendesk Support across digital channels.
9. What pricing options are available for accessing the report?
Pricing options include single-user, multi-user, and enterprise licenses priced at USD 4750, USD 5250, and USD 8750 respectively.
10. Is the market size provided in terms of value or volume?
The market size is provided in terms of value, measured in Million.
11. Are there any specific market keywords associated with the report?
Yes, the market keyword associated with the report is "Chatbot Industry," which aids in identifying and referencing the specific market segment covered.
12. How do I determine which pricing option suits my needs best?
The pricing options vary based on user requirements and access needs. Individual users may opt for single-user licenses, while businesses requiring broader access may choose multi-user or enterprise licenses for cost-effective access to the report.
13. Are there any additional resources or data provided in the Chatbot Industry report?
While the report offers comprehensive insights, it's advisable to review the specific contents or supplementary materials provided to ascertain if additional resources or data are available.
14. How can I stay updated on further developments or reports in the Chatbot Industry?
To stay informed about further developments, trends, and reports in the Chatbot Industry, consider subscribing to industry newsletters, following relevant companies and organizations, or regularly checking reputable industry news sources and publications.
Methodology
Step 1 - Identification of Relevant Samples Size from Population Database


Step 2 - Approaches for Defining Global Market Size (Value, Volume* & Price*)

Note*: In applicable scenarios
Step 3 - Data Sources
Primary Research
- Web Analytics
- Survey Reports
- Research Institute
- Latest Research Reports
- Opinion Leaders
Secondary Research
- Annual Reports
- White Paper
- Latest Press Release
- Industry Association
- Paid Database
- Investor Presentations

Step 4 - Data Triangulation
Involves using different sources of information in order to increase the validity of a study
These sources are likely to be stakeholders in a program - participants, other researchers, program staff, other community members, and so on.
Then we put all data in single framework & apply various statistical tools to find out the dynamic on the market.
During the analysis stage, feedback from the stakeholder groups would be compared to determine areas of agreement as well as areas of divergence