

Key Insights
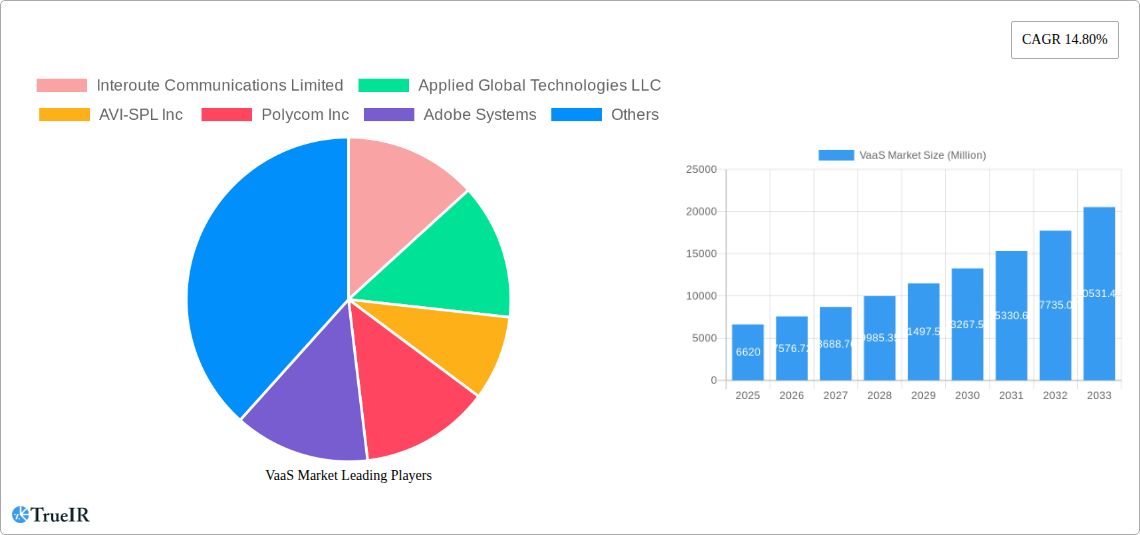
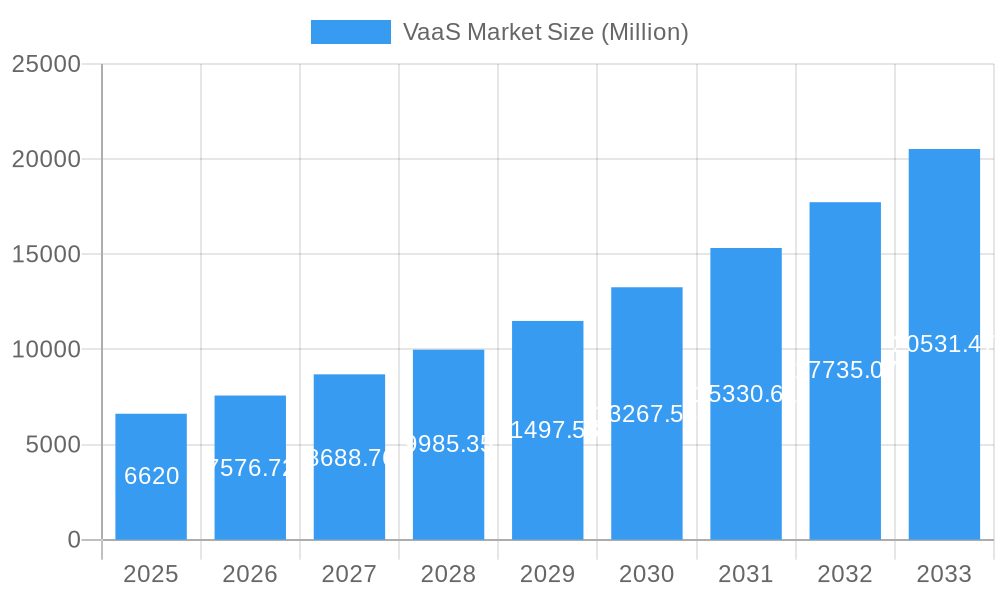
The global Video as a Service (VaaS) market is experiencing robust growth, projected to reach \$6.62 billion in 2025 and maintain a Compound Annual Growth Rate (CAGR) of 14.80% from 2025 to 2033. This expansion is fueled by several key drivers. The increasing adoption of cloud-based solutions across various industries, particularly in Government & Defense, BFSI (Banking, Financial Services, and Insurance), and Healthcare, is significantly contributing to market growth. Businesses are increasingly leveraging VaaS to enhance collaboration, improve operational efficiency, and reduce infrastructure costs. Furthermore, the rising demand for high-quality video conferencing and streaming services, driven by remote work trends and the proliferation of mobile devices, is fueling this market's expansion. The market's segmentation reveals strong growth across all deployment models (public, private, and hybrid cloud), with public cloud solutions leading the way due to their scalability and cost-effectiveness. Different service models, such as managed and professional services, cater to diverse organizational needs, fostering market diversification. The diverse range of platforms (application, device, and network management) and devices (mobility and enterprise computing) served further contributes to market expansion.
VaaS Market Market Size (In Billion)
The competitive landscape is dynamic, with established players like Cisco Systems, Avaya, and Polycom competing alongside emerging technology companies. Geographic analysis suggests North America and Europe currently hold substantial market share, but the Asia-Pacific region is poised for significant growth due to increasing digitalization and infrastructure investments. While the market faces challenges such as data security concerns and the need for robust network infrastructure, the overall growth trajectory remains positive, driven by the persistent demand for efficient and scalable video communication solutions across industries and geographies. The forecast period of 2025-2033 anticipates continued expansion, particularly in emerging markets, as the benefits of VaaS become more widely understood and adopted. The market is expected to witness further consolidation and innovation as companies compete to offer advanced features and improved user experiences.
VaaS Market Company Market Share
VaaS Market Report: A Comprehensive Analysis (2019-2033)
This dynamic report provides a detailed analysis of the Video as a Service (VaaS) market, offering invaluable insights for stakeholders across the industry. Covering the period 2019-2033, with a focus on 2025, this report delves into market structure, competitive dynamics, growth drivers, and future trends. The study period encompasses historical data (2019-2024), the base year (2025), and a comprehensive forecast (2025-2033). Expect in-depth analysis of key segments, including By Service (Managed, Professional), By Deployment Model (Public Cloud, Private Cloud, Hybrid Cloud), By End-user Industry (Government & Defense, BFSI, Healthcare, IT & Telecom, Media & Entertainment, Manufacturing, Others), By Platform (Application Management, Device Management, Network Management), and By Device (Mobility Devices, Enterprise Computing). Leading players like Interoute Communications Limited, Applied Global Technologies LLC, AVI-SPL Inc, Polycom Inc, Adobe Systems, Cisco Systems Inc, Avaya Inc, BlueJeans Network, Huawei Technologies Co Limited, and Vidyo Inc are profiled, offering a complete view of the competitive landscape. The report projects a market size exceeding xx Million by 2033, with a CAGR of xx%.
VaaS Market Market Structure & Competitive Landscape
The VaaS market exhibits a moderately concentrated structure, with a few dominant players holding significant market share. The Herfindahl-Hirschman Index (HHI) is estimated at xx, suggesting a competitive landscape with some degree of consolidation. Innovation is a key driver, with companies continually enhancing their offerings through improved video quality, enhanced security features, and integrated communication platforms. Regulatory frameworks impacting data privacy and security significantly shape market dynamics. Product substitutes, such as traditional video conferencing solutions, pose a challenge, though the flexibility and scalability of VaaS are increasingly preferred.
The market is segmented by end-user industry, with the BFSI, Government and Defense, and Healthcare sectors demonstrating strong adoption rates. Mergers and acquisitions (M&A) activity has been moderate in recent years, with approximately xx Million in deal value recorded between 2019 and 2024. This activity is primarily driven by companies seeking to expand their market reach and product portfolios.
- Key Market Characteristics: Moderate Concentration, High Innovation, Stringent Regulations, Growing Adoption.
- Competitive Dynamics: Intense competition among established players and emerging startups.
- M&A Activity: xx Million in deal value (2019-2024).
- Key Segmentation: By End-User Industry (BFSI, Government, Healthcare showing highest growth).
VaaS Market Market Trends & Opportunities
The VaaS market is experiencing robust growth, fueled by increasing digital transformation initiatives across various sectors. The market size, estimated at xx Million in 2025, is projected to reach xx Million by 2033, representing a significant expansion. Technological advancements, such as AI-powered features and improved bandwidth capabilities, are driving adoption. Consumer preference is shifting towards cloud-based solutions, owing to their scalability, cost-effectiveness, and ease of deployment. Competitive dynamics are characterized by intense rivalry among established players and innovative entrants. The market penetration rate for VaaS is currently estimated at xx%, expected to increase to xx% by 2033. The market's CAGR during the forecast period is projected to be xx%. Several significant opportunities exist in leveraging emerging technologies, expanding into untapped markets, and providing customized solutions.
Dominant Markets & Segments in VaaS Market
The North American region currently dominates the VaaS market, driven by high technological adoption rates, robust IT infrastructure, and a supportive regulatory environment. Within the segment breakdown:
- By Service: The managed services segment holds the largest market share due to its comprehensive support and ease of use. Professional services demonstrate strong growth potential.
- By Deployment Model: Public cloud deployment is the most popular model, leveraging its scalability and cost-effectiveness. Private and hybrid cloud deployments are also gaining traction.
- By End-user Industry: The BFSI and Government & Defence sectors are leading adopters due to their high demand for secure and reliable communication solutions. Healthcare's adoption is rapidly increasing.
- By Platform: Application management platforms are widely adopted, with significant growth anticipated in device and network management.
- By Device: Enterprise computing is the dominant device type, while mobility devices are showing substantial growth.
Key Growth Drivers:
- Robust IT infrastructure: Enables seamless integration and efficient functioning of VaaS platforms.
- Supportive Government Policies: Encourage the adoption of digital communication technologies.
- Growing Demand for Secure Communication: Drives adoption across various sectors.
VaaS Market Product Analysis
VaaS product innovation focuses on enhancing video quality, improving security features, and integrating advanced functionalities like AI-powered analytics and collaboration tools. Competitive advantage hinges on superior video quality, robust security protocols, seamless integration with existing systems, and a user-friendly interface. The market is witnessing the rise of AI-powered features, such as real-time transcription and automated meeting summaries, enhancing the overall user experience. This evolution is driving market expansion and improved user experience.
Key Drivers, Barriers & Challenges in VaaS Market
Key Drivers:
The VaaS market is propelled by several factors, including:
- Increasing demand for remote collaboration and work-from-home solutions.
- The need for enhanced communication and collaboration within organizations.
- Technological advancements like AI and improved bandwidth.
- Government initiatives promoting digital transformation.
Challenges and Restraints:
The market faces certain challenges:
- High initial investment costs can hinder adoption, especially for smaller businesses.
- Security and privacy concerns remain a critical hurdle.
- The complexities of integrating VaaS solutions with existing IT infrastructure can pose difficulties.
- Intense competition among various providers can lead to price wars and reduced profit margins. This results in approximately xx Million lost revenue annually.
Growth Drivers in the VaaS Market Market
The VaaS market is driven by several key factors, including:
- Technological Advancements: Improvements in video quality, bandwidth, and AI-powered features are fueling market growth.
- Economic Factors: The increasing affordability and accessibility of VaaS solutions are driving adoption.
- Regulatory Factors: Government initiatives promoting digital transformation create opportunities.
Challenges Impacting VaaS Market Growth
Significant challenges include:
- Regulatory Complexities: Data privacy and security regulations can restrict market growth.
- Supply Chain Issues: Global supply chain disruptions can affect the availability of VaaS solutions.
- Competitive Pressures: Intense competition can limit profit margins and hinder growth. This represents approximately xx Million in potential lost revenue annually.
Key Players Shaping the VaaS Market Market
- Interoute Communications Limited
- Applied Global Technologies LLC
- AVI-SPL Inc
- Polycom Inc
- Adobe Systems
- Cisco Systems Inc
- Avaya Inc
- BlueJeans Network
- Huawei Technologies Co Limited
- Vidyo Inc
Significant VaaS Market Industry Milestones
- October 2022: Cisco and Microsoft's alliance expands Teams integration into Cisco devices, boosting interoperability and market share.
- November 2022: Tesla's integration of Zoom into its infotainment system showcases VaaS expansion into the automotive sector, opening a new application frontier and potentially adding xx Million in market value.
Future Outlook for VaaS Market Market
The VaaS market is poised for substantial growth, fueled by ongoing technological innovation, expanding market adoption, and the increasing demand for remote collaboration solutions. Strategic opportunities lie in developing AI-powered features, enhancing security protocols, and expanding into new sectors like the automotive and healthcare industries. The market’s potential is vast, with opportunities to reach xx Million in annual revenue by 2033, if key challenges are addressed strategically.
VaaS Market Segmentation
-
1. Platform
- 1.1. Application Management
- 1.2. Device Management
- 1.3. Network Management
-
2. Device
- 2.1. Mobility Devices
- 2.2. Enterprise Computing
-
3. Service
- 3.1. Managed
- 3.2. Professional
-
4. Deployment Model
- 4.1. Public Cloud
- 4.2. Private Cloud
- 4.3. Hybrid Cloud
-
5. End-user Industry
- 5.1. Government and Defense
- 5.2. BFSI
- 5.3. Healthcare
- 5.4. IT & Telecom
- 5.5. Media & Entertainment
- 5.6. Manufacturing
- 5.7. Other End-user Industries
VaaS Market Segmentation By Geography
- 1. North America
- 2. Europe
- 3. Asia
- 4. Latin America
- 5. Middle East and Africa
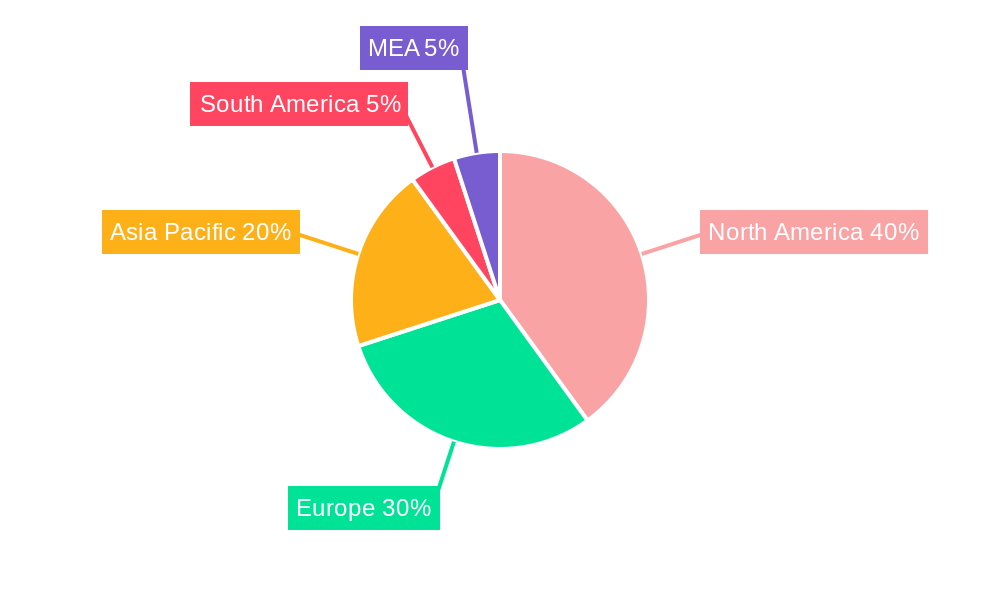
VaaS Market Regional Market Share
Geographic Coverage of VaaS Market
VaaS Market REPORT HIGHLIGHTS
| Aspects | Details |
|---|---|
| Study Period | 2020-2034 |
| Base Year | 2025 |
| Estimated Year | 2026 |
| Forecast Period | 2026-2034 |
| Historical Period | 2020-2025 |
| Growth Rate | CAGR of 14.80% from 2020-2034 |
| Segmentation |
|
Table of Contents
- 1. Introduction
- 1.1. Research Scope
- 1.2. Market Segmentation
- 1.3. Research Objective
- 1.4. Definitions and Assumptions
- 2. Executive Summary
- 2.1. Market Snapshot
- 3. Market Dynamics
- 3.1. Market Drivers
- 3.2. Market Restrains
- 3.3. Market Trends
- 3.4. Market Opportunities
- 4. Market Factor Analysis
- 4.1. Porters Five Forces
- 4.1.1. Bargaining Power of Suppliers
- 4.1.2. Bargaining Power of Buyers
- 4.1.3. Threat of New Entrants
- 4.1.4. Threat of Substitutes
- 4.1.5. Competitive Rivalry
- 4.2. PESTEL analysis
- 4.3. BCG Analysis
- 4.3.1. Stars (High Growth, High Market Share)
- 4.3.2. Cash Cows (Low Growth, High Market Share)
- 4.3.3. Question Mark (High Growth, Low Market Share)
- 4.3.4. Dogs (Low Growth, Low Market Share)
- 4.4. Ansoff Matrix Analysis
- 4.5. Supply Chain Analysis
- 4.6. Regulatory Landscape
- 4.7. Current Market Potential and Opportunity Assessment (TAM–SAM–SOM Framework)
- 4.8. TIR Analyst Note
- 4.1. Porters Five Forces
- 5. Market Analysis, Insights and Forecast 2021-2033
- 5.1. Market Analysis, Insights and Forecast - by Platform
- 5.1.1. Application Management
- 5.1.2. Device Management
- 5.1.3. Network Management
- 5.2. Market Analysis, Insights and Forecast - by Device
- 5.2.1. Mobility Devices
- 5.2.2. Enterprise Computing
- 5.3. Market Analysis, Insights and Forecast - by Service
- 5.3.1. Managed
- 5.3.2. Professional
- 5.4. Market Analysis, Insights and Forecast - by Deployment Model
- 5.4.1. Public Cloud
- 5.4.2. Private Cloud
- 5.4.3. Hybrid Cloud
- 5.5. Market Analysis, Insights and Forecast - by End-user Industry
- 5.5.1. Government and Defense
- 5.5.2. BFSI
- 5.5.3. Healthcare
- 5.5.4. IT & Telecom
- 5.5.5. Media & Entertainment
- 5.5.6. Manufacturing
- 5.5.7. Other End-user Industries
- 5.6. Market Analysis, Insights and Forecast - by Region
- 5.6.1. North America
- 5.6.2. Europe
- 5.6.3. Asia
- 5.6.4. Latin America
- 5.6.5. Middle East and Africa
- 5.1. Market Analysis, Insights and Forecast - by Platform
- 6. Global VaaS Market Analysis, Insights and Forecast, 2021-2033
- 6.1. Market Analysis, Insights and Forecast - by Platform
- 6.1.1. Application Management
- 6.1.2. Device Management
- 6.1.3. Network Management
- 6.2. Market Analysis, Insights and Forecast - by Device
- 6.2.1. Mobility Devices
- 6.2.2. Enterprise Computing
- 6.3. Market Analysis, Insights and Forecast - by Service
- 6.3.1. Managed
- 6.3.2. Professional
- 6.4. Market Analysis, Insights and Forecast - by Deployment Model
- 6.4.1. Public Cloud
- 6.4.2. Private Cloud
- 6.4.3. Hybrid Cloud
- 6.5. Market Analysis, Insights and Forecast - by End-user Industry
- 6.5.1. Government and Defense
- 6.5.2. BFSI
- 6.5.3. Healthcare
- 6.5.4. IT & Telecom
- 6.5.5. Media & Entertainment
- 6.5.6. Manufacturing
- 6.5.7. Other End-user Industries
- 6.1. Market Analysis, Insights and Forecast - by Platform
- 7. North America VaaS Market Analysis, Insights and Forecast, 2020-2032
- 7.1. Market Analysis, Insights and Forecast - by Platform
- 7.1.1. Application Management
- 7.1.2. Device Management
- 7.1.3. Network Management
- 7.2. Market Analysis, Insights and Forecast - by Device
- 7.2.1. Mobility Devices
- 7.2.2. Enterprise Computing
- 7.3. Market Analysis, Insights and Forecast - by Service
- 7.3.1. Managed
- 7.3.2. Professional
- 7.4. Market Analysis, Insights and Forecast - by Deployment Model
- 7.4.1. Public Cloud
- 7.4.2. Private Cloud
- 7.4.3. Hybrid Cloud
- 7.5. Market Analysis, Insights and Forecast - by End-user Industry
- 7.5.1. Government and Defense
- 7.5.2. BFSI
- 7.5.3. Healthcare
- 7.5.4. IT & Telecom
- 7.5.5. Media & Entertainment
- 7.5.6. Manufacturing
- 7.5.7. Other End-user Industries
- 7.1. Market Analysis, Insights and Forecast - by Platform
- 8. Europe VaaS Market Analysis, Insights and Forecast, 2020-2032
- 8.1. Market Analysis, Insights and Forecast - by Platform
- 8.1.1. Application Management
- 8.1.2. Device Management
- 8.1.3. Network Management
- 8.2. Market Analysis, Insights and Forecast - by Device
- 8.2.1. Mobility Devices
- 8.2.2. Enterprise Computing
- 8.3. Market Analysis, Insights and Forecast - by Service
- 8.3.1. Managed
- 8.3.2. Professional
- 8.4. Market Analysis, Insights and Forecast - by Deployment Model
- 8.4.1. Public Cloud
- 8.4.2. Private Cloud
- 8.4.3. Hybrid Cloud
- 8.5. Market Analysis, Insights and Forecast - by End-user Industry
- 8.5.1. Government and Defense
- 8.5.2. BFSI
- 8.5.3. Healthcare
- 8.5.4. IT & Telecom
- 8.5.5. Media & Entertainment
- 8.5.6. Manufacturing
- 8.5.7. Other End-user Industries
- 8.1. Market Analysis, Insights and Forecast - by Platform
- 9. Asia VaaS Market Analysis, Insights and Forecast, 2020-2032
- 9.1. Market Analysis, Insights and Forecast - by Platform
- 9.1.1. Application Management
- 9.1.2. Device Management
- 9.1.3. Network Management
- 9.2. Market Analysis, Insights and Forecast - by Device
- 9.2.1. Mobility Devices
- 9.2.2. Enterprise Computing
- 9.3. Market Analysis, Insights and Forecast - by Service
- 9.3.1. Managed
- 9.3.2. Professional
- 9.4. Market Analysis, Insights and Forecast - by Deployment Model
- 9.4.1. Public Cloud
- 9.4.2. Private Cloud
- 9.4.3. Hybrid Cloud
- 9.5. Market Analysis, Insights and Forecast - by End-user Industry
- 9.5.1. Government and Defense
- 9.5.2. BFSI
- 9.5.3. Healthcare
- 9.5.4. IT & Telecom
- 9.5.5. Media & Entertainment
- 9.5.6. Manufacturing
- 9.5.7. Other End-user Industries
- 9.1. Market Analysis, Insights and Forecast - by Platform
- 10. Latin America VaaS Market Analysis, Insights and Forecast, 2020-2032
- 10.1. Market Analysis, Insights and Forecast - by Platform
- 10.1.1. Application Management
- 10.1.2. Device Management
- 10.1.3. Network Management
- 10.2. Market Analysis, Insights and Forecast - by Device
- 10.2.1. Mobility Devices
- 10.2.2. Enterprise Computing
- 10.3. Market Analysis, Insights and Forecast - by Service
- 10.3.1. Managed
- 10.3.2. Professional
- 10.4. Market Analysis, Insights and Forecast - by Deployment Model
- 10.4.1. Public Cloud
- 10.4.2. Private Cloud
- 10.4.3. Hybrid Cloud
- 10.5. Market Analysis, Insights and Forecast - by End-user Industry
- 10.5.1. Government and Defense
- 10.5.2. BFSI
- 10.5.3. Healthcare
- 10.5.4. IT & Telecom
- 10.5.5. Media & Entertainment
- 10.5.6. Manufacturing
- 10.5.7. Other End-user Industries
- 10.1. Market Analysis, Insights and Forecast - by Platform
- 11. Middle East and Africa VaaS Market Analysis, Insights and Forecast, 2020-2032
- 11.1. Market Analysis, Insights and Forecast - by Platform
- 11.1.1. Application Management
- 11.1.2. Device Management
- 11.1.3. Network Management
- 11.2. Market Analysis, Insights and Forecast - by Device
- 11.2.1. Mobility Devices
- 11.2.2. Enterprise Computing
- 11.3. Market Analysis, Insights and Forecast - by Service
- 11.3.1. Managed
- 11.3.2. Professional
- 11.4. Market Analysis, Insights and Forecast - by Deployment Model
- 11.4.1. Public Cloud
- 11.4.2. Private Cloud
- 11.4.3. Hybrid Cloud
- 11.5. Market Analysis, Insights and Forecast - by End-user Industry
- 11.5.1. Government and Defense
- 11.5.2. BFSI
- 11.5.3. Healthcare
- 11.5.4. IT & Telecom
- 11.5.5. Media & Entertainment
- 11.5.6. Manufacturing
- 11.5.7. Other End-user Industries
- 11.1. Market Analysis, Insights and Forecast - by Platform
- 12. Competitive Analysis
- 12.1. Company Profiles
- 12.1.1 Interoute Communications Limited
- 12.1.1.1. Company Overview
- 12.1.1.2. Products
- 12.1.1.3. Company Financials
- 12.1.1.4. SWOT Analysis
- 12.1.2 Applied Global Technologies LLC
- 12.1.2.1. Company Overview
- 12.1.2.2. Products
- 12.1.2.3. Company Financials
- 12.1.2.4. SWOT Analysis
- 12.1.3 AVI-SPL Inc
- 12.1.3.1. Company Overview
- 12.1.3.2. Products
- 12.1.3.3. Company Financials
- 12.1.3.4. SWOT Analysis
- 12.1.4 Polycom Inc
- 12.1.4.1. Company Overview
- 12.1.4.2. Products
- 12.1.4.3. Company Financials
- 12.1.4.4. SWOT Analysis
- 12.1.5 Adobe Systems
- 12.1.5.1. Company Overview
- 12.1.5.2. Products
- 12.1.5.3. Company Financials
- 12.1.5.4. SWOT Analysis
- 12.1.6 Cisco Systems Inc
- 12.1.6.1. Company Overview
- 12.1.6.2. Products
- 12.1.6.3. Company Financials
- 12.1.6.4. SWOT Analysis
- 12.1.7 Avaya Inc
- 12.1.7.1. Company Overview
- 12.1.7.2. Products
- 12.1.7.3. Company Financials
- 12.1.7.4. SWOT Analysis
- 12.1.8 BlueJeans Network
- 12.1.8.1. Company Overview
- 12.1.8.2. Products
- 12.1.8.3. Company Financials
- 12.1.8.4. SWOT Analysis
- 12.1.9 Huawei Technologies Co Limited
- 12.1.9.1. Company Overview
- 12.1.9.2. Products
- 12.1.9.3. Company Financials
- 12.1.9.4. SWOT Analysis
- 12.1.10 Vidyo Inc
- 12.1.10.1. Company Overview
- 12.1.10.2. Products
- 12.1.10.3. Company Financials
- 12.1.10.4. SWOT Analysis
- 12.1.1 Interoute Communications Limited
- 12.2. Market Entropy
- 12.2.1 Company's Key Areas Served
- 12.2.2 Recent Developments
- 12.3. Company Market Share Analysis 2025
- 12.3.1 Top 5 Companies Market Share Analysis
- 12.3.2 Top 3 Companies Market Share Analysis
- 12.4. List of Potential Customers
- 13. Research Methodology
List of Figures
- Figure 1: Global VaaS Market Revenue Breakdown (Million, %) by Region 2025 & 2033
- Figure 2: North America VaaS Market Revenue (Million), by Platform 2025 & 2033
- Figure 3: North America VaaS Market Revenue Share (%), by Platform 2025 & 2033
- Figure 4: North America VaaS Market Revenue (Million), by Device 2025 & 2033
- Figure 5: North America VaaS Market Revenue Share (%), by Device 2025 & 2033
- Figure 6: North America VaaS Market Revenue (Million), by Service 2025 & 2033
- Figure 7: North America VaaS Market Revenue Share (%), by Service 2025 & 2033
- Figure 8: North America VaaS Market Revenue (Million), by Deployment Model 2025 & 2033
- Figure 9: North America VaaS Market Revenue Share (%), by Deployment Model 2025 & 2033
- Figure 10: North America VaaS Market Revenue (Million), by End-user Industry 2025 & 2033
- Figure 11: North America VaaS Market Revenue Share (%), by End-user Industry 2025 & 2033
- Figure 12: North America VaaS Market Revenue (Million), by Country 2025 & 2033
- Figure 13: North America VaaS Market Revenue Share (%), by Country 2025 & 2033
- Figure 14: Europe VaaS Market Revenue (Million), by Platform 2025 & 2033
- Figure 15: Europe VaaS Market Revenue Share (%), by Platform 2025 & 2033
- Figure 16: Europe VaaS Market Revenue (Million), by Device 2025 & 2033
- Figure 17: Europe VaaS Market Revenue Share (%), by Device 2025 & 2033
- Figure 18: Europe VaaS Market Revenue (Million), by Service 2025 & 2033
- Figure 19: Europe VaaS Market Revenue Share (%), by Service 2025 & 2033
- Figure 20: Europe VaaS Market Revenue (Million), by Deployment Model 2025 & 2033
- Figure 21: Europe VaaS Market Revenue Share (%), by Deployment Model 2025 & 2033
- Figure 22: Europe VaaS Market Revenue (Million), by End-user Industry 2025 & 2033
- Figure 23: Europe VaaS Market Revenue Share (%), by End-user Industry 2025 & 2033
- Figure 24: Europe VaaS Market Revenue (Million), by Country 2025 & 2033
- Figure 25: Europe VaaS Market Revenue Share (%), by Country 2025 & 2033
- Figure 26: Asia VaaS Market Revenue (Million), by Platform 2025 & 2033
- Figure 27: Asia VaaS Market Revenue Share (%), by Platform 2025 & 2033
- Figure 28: Asia VaaS Market Revenue (Million), by Device 2025 & 2033
- Figure 29: Asia VaaS Market Revenue Share (%), by Device 2025 & 2033
- Figure 30: Asia VaaS Market Revenue (Million), by Service 2025 & 2033
- Figure 31: Asia VaaS Market Revenue Share (%), by Service 2025 & 2033
- Figure 32: Asia VaaS Market Revenue (Million), by Deployment Model 2025 & 2033
- Figure 33: Asia VaaS Market Revenue Share (%), by Deployment Model 2025 & 2033
- Figure 34: Asia VaaS Market Revenue (Million), by End-user Industry 2025 & 2033
- Figure 35: Asia VaaS Market Revenue Share (%), by End-user Industry 2025 & 2033
- Figure 36: Asia VaaS Market Revenue (Million), by Country 2025 & 2033
- Figure 37: Asia VaaS Market Revenue Share (%), by Country 2025 & 2033
- Figure 38: Latin America VaaS Market Revenue (Million), by Platform 2025 & 2033
- Figure 39: Latin America VaaS Market Revenue Share (%), by Platform 2025 & 2033
- Figure 40: Latin America VaaS Market Revenue (Million), by Device 2025 & 2033
- Figure 41: Latin America VaaS Market Revenue Share (%), by Device 2025 & 2033
- Figure 42: Latin America VaaS Market Revenue (Million), by Service 2025 & 2033
- Figure 43: Latin America VaaS Market Revenue Share (%), by Service 2025 & 2033
- Figure 44: Latin America VaaS Market Revenue (Million), by Deployment Model 2025 & 2033
- Figure 45: Latin America VaaS Market Revenue Share (%), by Deployment Model 2025 & 2033
- Figure 46: Latin America VaaS Market Revenue (Million), by End-user Industry 2025 & 2033
- Figure 47: Latin America VaaS Market Revenue Share (%), by End-user Industry 2025 & 2033
- Figure 48: Latin America VaaS Market Revenue (Million), by Country 2025 & 2033
- Figure 49: Latin America VaaS Market Revenue Share (%), by Country 2025 & 2033
- Figure 50: Middle East and Africa VaaS Market Revenue (Million), by Platform 2025 & 2033
- Figure 51: Middle East and Africa VaaS Market Revenue Share (%), by Platform 2025 & 2033
- Figure 52: Middle East and Africa VaaS Market Revenue (Million), by Device 2025 & 2033
- Figure 53: Middle East and Africa VaaS Market Revenue Share (%), by Device 2025 & 2033
- Figure 54: Middle East and Africa VaaS Market Revenue (Million), by Service 2025 & 2033
- Figure 55: Middle East and Africa VaaS Market Revenue Share (%), by Service 2025 & 2033
- Figure 56: Middle East and Africa VaaS Market Revenue (Million), by Deployment Model 2025 & 2033
- Figure 57: Middle East and Africa VaaS Market Revenue Share (%), by Deployment Model 2025 & 2033
- Figure 58: Middle East and Africa VaaS Market Revenue (Million), by End-user Industry 2025 & 2033
- Figure 59: Middle East and Africa VaaS Market Revenue Share (%), by End-user Industry 2025 & 2033
- Figure 60: Middle East and Africa VaaS Market Revenue (Million), by Country 2025 & 2033
- Figure 61: Middle East and Africa VaaS Market Revenue Share (%), by Country 2025 & 2033
List of Tables
- Table 1: Global VaaS Market Revenue Million Forecast, by Platform 2020 & 2033
- Table 2: Global VaaS Market Revenue Million Forecast, by Device 2020 & 2033
- Table 3: Global VaaS Market Revenue Million Forecast, by Service 2020 & 2033
- Table 4: Global VaaS Market Revenue Million Forecast, by Deployment Model 2020 & 2033
- Table 5: Global VaaS Market Revenue Million Forecast, by End-user Industry 2020 & 2033
- Table 6: Global VaaS Market Revenue Million Forecast, by Region 2020 & 2033
- Table 7: Global VaaS Market Revenue Million Forecast, by Platform 2020 & 2033
- Table 8: Global VaaS Market Revenue Million Forecast, by Device 2020 & 2033
- Table 9: Global VaaS Market Revenue Million Forecast, by Service 2020 & 2033
- Table 10: Global VaaS Market Revenue Million Forecast, by Deployment Model 2020 & 2033
- Table 11: Global VaaS Market Revenue Million Forecast, by End-user Industry 2020 & 2033
- Table 12: Global VaaS Market Revenue Million Forecast, by Country 2020 & 2033
- Table 13: Global VaaS Market Revenue Million Forecast, by Platform 2020 & 2033
- Table 14: Global VaaS Market Revenue Million Forecast, by Device 2020 & 2033
- Table 15: Global VaaS Market Revenue Million Forecast, by Service 2020 & 2033
- Table 16: Global VaaS Market Revenue Million Forecast, by Deployment Model 2020 & 2033
- Table 17: Global VaaS Market Revenue Million Forecast, by End-user Industry 2020 & 2033
- Table 18: Global VaaS Market Revenue Million Forecast, by Country 2020 & 2033
- Table 19: Global VaaS Market Revenue Million Forecast, by Platform 2020 & 2033
- Table 20: Global VaaS Market Revenue Million Forecast, by Device 2020 & 2033
- Table 21: Global VaaS Market Revenue Million Forecast, by Service 2020 & 2033
- Table 22: Global VaaS Market Revenue Million Forecast, by Deployment Model 2020 & 2033
- Table 23: Global VaaS Market Revenue Million Forecast, by End-user Industry 2020 & 2033
- Table 24: Global VaaS Market Revenue Million Forecast, by Country 2020 & 2033
- Table 25: Global VaaS Market Revenue Million Forecast, by Platform 2020 & 2033
- Table 26: Global VaaS Market Revenue Million Forecast, by Device 2020 & 2033
- Table 27: Global VaaS Market Revenue Million Forecast, by Service 2020 & 2033
- Table 28: Global VaaS Market Revenue Million Forecast, by Deployment Model 2020 & 2033
- Table 29: Global VaaS Market Revenue Million Forecast, by End-user Industry 2020 & 2033
- Table 30: Global VaaS Market Revenue Million Forecast, by Country 2020 & 2033
- Table 31: Global VaaS Market Revenue Million Forecast, by Platform 2020 & 2033
- Table 32: Global VaaS Market Revenue Million Forecast, by Device 2020 & 2033
- Table 33: Global VaaS Market Revenue Million Forecast, by Service 2020 & 2033
- Table 34: Global VaaS Market Revenue Million Forecast, by Deployment Model 2020 & 2033
- Table 35: Global VaaS Market Revenue Million Forecast, by End-user Industry 2020 & 2033
- Table 36: Global VaaS Market Revenue Million Forecast, by Country 2020 & 2033
Frequently Asked Questions
1. What is the projected Compound Annual Growth Rate (CAGR) of the VaaS Market?
The projected CAGR is approximately 14.80%.
2. Which companies are prominent players in the VaaS Market?
Key companies in the market include Interoute Communications Limited, Applied Global Technologies LLC, AVI-SPL Inc , Polycom Inc, Adobe Systems, Cisco Systems Inc, Avaya Inc, BlueJeans Network, Huawei Technologies Co Limited, Vidyo Inc.
3. What are the main segments of the VaaS Market?
The market segments include Platform, Device, Service, Deployment Model, End-user Industry.
4. Can you provide details about the market size?
The market size is estimated to be USD 6.62 Million as of 2022.
5. What are some drivers contributing to market growth?
Increasing Investment on Cloud-Based Video Services; Enabling Digital Workforce.
6. What are the notable trends driving market growth?
The Hybrid Cloud Segment is Anticipated to Drive the Market Demand.
7. Are there any restraints impacting market growth?
High Cost of Video Content Creation and Validity.
8. Can you provide examples of recent developments in the market?
November 2022: Tesla announced that a Tesla driver could use the Zoom app to make or receive video conversations in the vehicle. The Zoom call app would be directly accessed on Tesla's central touchscreen infotainment system. The software utilizes the in-car camera mounted on the rearview mirror.
9. What pricing options are available for accessing the report?
Pricing options include single-user, multi-user, and enterprise licenses priced at USD 4750, USD 5250, and USD 8750 respectively.
10. Is the market size provided in terms of value or volume?
The market size is provided in terms of value, measured in Million.
11. Are there any specific market keywords associated with the report?
Yes, the market keyword associated with the report is "VaaS Market," which aids in identifying and referencing the specific market segment covered.
12. How do I determine which pricing option suits my needs best?
The pricing options vary based on user requirements and access needs. Individual users may opt for single-user licenses, while businesses requiring broader access may choose multi-user or enterprise licenses for cost-effective access to the report.
13. Are there any additional resources or data provided in the VaaS Market report?
While the report offers comprehensive insights, it's advisable to review the specific contents or supplementary materials provided to ascertain if additional resources or data are available.
14. How can I stay updated on further developments or reports in the VaaS Market?
To stay informed about further developments, trends, and reports in the VaaS Market, consider subscribing to industry newsletters, following relevant companies and organizations, or regularly checking reputable industry news sources and publications.
Methodology
Step 1 - Identification of Relevant Samples Size from Population Database


Step 2 - Approaches for Defining Global Market Size (Value, Volume* & Price*)

Note*: In applicable scenarios
Step 3 - Data Sources
Primary Research
- Web Analytics
- Survey Reports
- Research Institute
- Latest Research Reports
- Opinion Leaders
Secondary Research
- Annual Reports
- White Paper
- Latest Press Release
- Industry Association
- Paid Database
- Investor Presentations

Step 4 - Data Triangulation
Involves using different sources of information in order to increase the validity of a study
These sources are likely to be stakeholders in a program - participants, other researchers, program staff, other community members, and so on.
Then we put all data in single framework & apply various statistical tools to find out the dynamic on the market.
During the analysis stage, feedback from the stakeholder groups would be compared to determine areas of agreement as well as areas of divergence