

Key Insights
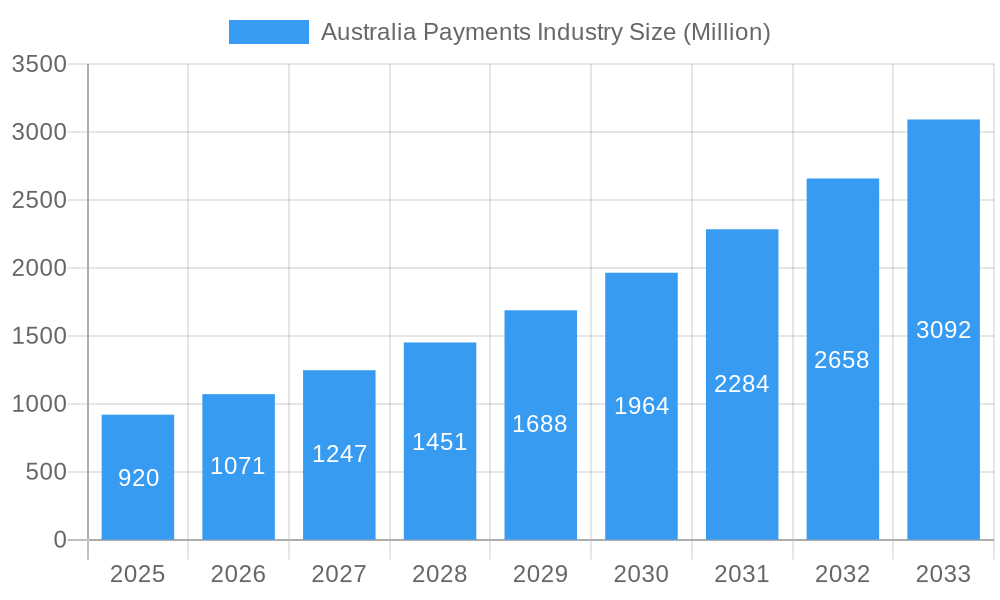
The Australian payments industry is poised for significant expansion, with a projected market size of AUD 0.92 billion in 2025, driven by a robust Compound Annual Growth Rate (CAGR) of 16.44% expected to continue through 2033. This substantial growth is fueled by several key factors, including the increasing adoption of digital payment methods and a strong preference for convenience across various consumer and business segments. The proliferation of smartphones and the widespread availability of high-speed internet have created a fertile ground for the adoption of digital wallets, such as Google Pay and Apple Pay, which offer seamless and secure transaction experiences. Furthermore, government initiatives aimed at promoting financial inclusion and reducing reliance on cash are further bolstering the shift towards electronic payments. The growing e-commerce sector in Australia also plays a crucial role, with consumers increasingly opting for online purchases, thereby driving demand for secure and efficient online payment gateways. Innovations in payment technology, including contactless payments and buy-now-pay-later (BNPL) services, are also contributing to the dynamic evolution of the market, catering to evolving consumer preferences for flexibility and instant gratification.
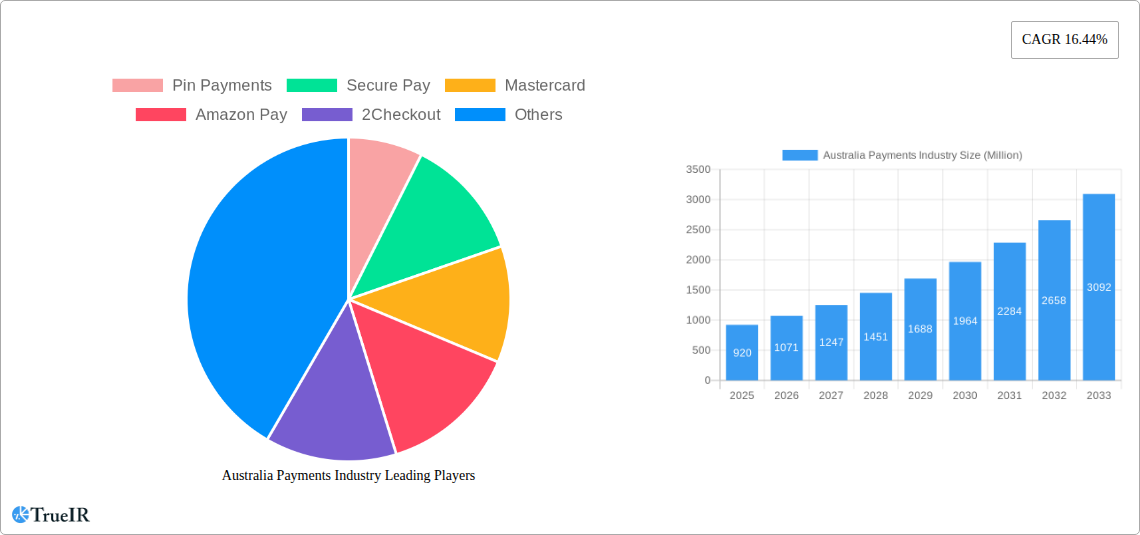
Australia Payments Industry Market Size (In Million)
The competitive landscape is characterized by the presence of established global players like Mastercard and Visa, alongside prominent digital payment providers such as Amazon Pay and Google Pay, and specialized payment processors like Pin Payments and Square. These companies are actively investing in technological advancements and expanding their service offerings to capture market share. While the industry benefits from strong growth drivers, potential restraints such as evolving regulatory frameworks and the need for robust cybersecurity measures to combat fraud must be carefully managed. The market is segmented across various payment modes, with a notable shift towards digital wallets and card payments at the Point of Sale, while online sales are also witnessing steady growth, particularly in sectors like retail and entertainment. The healthcare and hospitality industries are also increasingly adopting digital payment solutions to enhance customer experience and operational efficiency. The Australian market, with its forward-thinking approach to financial technology, is expected to remain a leading region in the Asia-Pacific payments landscape.
Australia Payments Industry Company Market Share
Here is a dynamic, SEO-optimized report description for the Australia Payments Industry, incorporating your specified keywords, structure, and details.
Australia Payments Industry: Market Growth, Trends, and Future Outlook (2019-2033)
Unlock critical insights into the rapidly evolving Australian payments landscape with this comprehensive market report. Spanning the historical period of 2019-2024, a base year of 2025, and a robust forecast period from 2025-2033, this report delves into market size, technological innovations, consumer behavior shifts, and competitive dynamics. Leveraging high-volume keywords like "Australia payments market," "digital wallets Australia," "online payment Australia," "card payments Australia," and "fintech Australia," this analysis is designed to enhance search visibility and provide actionable intelligence for stakeholders. Discover key growth drivers, prevailing challenges, dominant market segments including Point of Sale (Card Pay, Digital Wallet, Cash, Others) and Online Sale (Others), and end-user industries such as Retail, Entertainment, Healthcare, and Hospitality. Understand the impact of industry developments and prepare for future market opportunities.
Australia Payments Industry Market Structure & Competitive Landscape
The Australian payments industry exhibits a dynamic market structure characterized by moderate to high concentration, driven by the significant influence of global payment giants alongside a growing number of innovative fintech players. Innovation is primarily fueled by the accelerating adoption of digital payment technologies, including mobile wallets and contactless solutions, alongside ongoing advancements in blockchain and real-time payment systems. Regulatory impacts, such as the Reserve Bank of Australia's (RBA) ongoing efforts to modernize payments infrastructure and enhance competition, are shaping the operational landscape for all participants. Product substitutes are increasingly prevalent, with Buy Now, Pay Later (BNPL) services posing a significant alternative to traditional credit and debit card transactions. End-user segmentation reveals a strong preference for convenience and speed across all sectors, with retail and e-commerce leading in transaction volumes. Merger and acquisition (M&A) trends indicate a strategic consolidation among established players and a surge in investment within the fintech startup ecosystem, aiming to capture market share and expand service offerings. For instance, a recent analysis suggests an average of 5-10 significant M&A activities annually within the past two years, with deal values often exceeding several hundred million dollars. Concentration ratios, particularly for card networks, remain substantial, though competition is intensifying with the rise of new payment providers.
Australia Payments Industry Market Trends & Opportunities
The Australian payments industry is poised for substantial growth, with an estimated Compound Annual Growth Rate (CAGR) of approximately 8.5% projected over the forecast period. This expansion is underpinned by several key trends. The relentless shift towards digital and contactless payments continues to dominate, with digital wallets, including mobile wallets, experiencing a surge in adoption, estimated to reach over 70% of the adult population by 2027. Card pay remains a dominant mode of payment, particularly at the Point of Sale, but its growth is increasingly challenged by the proliferation of alternative payment methods. Online sales are experiencing a significant uplift, driven by the sustained growth of e-commerce, which is projected to contribute over 30% of total retail sales by 2028. Consumer preferences are increasingly leaning towards seamless, secure, and instant payment experiences, fostering innovation in areas like biometric authentication and tokenization. The competitive dynamics are intensifying, with both established financial institutions and agile fintech companies vying for market share. Opportunities abound in developing embedded payment solutions for various end-user industries, catering to the specific needs of sectors like healthcare and hospitality. Furthermore, the growing demand for cross-border payment solutions and the increasing penetration of smartphones, expected to reach 95% by 2029, present significant avenues for market expansion and revenue generation. The integration of AI for fraud detection and personalized financial services will also be a critical differentiator.
Dominant Markets & Segments in Australia Payments Industry
The Australian payments industry is significantly shaped by the dominance of specific modes of payment and end-user industries. Within the Mode of Payment segment, Point of Sale transactions, particularly Card Pay and the rapidly growing Digital Wallet (includes Mobile Wallets), collectively represent the largest share, estimated to account for over 80% of all in-person transactions. The convenience and security offered by contactless card payments and mobile payment solutions have cemented their position, with mobile wallet penetration projected to surpass 70% by 2027. While Cash usage continues to decline, it still holds a niche for specific transactions and consumer segments. Online Sale transactions, primarily driven by e-commerce, are experiencing accelerated growth, with the "Others" category encompassing a wide array of digital payment facilitators and emerging methods contributing significantly to this surge.
In terms of End-user Industry, Retail stands out as the dominant sector, accounting for approximately 45% of all payment transaction volumes. This is directly linked to the high frequency of consumer purchases and the ongoing digital transformation within the retail space, including the widespread adoption of online shopping. Hospitality and Entertainment also represent substantial markets, with consumers increasingly opting for digital and contactless payments for bookings, services, and purchases. The Healthcare sector, while historically slower to adopt digital payment methods, is witnessing a significant transformation, driven by regulatory pushes for electronic billing and the convenience of online payment portals for appointments and services. The growth drivers for these dominant segments include robust consumer spending, increasing digital infrastructure development, supportive government policies promoting cashless transactions, and evolving consumer expectations for frictionless payment experiences. For instance, government initiatives aimed at reducing the cost of digital transactions are a key policy-driven growth factor.
Australia Payments Industry Product Analysis
Key product innovations in the Australian payments industry center on enhancing security, convenience, and speed. Contactless payment technologies, including tap-and-go cards and mobile wallets like Apple Pay and Google Pay, have become standard, offering unparalleled ease of use. Secure tokenization protocols and advanced fraud detection algorithms, often powered by AI, are being integrated across platforms, bolstering consumer confidence. Emerging solutions include biometric authentication for transaction authorization and the expansion of Buy Now, Pay Later (BNPL) services, providing flexible payment options. The competitive advantage lies in seamless integration, low transaction fees, and a superior user experience, catering to the growing demand for instant and secure digital transactions across all consumer touchpoints.
Key Drivers, Barriers & Challenges in Australia Payments Industry
Key Drivers: The Australian payments industry is propelled by several significant forces. Technologically, the widespread adoption of smartphones and the continuous innovation in digital payment solutions are paramount. Economic drivers include increasing consumer disposable income and a robust e-commerce sector. Policy-driven factors, such as government initiatives promoting cashless societies and regulatory reforms aimed at fostering competition, also play a crucial role. For example, the RBA's New Payments Platform (NPP) has facilitated real-time payments, enhancing efficiency.
Barriers & Challenges: Despite positive growth, the industry faces hurdles. Regulatory complexities and evolving compliance requirements present ongoing challenges. Cybersecurity threats and the risk of data breaches necessitate continuous investment in security infrastructure. Furthermore, the high cost of transaction processing for some payment methods and the persistent digital divide, impacting access for certain demographics, remain significant restraints. Competitive pressures from new market entrants also demand constant adaptation and innovation.
Growth Drivers in the Australia Payments Industry Market
The Australia Payments Industry market's growth is primarily fueled by technological advancements, economic stability, and supportive regulatory frameworks. The ubiquitous adoption of smartphones and the rapid evolution of digital payment technologies, such as mobile wallets and contactless solutions, are key enablers. Economically, increasing consumer confidence and a thriving e-commerce sector provide a fertile ground for transaction growth. Regulatory initiatives, including the RBA's focus on a more competitive payments landscape and the expansion of the New Payments Platform (NPP), are driving efficiency and innovation. Furthermore, the increasing demand for instant payment solutions and cross-border payment services presents significant opportunities.
Challenges Impacting Australia Payments Industry Growth
Several challenges impact the Australia Payments Industry's growth trajectory. Regulatory complexities and evolving compliance standards necessitate continuous adaptation and investment. The persistent threat of cyberattacks and the imperative for robust data security measures represent a significant operational and financial challenge. Additionally, the cost of transaction processing for certain payment methods, particularly for small businesses, can act as a restraint, while the digital divide limits accessibility for some consumer segments. Intensifying competition also pressures margins and requires constant innovation to maintain market relevance.
Key Players Shaping the Australia Payments Industry Market
Key players actively shaping the Australia Payments Industry market include:
- Pin Payments
- Secure Pay
- Mastercard
- Amazon Pay
- 2Checkout
- Google Pay
- Visa
- eway
- WorldPay
- Square
Significant Australia Payments Industry Industry Milestones
- 2019: Increased adoption of EMV chip technology across the card payments ecosystem, enhancing security.
- 2020: Significant surge in contactless payments and digital wallet usage due to the COVID-19 pandemic.
- 2021: Expansion of Buy Now, Pay Later (BNPL) services into mainstream retail and further regulatory discussions on BNPL oversight.
- 2022: Continued investment and growth in real-time payment solutions via the New Payments Platform (NPP).
- 2023: Focus on enhancing cybersecurity measures and combating payment fraud across all digital channels.
- 2024: Growing interest and initial implementations of embedded finance solutions within various industries.
Future Outlook for Australia Payments Industry Market
The future outlook for the Australian payments industry is exceptionally promising, driven by continuous digital transformation and evolving consumer expectations. Strategic opportunities lie in further integrating AI for personalized payment experiences and advanced fraud detection, expanding the reach of real-time payment networks, and developing innovative solutions for previously underserved sectors like small businesses and rural communities. The growing adoption of digital identity solutions and the potential impact of central bank digital currencies (CBDCs) will also shape market dynamics. Anticipate a sustained shift towards mobile-first payment strategies and the increasing demand for seamless, integrated payment experiences across all touchpoints.
Australia Payments Industry Segmentation
-
1. Mode of Payment
-
1.1. Point of Sale
- 1.1.1. Card Pay
- 1.1.2. Digital Wallet (includes Mobile Wallets)
- 1.1.3. Cash
- 1.1.4. Others
-
1.2. Online Sale
- 1.2.1. Others (
-
1.1. Point of Sale
-
2. End-user Industry
- 2.1. Retail
- 2.2. Entertainment
- 2.3. Healthcare
- 2.4. Hospitality
- 2.5. Other End-user Industries
Australia Payments Industry Segmentation By Geography
- 1. Australia
Australia Payments Industry Regional Market Share
Geographic Coverage of Australia Payments Industry
Australia Payments Industry REPORT HIGHLIGHTS
| Aspects | Details |
|---|---|
| Study Period | 2020-2034 |
| Base Year | 2025 |
| Estimated Year | 2026 |
| Forecast Period | 2026-2034 |
| Historical Period | 2020-2025 |
| Growth Rate | CAGR of 16.44% from 2020-2034 |
| Segmentation |
|
Table of Contents
- 1. Introduction
- 1.1. Research Scope
- 1.2. Market Segmentation
- 1.3. Research Objective
- 1.4. Definitions and Assumptions
- 2. Executive Summary
- 2.1. Market Snapshot
- 3. Market Dynamics
- 3.1. Market Drivers
- 3.2. Market Restrains
- 3.3. Market Trends
- 3.4. Market Opportunities
- 4. Market Factor Analysis
- 4.1. Porters Five Forces
- 4.1.1. Bargaining Power of Suppliers
- 4.1.2. Bargaining Power of Buyers
- 4.1.3. Threat of New Entrants
- 4.1.4. Threat of Substitutes
- 4.1.5. Competitive Rivalry
- 4.2. PESTEL analysis
- 4.3. BCG Analysis
- 4.3.1. Stars (High Growth, High Market Share)
- 4.3.2. Cash Cows (Low Growth, High Market Share)
- 4.3.3. Question Mark (High Growth, Low Market Share)
- 4.3.4. Dogs (Low Growth, Low Market Share)
- 4.4. Ansoff Matrix Analysis
- 4.5. Supply Chain Analysis
- 4.6. Regulatory Landscape
- 4.7. Current Market Potential and Opportunity Assessment (TAM–SAM–SOM Framework)
- 4.8. TIR Analyst Note
- 4.1. Porters Five Forces
- 5. Market Analysis, Insights and Forecast 2021-2033
- 5.1. Market Analysis, Insights and Forecast - by Mode of Payment
- 5.1.1. Point of Sale
- 5.1.1.1. Card Pay
- 5.1.1.2. Digital Wallet (includes Mobile Wallets)
- 5.1.1.3. Cash
- 5.1.1.4. Others
- 5.1.2. Online Sale
- 5.1.2.1. Others (
- 5.1.1. Point of Sale
- 5.2. Market Analysis, Insights and Forecast - by End-user Industry
- 5.2.1. Retail
- 5.2.2. Entertainment
- 5.2.3. Healthcare
- 5.2.4. Hospitality
- 5.2.5. Other End-user Industries
- 5.3. Market Analysis, Insights and Forecast - by Region
- 5.3.1. Australia
- 5.1. Market Analysis, Insights and Forecast - by Mode of Payment
- 6. Australia Payments Industry Analysis, Insights and Forecast, 2021-2033
- 6.1. Market Analysis, Insights and Forecast - by Mode of Payment
- 6.1.1. Point of Sale
- 6.1.1.1. Card Pay
- 6.1.1.2. Digital Wallet (includes Mobile Wallets)
- 6.1.1.3. Cash
- 6.1.1.4. Others
- 6.1.2. Online Sale
- 6.1.2.1. Others (
- 6.1.1. Point of Sale
- 6.2. Market Analysis, Insights and Forecast - by End-user Industry
- 6.2.1. Retail
- 6.2.2. Entertainment
- 6.2.3. Healthcare
- 6.2.4. Hospitality
- 6.2.5. Other End-user Industries
- 6.1. Market Analysis, Insights and Forecast - by Mode of Payment
- 7. Competitive Analysis
- 7.1. Company Profiles
- 7.1.1 Pin Payments
- 7.1.1.1. Company Overview
- 7.1.1.2. Products
- 7.1.1.3. Company Financials
- 7.1.1.4. SWOT Analysis
- 7.1.2 Secure Pay
- 7.1.2.1. Company Overview
- 7.1.2.2. Products
- 7.1.2.3. Company Financials
- 7.1.2.4. SWOT Analysis
- 7.1.3 Mastercard
- 7.1.3.1. Company Overview
- 7.1.3.2. Products
- 7.1.3.3. Company Financials
- 7.1.3.4. SWOT Analysis
- 7.1.4 Amazon Pay
- 7.1.4.1. Company Overview
- 7.1.4.2. Products
- 7.1.4.3. Company Financials
- 7.1.4.4. SWOT Analysis
- 7.1.5 2Checkout
- 7.1.5.1. Company Overview
- 7.1.5.2. Products
- 7.1.5.3. Company Financials
- 7.1.5.4. SWOT Analysis
- 7.1.6 Google Pay
- 7.1.6.1. Company Overview
- 7.1.6.2. Products
- 7.1.6.3. Company Financials
- 7.1.6.4. SWOT Analysis
- 7.1.7 Visa*List Not Exhaustive
- 7.1.7.1. Company Overview
- 7.1.7.2. Products
- 7.1.7.3. Company Financials
- 7.1.7.4. SWOT Analysis
- 7.1.8 eway
- 7.1.8.1. Company Overview
- 7.1.8.2. Products
- 7.1.8.3. Company Financials
- 7.1.8.4. SWOT Analysis
- 7.1.9 WorldPay
- 7.1.9.1. Company Overview
- 7.1.9.2. Products
- 7.1.9.3. Company Financials
- 7.1.9.4. SWOT Analysis
- 7.1.10 Square
- 7.1.10.1. Company Overview
- 7.1.10.2. Products
- 7.1.10.3. Company Financials
- 7.1.10.4. SWOT Analysis
- 7.1.1 Pin Payments
- 7.2. Market Entropy
- 7.2.1 Company's Key Areas Served
- 7.2.2 Recent Developments
- 7.3. Company Market Share Analysis 2025
- 7.3.1 Top 5 Companies Market Share Analysis
- 7.3.2 Top 3 Companies Market Share Analysis
- 7.4. List of Potential Customers
- 8. Research Methodology
List of Figures
- Figure 1: Australia Payments Industry Revenue Breakdown (Million, %) by Product 2025 & 2033
- Figure 2: Australia Payments Industry Share (%) by Company 2025
List of Tables
- Table 1: Australia Payments Industry Revenue Million Forecast, by Mode of Payment 2020 & 2033
- Table 2: Australia Payments Industry Revenue Million Forecast, by End-user Industry 2020 & 2033
- Table 3: Australia Payments Industry Revenue Million Forecast, by Region 2020 & 2033
- Table 4: Australia Payments Industry Revenue Million Forecast, by Mode of Payment 2020 & 2033
- Table 5: Australia Payments Industry Revenue Million Forecast, by End-user Industry 2020 & 2033
- Table 6: Australia Payments Industry Revenue Million Forecast, by Country 2020 & 2033
Frequently Asked Questions
1. What is the projected Compound Annual Growth Rate (CAGR) of the Australia Payments Industry?
The projected CAGR is approximately 16.44%.
2. Which companies are prominent players in the Australia Payments Industry?
Key companies in the market include Pin Payments, Secure Pay, Mastercard, Amazon Pay, 2Checkout, Google Pay, Visa*List Not Exhaustive, eway, WorldPay, Square.
3. What are the main segments of the Australia Payments Industry?
The market segments include Mode of Payment, End-user Industry.
4. Can you provide details about the market size?
The market size is estimated to be USD 0.92 Million as of 2022.
5. What are some drivers contributing to market growth?
High Proliferation of E-commerce. including the rise of m-commerce and cross-border e-commerce supported by the increase in purchasing power; Enablement Programs by Key Retailers and Government encouraging digitization of the market; Growth of Real-time Payments in Germany.
6. What are the notable trends driving market growth?
E-Commerce Segment is Anticipated to Witness Significant Growth.
7. Are there any restraints impacting market growth?
; Threat to Security of Fingerprint Data Within the System; Limitations of the Technology Leading to Breaches.
8. Can you provide examples of recent developments in the market?
N/A
9. What pricing options are available for accessing the report?
Pricing options include single-user, multi-user, and enterprise licenses priced at USD 3800, USD 4500, and USD 5800 respectively.
10. Is the market size provided in terms of value or volume?
The market size is provided in terms of value, measured in Million.
11. Are there any specific market keywords associated with the report?
Yes, the market keyword associated with the report is "Australia Payments Industry," which aids in identifying and referencing the specific market segment covered.
12. How do I determine which pricing option suits my needs best?
The pricing options vary based on user requirements and access needs. Individual users may opt for single-user licenses, while businesses requiring broader access may choose multi-user or enterprise licenses for cost-effective access to the report.
13. Are there any additional resources or data provided in the Australia Payments Industry report?
While the report offers comprehensive insights, it's advisable to review the specific contents or supplementary materials provided to ascertain if additional resources or data are available.
14. How can I stay updated on further developments or reports in the Australia Payments Industry?
To stay informed about further developments, trends, and reports in the Australia Payments Industry, consider subscribing to industry newsletters, following relevant companies and organizations, or regularly checking reputable industry news sources and publications.
Methodology
Step 1 - Identification of Relevant Samples Size from Population Database


Step 2 - Approaches for Defining Global Market Size (Value, Volume* & Price*)

Note*: In applicable scenarios
Step 3 - Data Sources
Primary Research
- Web Analytics
- Survey Reports
- Research Institute
- Latest Research Reports
- Opinion Leaders
Secondary Research
- Annual Reports
- White Paper
- Latest Press Release
- Industry Association
- Paid Database
- Investor Presentations

Step 4 - Data Triangulation
Involves using different sources of information in order to increase the validity of a study
These sources are likely to be stakeholders in a program - participants, other researchers, program staff, other community members, and so on.
Then we put all data in single framework & apply various statistical tools to find out the dynamic on the market.
During the analysis stage, feedback from the stakeholder groups would be compared to determine areas of agreement as well as areas of divergence