

Key Insights
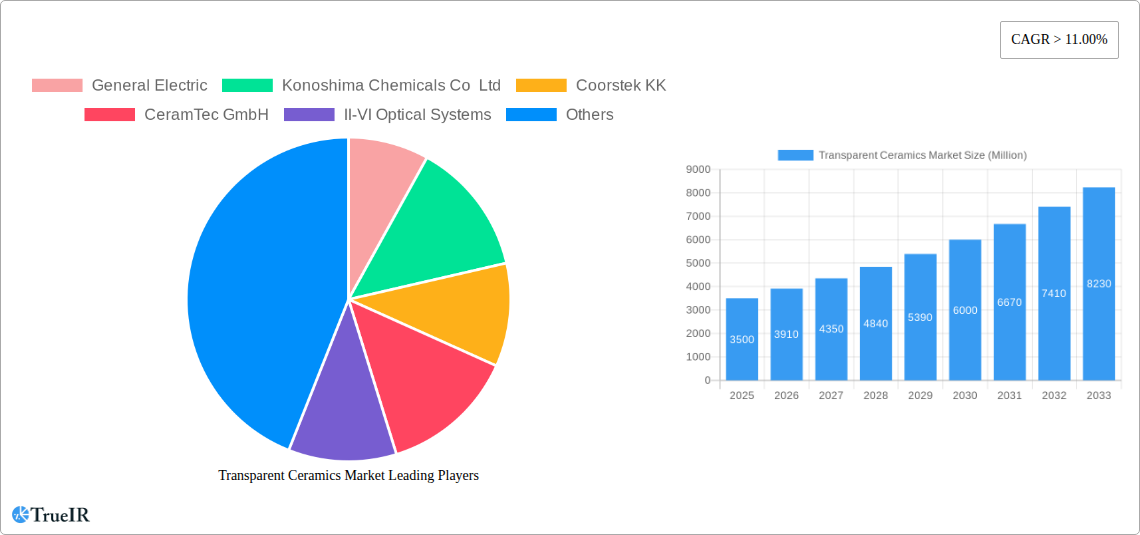
The global Transparent Ceramics Market is experiencing robust expansion, driven by its unique properties and increasing adoption across diverse high-growth industries. With a projected market size of approximately USD 3.5 billion in 2025, the market is poised for substantial growth, exhibiting a Compound Annual Growth Rate (CAGR) exceeding 11.00% through 2033. This remarkable trajectory is fueled by advancements in material science, enabling the development of transparent ceramics with superior strength, hardness, and thermal resistance compared to traditional glass and plastics. Key drivers include the escalating demand for lightweight and durable components in aerospace and defense, where transparent ceramics are utilized in advanced sensor windows, radomes, and viewport applications, offering enhanced performance and survivability. The healthcare sector also presents significant opportunities, with applications in medical imaging, surgical instruments, and biocompatible implants benefiting from the material's clarity, inertness, and strength. Furthermore, the expanding consumer electronics market, with its demand for scratch-resistant and high-performance displays, is a notable growth catalyst.
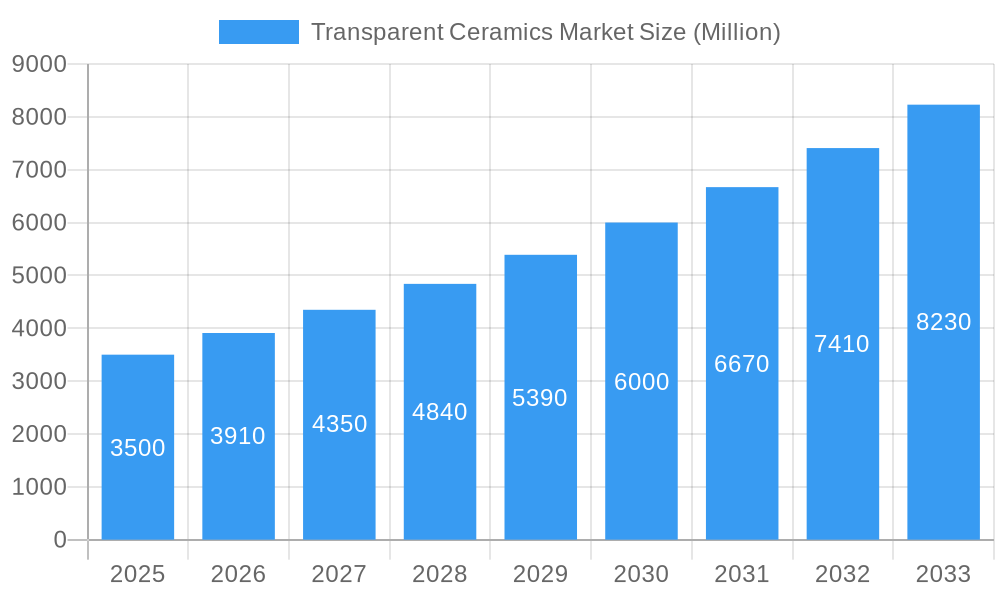
Transparent Ceramics Market Market Size (In Billion)
The market is segmented by structure into Crystalline and Non-crystalline forms, with Yttrium Aluminum Garnet (YAG) and Sapphire emerging as dominant materials due to their exceptional optical and mechanical properties. Aluminum Oxynitride (ALON) and Yttria-stabilized zirconia (YSZ) are also gaining traction for specialized applications. Geographically, the Asia Pacific region, led by China and Japan, is expected to dominate the market, owing to a strong manufacturing base and increasing investments in advanced materials research and development. North America and Europe are also significant markets, driven by robust R&D initiatives and the presence of key players like General Electric and Saint-Gobain Group. However, the market faces certain restraints, including the high cost of production and complex manufacturing processes associated with certain transparent ceramic materials, which can limit their widespread adoption in price-sensitive applications. Nevertheless, ongoing innovation in manufacturing techniques and material composition is expected to mitigate these challenges, paving the way for continued market penetration.
Transparent Ceramics Market Company Market Share
This comprehensive report offers an in-depth analysis of the global Transparent Ceramics Market, a rapidly evolving sector driven by advancements in material science and expanding application areas. Our study covers the historical period from 2019 to 2024, with the base year of 2025 and an estimated value for 2025. The forecast period extends from 2025 to 2033, providing valuable insights into future market trajectories.
Transparent Ceramics Market Market Structure & Competitive Landscape
The transparent ceramics market exhibits a moderately concentrated structure, with key players investing heavily in research and development to achieve superior material properties and novel applications. Innovation drivers are primarily focused on enhancing optical clarity, mechanical strength, thermal resistance, and cost-effectiveness across various materials like sapphire, YAG, and aluminum oxynitride. Regulatory impacts are generally favorable, supporting advancements in high-tech industries such as aerospace, defense, and healthcare, which are significant end-users. Product substitutes, while present in some niche applications, struggle to match the unique combination of properties offered by transparent ceramics. The competitive landscape is shaped by strategic alliances, mergers, and acquisitions aimed at expanding product portfolios, technological capabilities, and market reach. For instance, M&A activities in recent years have focused on consolidating expertise in specialized material processing and application development. Key players are General Electric, Konoshima Chemicals Co Ltd, Coorstek KK, CeramTec GmbH, II-VI Optical Systems, Koninklijke Philips N V, Surmet Corporation, Saint-Gobain Group, Cilas, www optocity com, CeraNova, Deisenroth Engineering GmbH, AGC Inc, and SCHOTT AG. These companies are actively pursuing market share through product differentiation and targeted application development.
Transparent Ceramics Market Market Trends & Opportunities
The transparent ceramics market is poised for significant growth, projected to expand at a robust Compound Annual Growth Rate (CAGR) of approximately 12.5% from 2025 to 2033. This expansion is fueled by a confluence of technological advancements, increasing demand from high-growth application sectors, and a growing awareness of the unique benefits offered by these advanced materials. The market size is estimated to reach over $4,500 Million by 2033. Technological shifts are central to this growth, with continuous improvements in manufacturing processes leading to enhanced optical properties, greater durability, and reduced production costs. This enables the wider adoption of transparent ceramics in demanding environments.
Consumer preferences are subtly influencing market dynamics, particularly in sectors like consumer electronics and automotive, where there is a demand for more robust, aesthetically pleasing, and high-performance components. The drive for miniaturization and enhanced functionality in devices creates new opportunities for transparent ceramic components, such as camera lenses, protective windows, and advanced display technologies.
The competitive landscape is characterized by intense innovation and strategic collaborations. Companies are actively investing in R&D to develop new formulations and manufacturing techniques that cater to specific end-user requirements. The emergence of novel applications, particularly in the healthcare sector for medical implants and diagnostic equipment, and in the aerospace and defense industry for high-performance optical systems and protective components, presents substantial growth opportunities. Furthermore, the energy sector, with its increasing focus on efficient and durable components for renewable energy technologies, is also becoming a significant market for transparent ceramics.
The increasing penetration of transparent ceramics into emerging markets, driven by industrialization and technological adoption, further bolsters market growth. Opportunities abound for manufacturers who can offer customized solutions, ensure consistent quality, and maintain competitive pricing. The development of new material compositions with tailored properties, such as increased hardness or specific refractive indices, will continue to unlock new application areas and drive market expansion. The overall trend indicates a sustained upward trajectory for the transparent ceramics market, presenting a fertile ground for investment and innovation.
Dominant Markets & Segments in Transparent Ceramics Market
The transparent ceramics market is characterized by distinct regional and segmental dominance, driven by specific industrial needs and technological advancements.
Material Dominance:
- Sapphire: Continues to be a leading material, dominating the market due to its exceptional hardness, optical clarity, and chemical inertness. Its widespread application in aerospace and defense, consumer electronics (smartphone screens, watch crystals), and high-end optical systems underpins its significant market share. The demand for robust and scratch-resistant surfaces in these sectors directly translates to sapphire's sustained leadership.
- Yttrium Aluminum Garnet (YAG): Demonstrates strong growth, particularly in laser applications and specialized optical components for defense and industrial settings. Its favorable optical properties and ability to withstand high-power laser radiation make it indispensable in these fields.
- Aluminum Oxynitride (ALON): Is rapidly gaining traction, especially in defense applications requiring lightweight, high-strength, and transparent armor solutions. Its superior ballistic protection capabilities are a key growth driver, positioning it as a critical material for military applications.
- Yttria-stabilized zirconia (YSZ): While not as optically clear as sapphire or YAG, YSZ is finding increasing use in applications where a combination of transparency, mechanical strength, and thermal insulation is required, such as in certain types of sensors and optical windows.
Application Dominance:
- Aerospace and Defense: This segment is a cornerstone of the transparent ceramics market. The stringent requirements for optical clarity, extreme durability, and resistance to harsh environments in aircraft canopies, missile domes, and advanced sensor windows drive significant demand. Investment in next-generation defense systems and space exploration further solidifies this segment's leading position.
- Healthcare: The use of transparent ceramics in medical implants, surgical instruments, diagnostic imaging equipment, and drug delivery systems is a rapidly expanding application area. Biocompatibility, sterilizability, and high optical precision are key factors contributing to its growth.
- Consumer Goods: While not the largest segment, it represents a significant growth opportunity, particularly in premium electronics like smartphone displays, smartwatch screens, and high-end camera lenses where enhanced scratch resistance and optical quality are valued.
Regional Dominance:
- North America and Europe: These regions currently dominate the transparent ceramics market due to the presence of advanced research institutions, strong aerospace and defense industries, and significant healthcare expenditure. High investment in technological innovation and the presence of key manufacturing hubs contribute to their leadership.
- Asia Pacific: Is emerging as a high-growth region, driven by the expanding manufacturing sector, increasing adoption of advanced technologies in electronics and automotive, and growing defense spending. Countries like China and Japan are key contributors to this growth.
The dominance of these segments is further amplified by supportive government policies, infrastructure development, and the relentless pursuit of technological superiority by industry leaders.
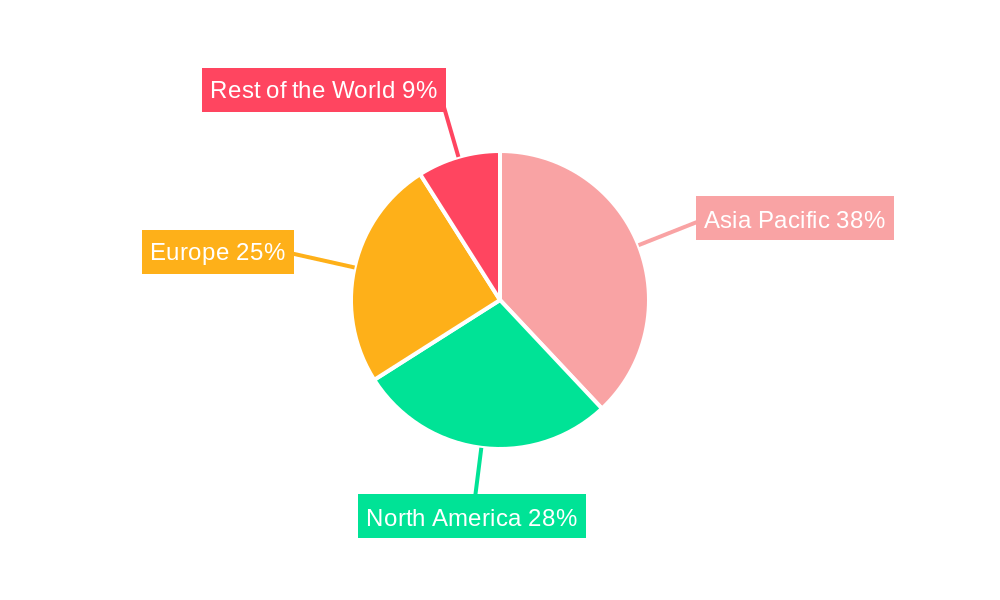
Transparent Ceramics Market Regional Market Share
Transparent Ceramics Market Product Analysis
The transparent ceramics market is characterized by continuous product innovation, with a focus on enhancing optical transmission, mechanical resilience, and thermal stability. Advancements in material science have led to the development of new ceramic compositions, such as enhanced sapphire grades with superior UV resistance and specialized ALON variants offering improved ballistic performance. Applications are expanding beyond traditional optical windows and lenses to include cutting-edge uses in solid-state lighting, advanced sensor protection, laser components, and even biological imaging. The competitive advantage lies in achieving a unique balance of transparency, hardness, and temperature resistance, enabling products to perform reliably in extreme environments where conventional glass or plastics fail. These technological advancements are crucial for penetrating high-value markets like aerospace, defense, and healthcare.
Key Drivers, Barriers & Challenges in Transparent Ceramics Market
The transparent ceramics market is propelled by several key drivers. Technologically, advancements in sintering techniques, such as Spark Plasma Sintering (SPS), enable the production of denser, more transparent ceramics with superior mechanical properties. The growing demand for lightweight yet robust materials in aerospace and defense, coupled with the increasing sophistication of healthcare devices requiring biocompatible and sterile components, are significant market accelerators. Furthermore, the development of novel applications in energy, such as transparent conductive oxides for solar cells, presents new avenues for growth.
However, the market faces considerable barriers and challenges. High manufacturing costs associated with complex processing steps and specialized equipment remain a primary restraint. The availability of competitive substitutes, particularly in less demanding applications, can limit market penetration. Furthermore, stringent quality control requirements and the need for specialized expertise in handling and fabricating these advanced materials pose logistical challenges. Supply chain disruptions and the fluctuating costs of raw materials can also impact profitability and market stability.
Growth Drivers in the Transparent Ceramics Market Market
Growth in the transparent ceramics market is primarily fueled by the relentless pursuit of enhanced performance in critical industries. Technological advancements in material processing, leading to improved optical clarity, mechanical strength, and thermal resistance, are paramount. The aerospace and defense sectors are significant growth drivers, demanding lightweight, durable materials for applications like missile domes, aircraft windows, and advanced sensor systems. The healthcare industry's increasing adoption of transparent ceramics for biocompatible implants, surgical tools, and diagnostic equipment, where sterilization and precise optical properties are essential, further boosts market expansion. Emerging applications in consumer electronics, such as scratch-resistant smartphone displays and high-performance camera lenses, also contribute to this growth trajectory.
Challenges Impacting Transparent Ceramics Market Growth
Despite its promising outlook, the transparent ceramics market grapples with several significant challenges. The high cost of raw materials and the intricate, energy-intensive manufacturing processes contribute to the overall expense of these advanced materials, making them less accessible for broader adoption in cost-sensitive applications. Furthermore, the specialized nature of their fabrication requires highly skilled labor and sophisticated equipment, creating a barrier to entry for new players and limiting production scalability. The availability of alternative materials, while often with compromised performance, can still pose a competitive threat in certain market segments. Regulatory hurdles related to material certification and standardization in specific industries, particularly aerospace and healthcare, can also slow down market penetration and require extensive validation processes.
Key Players Shaping the Transparent Ceramics Market Market
- General Electric
- Konoshima Chemicals Co Ltd
- Coorstek KK
- CeramTec GmbH
- II-VI Optical Systems
- Koninklijke Philips N V
- Surmet Corporation
- Saint-Gobain Group
- Cilas
- www optocity com
- CeraNova
- Deisenroth Engineering GmbH
- AGC Inc
- SCHOTT AG
Significant Transparent Ceramics Market Industry Milestones
- 2019: Increased adoption of Sapphire in premium smartphone screen protection, driving material demand.
- 2020: Development of advanced ALON formulations for lightweight ballistic protection in defense applications.
- 2021: Expansion of YAG ceramic applications in high-power laser systems for industrial manufacturing.
- 2022: Key partnerships formed between transparent ceramic manufacturers and leading aerospace companies for next-generation aircraft components.
- 2023: Introduction of new ceramic materials with enhanced thermal conductivity for energy sector applications.
- 2024: Growing investment in R&D for transparent ceramics in advanced medical imaging and diagnostics.
Future Outlook for Transparent Ceramics Market Market
The future outlook for the transparent ceramics market is exceptionally bright, driven by sustained innovation and the expansion of applications into new and existing high-growth sectors. Strategic opportunities lie in the continued development of novel ceramic compositions with tailored properties, enabling their use in increasingly demanding environments. The growing emphasis on miniaturization and enhanced performance in electronics and the ongoing advancements in medical technology are expected to be significant catalysts. Furthermore, the increasing global focus on sustainable energy solutions and advanced defense capabilities will continue to create substantial demand for these high-performance materials. Market players who can focus on cost optimization, scalability, and customized solutions are well-positioned for substantial growth.
Transparent Ceramics Market Segmentation
-
1. Structure
- 1.1. Crystalline
- 1.2. Non-crystalline
-
2. Material
- 2.1. Sapphire
- 2.2. Yttrium Aluminum Garnet (YAG)
- 2.3. Aluminum Oxynitride
- 2.4. Yttria-stabilized zirconia (YSZ)
- 2.5. Spinel
- 2.6. Other Materials
-
3. Application
- 3.1. Aerospace and Defense
- 3.2. Mechanical and Chemical
- 3.3. Healthcare
- 3.4. Consumer Goods
- 3.5. Energy
- 3.6. Other Applications
Transparent Ceramics Market Segmentation By Geography
-
1. Asia Pacific
- 1.1. China
- 1.2. India
- 1.3. Japan
- 1.4. South Korea
- 1.5. Australia
- 2. Rest of Asia Pacific
-
3. North America
- 3.1. United States
- 3.2. Canada
- 3.3. Mexico
- 3.4. Rest of North America
-
4. Europe
- 4.1. Germany
- 4.2. United Kingdom
- 4.3. Italy
- 4.4. France
- 4.5. Rest of Europe
-
5. South America
- 5.1. Brazil
- 5.2. Argentina
- 5.3. Rest of South America
-
6. Middle East and Africa
- 6.1. Saudi Arabia
- 6.2. South Africa
- 6.3. Rest of Middle East and Africa
Transparent Ceramics Market Regional Market Share
Geographic Coverage of Transparent Ceramics Market
Transparent Ceramics Market REPORT HIGHLIGHTS
| Aspects | Details |
|---|---|
| Study Period | 2020-2034 |
| Base Year | 2025 |
| Estimated Year | 2026 |
| Forecast Period | 2026-2034 |
| Historical Period | 2020-2025 |
| Growth Rate | CAGR of 17.6% from 2020-2034 |
| Segmentation |
|
Table of Contents
- 1. Introduction
- 1.1. Research Scope
- 1.2. Market Segmentation
- 1.3. Research Objective
- 1.4. Definitions and Assumptions
- 2. Executive Summary
- 2.1. Market Snapshot
- 3. Market Dynamics
- 3.1. Market Drivers
- 3.2. Market Restrains
- 3.3. Market Trends
- 3.4. Market Opportunities
- 4. Market Factor Analysis
- 4.1. Porters Five Forces
- 4.1.1. Bargaining Power of Suppliers
- 4.1.2. Bargaining Power of Buyers
- 4.1.3. Threat of New Entrants
- 4.1.4. Threat of Substitutes
- 4.1.5. Competitive Rivalry
- 4.2. PESTEL analysis
- 4.3. BCG Analysis
- 4.3.1. Stars (High Growth, High Market Share)
- 4.3.2. Cash Cows (Low Growth, High Market Share)
- 4.3.3. Question Mark (High Growth, Low Market Share)
- 4.3.4. Dogs (Low Growth, Low Market Share)
- 4.4. Ansoff Matrix Analysis
- 4.5. Supply Chain Analysis
- 4.6. Regulatory Landscape
- 4.7. Current Market Potential and Opportunity Assessment (TAM–SAM–SOM Framework)
- 4.8. TIR Analyst Note
- 4.1. Porters Five Forces
- 5. Market Analysis, Insights and Forecast 2021-2033
- 5.1. Market Analysis, Insights and Forecast - by Structure
- 5.1.1. Crystalline
- 5.1.2. Non-crystalline
- 5.2. Market Analysis, Insights and Forecast - by Material
- 5.2.1. Sapphire
- 5.2.2. Yttrium Aluminum Garnet (YAG)
- 5.2.3. Aluminum Oxynitride
- 5.2.4. Yttria-stabilized zirconia (YSZ)
- 5.2.5. Spinel
- 5.2.6. Other Materials
- 5.3. Market Analysis, Insights and Forecast - by Application
- 5.3.1. Aerospace and Defense
- 5.3.2. Mechanical and Chemical
- 5.3.3. Healthcare
- 5.3.4. Consumer Goods
- 5.3.5. Energy
- 5.3.6. Other Applications
- 5.4. Market Analysis, Insights and Forecast - by Region
- 5.4.1. Asia Pacific
- 5.4.2. Rest of Asia Pacific
- 5.4.3. North America
- 5.4.4. Europe
- 5.4.5. South America
- 5.4.6. Middle East and Africa
- 5.1. Market Analysis, Insights and Forecast - by Structure
- 6. Global Transparent Ceramics Market Analysis, Insights and Forecast, 2021-2033
- 6.1. Market Analysis, Insights and Forecast - by Structure
- 6.1.1. Crystalline
- 6.1.2. Non-crystalline
- 6.2. Market Analysis, Insights and Forecast - by Material
- 6.2.1. Sapphire
- 6.2.2. Yttrium Aluminum Garnet (YAG)
- 6.2.3. Aluminum Oxynitride
- 6.2.4. Yttria-stabilized zirconia (YSZ)
- 6.2.5. Spinel
- 6.2.6. Other Materials
- 6.3. Market Analysis, Insights and Forecast - by Application
- 6.3.1. Aerospace and Defense
- 6.3.2. Mechanical and Chemical
- 6.3.3. Healthcare
- 6.3.4. Consumer Goods
- 6.3.5. Energy
- 6.3.6. Other Applications
- 6.1. Market Analysis, Insights and Forecast - by Structure
- 7. Asia Pacific Transparent Ceramics Market Analysis, Insights and Forecast, 2020-2032
- 7.1. Market Analysis, Insights and Forecast - by Structure
- 7.1.1. Crystalline
- 7.1.2. Non-crystalline
- 7.2. Market Analysis, Insights and Forecast - by Material
- 7.2.1. Sapphire
- 7.2.2. Yttrium Aluminum Garnet (YAG)
- 7.2.3. Aluminum Oxynitride
- 7.2.4. Yttria-stabilized zirconia (YSZ)
- 7.2.5. Spinel
- 7.2.6. Other Materials
- 7.3. Market Analysis, Insights and Forecast - by Application
- 7.3.1. Aerospace and Defense
- 7.3.2. Mechanical and Chemical
- 7.3.3. Healthcare
- 7.3.4. Consumer Goods
- 7.3.5. Energy
- 7.3.6. Other Applications
- 7.1. Market Analysis, Insights and Forecast - by Structure
- 8. Rest of Asia Pacific Transparent Ceramics Market Analysis, Insights and Forecast, 2020-2032
- 8.1. Market Analysis, Insights and Forecast - by Structure
- 8.1.1. Crystalline
- 8.1.2. Non-crystalline
- 8.2. Market Analysis, Insights and Forecast - by Material
- 8.2.1. Sapphire
- 8.2.2. Yttrium Aluminum Garnet (YAG)
- 8.2.3. Aluminum Oxynitride
- 8.2.4. Yttria-stabilized zirconia (YSZ)
- 8.2.5. Spinel
- 8.2.6. Other Materials
- 8.3. Market Analysis, Insights and Forecast - by Application
- 8.3.1. Aerospace and Defense
- 8.3.2. Mechanical and Chemical
- 8.3.3. Healthcare
- 8.3.4. Consumer Goods
- 8.3.5. Energy
- 8.3.6. Other Applications
- 8.1. Market Analysis, Insights and Forecast - by Structure
- 9. North America Transparent Ceramics Market Analysis, Insights and Forecast, 2020-2032
- 9.1. Market Analysis, Insights and Forecast - by Structure
- 9.1.1. Crystalline
- 9.1.2. Non-crystalline
- 9.2. Market Analysis, Insights and Forecast - by Material
- 9.2.1. Sapphire
- 9.2.2. Yttrium Aluminum Garnet (YAG)
- 9.2.3. Aluminum Oxynitride
- 9.2.4. Yttria-stabilized zirconia (YSZ)
- 9.2.5. Spinel
- 9.2.6. Other Materials
- 9.3. Market Analysis, Insights and Forecast - by Application
- 9.3.1. Aerospace and Defense
- 9.3.2. Mechanical and Chemical
- 9.3.3. Healthcare
- 9.3.4. Consumer Goods
- 9.3.5. Energy
- 9.3.6. Other Applications
- 9.1. Market Analysis, Insights and Forecast - by Structure
- 10. Europe Transparent Ceramics Market Analysis, Insights and Forecast, 2020-2032
- 10.1. Market Analysis, Insights and Forecast - by Structure
- 10.1.1. Crystalline
- 10.1.2. Non-crystalline
- 10.2. Market Analysis, Insights and Forecast - by Material
- 10.2.1. Sapphire
- 10.2.2. Yttrium Aluminum Garnet (YAG)
- 10.2.3. Aluminum Oxynitride
- 10.2.4. Yttria-stabilized zirconia (YSZ)
- 10.2.5. Spinel
- 10.2.6. Other Materials
- 10.3. Market Analysis, Insights and Forecast - by Application
- 10.3.1. Aerospace and Defense
- 10.3.2. Mechanical and Chemical
- 10.3.3. Healthcare
- 10.3.4. Consumer Goods
- 10.3.5. Energy
- 10.3.6. Other Applications
- 10.1. Market Analysis, Insights and Forecast - by Structure
- 11. South America Transparent Ceramics Market Analysis, Insights and Forecast, 2020-2032
- 11.1. Market Analysis, Insights and Forecast - by Structure
- 11.1.1. Crystalline
- 11.1.2. Non-crystalline
- 11.2. Market Analysis, Insights and Forecast - by Material
- 11.2.1. Sapphire
- 11.2.2. Yttrium Aluminum Garnet (YAG)
- 11.2.3. Aluminum Oxynitride
- 11.2.4. Yttria-stabilized zirconia (YSZ)
- 11.2.5. Spinel
- 11.2.6. Other Materials
- 11.3. Market Analysis, Insights and Forecast - by Application
- 11.3.1. Aerospace and Defense
- 11.3.2. Mechanical and Chemical
- 11.3.3. Healthcare
- 11.3.4. Consumer Goods
- 11.3.5. Energy
- 11.3.6. Other Applications
- 11.1. Market Analysis, Insights and Forecast - by Structure
- 12. Middle East and Africa Transparent Ceramics Market Analysis, Insights and Forecast, 2020-2032
- 12.1. Market Analysis, Insights and Forecast - by Structure
- 12.1.1. Crystalline
- 12.1.2. Non-crystalline
- 12.2. Market Analysis, Insights and Forecast - by Material
- 12.2.1. Sapphire
- 12.2.2. Yttrium Aluminum Garnet (YAG)
- 12.2.3. Aluminum Oxynitride
- 12.2.4. Yttria-stabilized zirconia (YSZ)
- 12.2.5. Spinel
- 12.2.6. Other Materials
- 12.3. Market Analysis, Insights and Forecast - by Application
- 12.3.1. Aerospace and Defense
- 12.3.2. Mechanical and Chemical
- 12.3.3. Healthcare
- 12.3.4. Consumer Goods
- 12.3.5. Energy
- 12.3.6. Other Applications
- 12.1. Market Analysis, Insights and Forecast - by Structure
- 13. Competitive Analysis
- 13.1. Company Profiles
- 13.1.1 General Electric
- 13.1.1.1. Company Overview
- 13.1.1.2. Products
- 13.1.1.3. Company Financials
- 13.1.1.4. SWOT Analysis
- 13.1.2 Konoshima Chemicals Co Ltd
- 13.1.2.1. Company Overview
- 13.1.2.2. Products
- 13.1.2.3. Company Financials
- 13.1.2.4. SWOT Analysis
- 13.1.3 Coorstek KK
- 13.1.3.1. Company Overview
- 13.1.3.2. Products
- 13.1.3.3. Company Financials
- 13.1.3.4. SWOT Analysis
- 13.1.4 CeramTec GmbH
- 13.1.4.1. Company Overview
- 13.1.4.2. Products
- 13.1.4.3. Company Financials
- 13.1.4.4. SWOT Analysis
- 13.1.5 II-VI Optical Systems
- 13.1.5.1. Company Overview
- 13.1.5.2. Products
- 13.1.5.3. Company Financials
- 13.1.5.4. SWOT Analysis
- 13.1.6 Koninklijke Philips N V
- 13.1.6.1. Company Overview
- 13.1.6.2. Products
- 13.1.6.3. Company Financials
- 13.1.6.4. SWOT Analysis
- 13.1.7 Surmet Corporation*List Not Exhaustive
- 13.1.7.1. Company Overview
- 13.1.7.2. Products
- 13.1.7.3. Company Financials
- 13.1.7.4. SWOT Analysis
- 13.1.8 Saint-Gobain Group
- 13.1.8.1. Company Overview
- 13.1.8.2. Products
- 13.1.8.3. Company Financials
- 13.1.8.4. SWOT Analysis
- 13.1.9 Cilas
- 13.1.9.1. Company Overview
- 13.1.9.2. Products
- 13.1.9.3. Company Financials
- 13.1.9.4. SWOT Analysis
- 13.1.10 www optocity com
- 13.1.10.1. Company Overview
- 13.1.10.2. Products
- 13.1.10.3. Company Financials
- 13.1.10.4. SWOT Analysis
- 13.1.11 CeraNova
- 13.1.11.1. Company Overview
- 13.1.11.2. Products
- 13.1.11.3. Company Financials
- 13.1.11.4. SWOT Analysis
- 13.1.12 Deisenroth Engineering GmbH
- 13.1.12.1. Company Overview
- 13.1.12.2. Products
- 13.1.12.3. Company Financials
- 13.1.12.4. SWOT Analysis
- 13.1.13 AGC Inc
- 13.1.13.1. Company Overview
- 13.1.13.2. Products
- 13.1.13.3. Company Financials
- 13.1.13.4. SWOT Analysis
- 13.1.14 SCHOTT AG
- 13.1.14.1. Company Overview
- 13.1.14.2. Products
- 13.1.14.3. Company Financials
- 13.1.14.4. SWOT Analysis
- 13.1.1 General Electric
- 13.2. Market Entropy
- 13.2.1 Company's Key Areas Served
- 13.2.2 Recent Developments
- 13.3. Company Market Share Analysis 2025
- 13.3.1 Top 5 Companies Market Share Analysis
- 13.3.2 Top 3 Companies Market Share Analysis
- 13.4. List of Potential Customers
- 14. Research Methodology
List of Figures
- Figure 1: Global Transparent Ceramics Market Revenue Breakdown (million, %) by Region 2025 & 2033
- Figure 2: Asia Pacific Transparent Ceramics Market Revenue (million), by Structure 2025 & 2033
- Figure 3: Asia Pacific Transparent Ceramics Market Revenue Share (%), by Structure 2025 & 2033
- Figure 4: Asia Pacific Transparent Ceramics Market Revenue (million), by Material 2025 & 2033
- Figure 5: Asia Pacific Transparent Ceramics Market Revenue Share (%), by Material 2025 & 2033
- Figure 6: Asia Pacific Transparent Ceramics Market Revenue (million), by Application 2025 & 2033
- Figure 7: Asia Pacific Transparent Ceramics Market Revenue Share (%), by Application 2025 & 2033
- Figure 8: Asia Pacific Transparent Ceramics Market Revenue (million), by Country 2025 & 2033
- Figure 9: Asia Pacific Transparent Ceramics Market Revenue Share (%), by Country 2025 & 2033
- Figure 10: Rest of Asia Pacific Transparent Ceramics Market Revenue (million), by Structure 2025 & 2033
- Figure 11: Rest of Asia Pacific Transparent Ceramics Market Revenue Share (%), by Structure 2025 & 2033
- Figure 12: Rest of Asia Pacific Transparent Ceramics Market Revenue (million), by Material 2025 & 2033
- Figure 13: Rest of Asia Pacific Transparent Ceramics Market Revenue Share (%), by Material 2025 & 2033
- Figure 14: Rest of Asia Pacific Transparent Ceramics Market Revenue (million), by Application 2025 & 2033
- Figure 15: Rest of Asia Pacific Transparent Ceramics Market Revenue Share (%), by Application 2025 & 2033
- Figure 16: Rest of Asia Pacific Transparent Ceramics Market Revenue (million), by Country 2025 & 2033
- Figure 17: Rest of Asia Pacific Transparent Ceramics Market Revenue Share (%), by Country 2025 & 2033
- Figure 18: North America Transparent Ceramics Market Revenue (million), by Structure 2025 & 2033
- Figure 19: North America Transparent Ceramics Market Revenue Share (%), by Structure 2025 & 2033
- Figure 20: North America Transparent Ceramics Market Revenue (million), by Material 2025 & 2033
- Figure 21: North America Transparent Ceramics Market Revenue Share (%), by Material 2025 & 2033
- Figure 22: North America Transparent Ceramics Market Revenue (million), by Application 2025 & 2033
- Figure 23: North America Transparent Ceramics Market Revenue Share (%), by Application 2025 & 2033
- Figure 24: North America Transparent Ceramics Market Revenue (million), by Country 2025 & 2033
- Figure 25: North America Transparent Ceramics Market Revenue Share (%), by Country 2025 & 2033
- Figure 26: Europe Transparent Ceramics Market Revenue (million), by Structure 2025 & 2033
- Figure 27: Europe Transparent Ceramics Market Revenue Share (%), by Structure 2025 & 2033
- Figure 28: Europe Transparent Ceramics Market Revenue (million), by Material 2025 & 2033
- Figure 29: Europe Transparent Ceramics Market Revenue Share (%), by Material 2025 & 2033
- Figure 30: Europe Transparent Ceramics Market Revenue (million), by Application 2025 & 2033
- Figure 31: Europe Transparent Ceramics Market Revenue Share (%), by Application 2025 & 2033
- Figure 32: Europe Transparent Ceramics Market Revenue (million), by Country 2025 & 2033
- Figure 33: Europe Transparent Ceramics Market Revenue Share (%), by Country 2025 & 2033
- Figure 34: South America Transparent Ceramics Market Revenue (million), by Structure 2025 & 2033
- Figure 35: South America Transparent Ceramics Market Revenue Share (%), by Structure 2025 & 2033
- Figure 36: South America Transparent Ceramics Market Revenue (million), by Material 2025 & 2033
- Figure 37: South America Transparent Ceramics Market Revenue Share (%), by Material 2025 & 2033
- Figure 38: South America Transparent Ceramics Market Revenue (million), by Application 2025 & 2033
- Figure 39: South America Transparent Ceramics Market Revenue Share (%), by Application 2025 & 2033
- Figure 40: South America Transparent Ceramics Market Revenue (million), by Country 2025 & 2033
- Figure 41: South America Transparent Ceramics Market Revenue Share (%), by Country 2025 & 2033
- Figure 42: Middle East and Africa Transparent Ceramics Market Revenue (million), by Structure 2025 & 2033
- Figure 43: Middle East and Africa Transparent Ceramics Market Revenue Share (%), by Structure 2025 & 2033
- Figure 44: Middle East and Africa Transparent Ceramics Market Revenue (million), by Material 2025 & 2033
- Figure 45: Middle East and Africa Transparent Ceramics Market Revenue Share (%), by Material 2025 & 2033
- Figure 46: Middle East and Africa Transparent Ceramics Market Revenue (million), by Application 2025 & 2033
- Figure 47: Middle East and Africa Transparent Ceramics Market Revenue Share (%), by Application 2025 & 2033
- Figure 48: Middle East and Africa Transparent Ceramics Market Revenue (million), by Country 2025 & 2033
- Figure 49: Middle East and Africa Transparent Ceramics Market Revenue Share (%), by Country 2025 & 2033
List of Tables
- Table 1: Global Transparent Ceramics Market Revenue million Forecast, by Structure 2020 & 2033
- Table 2: Global Transparent Ceramics Market Revenue million Forecast, by Material 2020 & 2033
- Table 3: Global Transparent Ceramics Market Revenue million Forecast, by Application 2020 & 2033
- Table 4: Global Transparent Ceramics Market Revenue million Forecast, by Region 2020 & 2033
- Table 5: Global Transparent Ceramics Market Revenue million Forecast, by Structure 2020 & 2033
- Table 6: Global Transparent Ceramics Market Revenue million Forecast, by Material 2020 & 2033
- Table 7: Global Transparent Ceramics Market Revenue million Forecast, by Application 2020 & 2033
- Table 8: Global Transparent Ceramics Market Revenue million Forecast, by Country 2020 & 2033
- Table 9: China Transparent Ceramics Market Revenue (million) Forecast, by Application 2020 & 2033
- Table 10: India Transparent Ceramics Market Revenue (million) Forecast, by Application 2020 & 2033
- Table 11: Japan Transparent Ceramics Market Revenue (million) Forecast, by Application 2020 & 2033
- Table 12: South Korea Transparent Ceramics Market Revenue (million) Forecast, by Application 2020 & 2033
- Table 13: Australia Transparent Ceramics Market Revenue (million) Forecast, by Application 2020 & 2033
- Table 14: Global Transparent Ceramics Market Revenue million Forecast, by Structure 2020 & 2033
- Table 15: Global Transparent Ceramics Market Revenue million Forecast, by Material 2020 & 2033
- Table 16: Global Transparent Ceramics Market Revenue million Forecast, by Application 2020 & 2033
- Table 17: Global Transparent Ceramics Market Revenue million Forecast, by Country 2020 & 2033
- Table 18: Global Transparent Ceramics Market Revenue million Forecast, by Structure 2020 & 2033
- Table 19: Global Transparent Ceramics Market Revenue million Forecast, by Material 2020 & 2033
- Table 20: Global Transparent Ceramics Market Revenue million Forecast, by Application 2020 & 2033
- Table 21: Global Transparent Ceramics Market Revenue million Forecast, by Country 2020 & 2033
- Table 22: United States Transparent Ceramics Market Revenue (million) Forecast, by Application 2020 & 2033
- Table 23: Canada Transparent Ceramics Market Revenue (million) Forecast, by Application 2020 & 2033
- Table 24: Mexico Transparent Ceramics Market Revenue (million) Forecast, by Application 2020 & 2033
- Table 25: Rest of North America Transparent Ceramics Market Revenue (million) Forecast, by Application 2020 & 2033
- Table 26: Global Transparent Ceramics Market Revenue million Forecast, by Structure 2020 & 2033
- Table 27: Global Transparent Ceramics Market Revenue million Forecast, by Material 2020 & 2033
- Table 28: Global Transparent Ceramics Market Revenue million Forecast, by Application 2020 & 2033
- Table 29: Global Transparent Ceramics Market Revenue million Forecast, by Country 2020 & 2033
- Table 30: Germany Transparent Ceramics Market Revenue (million) Forecast, by Application 2020 & 2033
- Table 31: United Kingdom Transparent Ceramics Market Revenue (million) Forecast, by Application 2020 & 2033
- Table 32: Italy Transparent Ceramics Market Revenue (million) Forecast, by Application 2020 & 2033
- Table 33: France Transparent Ceramics Market Revenue (million) Forecast, by Application 2020 & 2033
- Table 34: Rest of Europe Transparent Ceramics Market Revenue (million) Forecast, by Application 2020 & 2033
- Table 35: Global Transparent Ceramics Market Revenue million Forecast, by Structure 2020 & 2033
- Table 36: Global Transparent Ceramics Market Revenue million Forecast, by Material 2020 & 2033
- Table 37: Global Transparent Ceramics Market Revenue million Forecast, by Application 2020 & 2033
- Table 38: Global Transparent Ceramics Market Revenue million Forecast, by Country 2020 & 2033
- Table 39: Brazil Transparent Ceramics Market Revenue (million) Forecast, by Application 2020 & 2033
- Table 40: Argentina Transparent Ceramics Market Revenue (million) Forecast, by Application 2020 & 2033
- Table 41: Rest of South America Transparent Ceramics Market Revenue (million) Forecast, by Application 2020 & 2033
- Table 42: Global Transparent Ceramics Market Revenue million Forecast, by Structure 2020 & 2033
- Table 43: Global Transparent Ceramics Market Revenue million Forecast, by Material 2020 & 2033
- Table 44: Global Transparent Ceramics Market Revenue million Forecast, by Application 2020 & 2033
- Table 45: Global Transparent Ceramics Market Revenue million Forecast, by Country 2020 & 2033
- Table 46: Saudi Arabia Transparent Ceramics Market Revenue (million) Forecast, by Application 2020 & 2033
- Table 47: South Africa Transparent Ceramics Market Revenue (million) Forecast, by Application 2020 & 2033
- Table 48: Rest of Middle East and Africa Transparent Ceramics Market Revenue (million) Forecast, by Application 2020 & 2033
Frequently Asked Questions
1. What is the projected Compound Annual Growth Rate (CAGR) of the Transparent Ceramics Market?
The projected CAGR is approximately 17.6%.
2. Which companies are prominent players in the Transparent Ceramics Market?
Key companies in the market include General Electric, Konoshima Chemicals Co Ltd, Coorstek KK, CeramTec GmbH, II-VI Optical Systems, Koninklijke Philips N V, Surmet Corporation*List Not Exhaustive, Saint-Gobain Group, Cilas, www optocity com, CeraNova, Deisenroth Engineering GmbH, AGC Inc, SCHOTT AG.
3. What are the main segments of the Transparent Ceramics Market?
The market segments include Structure, Material, Application.
4. Can you provide details about the market size?
The market size is estimated to be USD 782.62 million as of 2022.
5. What are some drivers contributing to market growth?
; Accelerating Usage in Optics and Optoelectronics; Increasing Demand in the Aerospace and Defense Sector; Advanced Ceramics Increasingly Replacing Plastics and Metals.
6. What are the notable trends driving market growth?
Increasing Demand from the Aerospace and Defense Sector.
7. Are there any restraints impacting market growth?
; High Cost; Other Restraints.
8. Can you provide examples of recent developments in the market?
N/A
9. What pricing options are available for accessing the report?
Pricing options include single-user, multi-user, and enterprise licenses priced at USD 4750, USD 5250, and USD 8750 respectively.
10. Is the market size provided in terms of value or volume?
The market size is provided in terms of value, measured in million.
11. Are there any specific market keywords associated with the report?
Yes, the market keyword associated with the report is "Transparent Ceramics Market," which aids in identifying and referencing the specific market segment covered.
12. How do I determine which pricing option suits my needs best?
The pricing options vary based on user requirements and access needs. Individual users may opt for single-user licenses, while businesses requiring broader access may choose multi-user or enterprise licenses for cost-effective access to the report.
13. Are there any additional resources or data provided in the Transparent Ceramics Market report?
While the report offers comprehensive insights, it's advisable to review the specific contents or supplementary materials provided to ascertain if additional resources or data are available.
14. How can I stay updated on further developments or reports in the Transparent Ceramics Market?
To stay informed about further developments, trends, and reports in the Transparent Ceramics Market, consider subscribing to industry newsletters, following relevant companies and organizations, or regularly checking reputable industry news sources and publications.
Methodology
Step 1 - Identification of Relevant Samples Size from Population Database


Step 2 - Approaches for Defining Global Market Size (Value, Volume* & Price*)

Note*: In applicable scenarios
Step 3 - Data Sources
Primary Research
- Web Analytics
- Survey Reports
- Research Institute
- Latest Research Reports
- Opinion Leaders
Secondary Research
- Annual Reports
- White Paper
- Latest Press Release
- Industry Association
- Paid Database
- Investor Presentations

Step 4 - Data Triangulation
Involves using different sources of information in order to increase the validity of a study
These sources are likely to be stakeholders in a program - participants, other researchers, program staff, other community members, and so on.
Then we put all data in single framework & apply various statistical tools to find out the dynamic on the market.
During the analysis stage, feedback from the stakeholder groups would be compared to determine areas of agreement as well as areas of divergence