

Key Insights
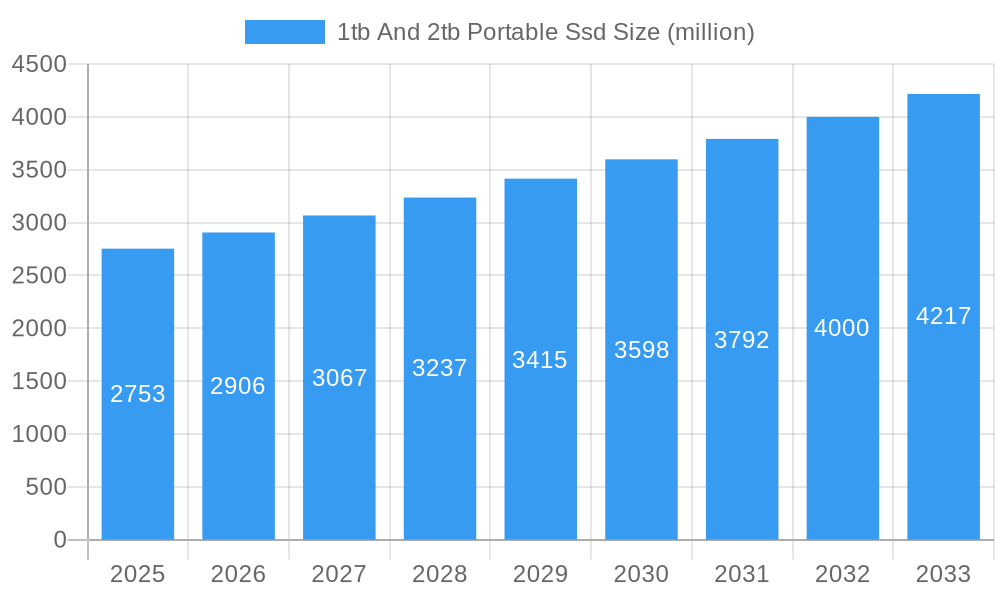
The global market for 1TB and 2TB portable SSDs is poised for significant expansion, currently valued at approximately $2753 million. This robust market is driven by a confluence of factors, including the ever-increasing demand for faster data storage and transfer speeds across both enterprise and personal computing environments. The proliferation of high-resolution media, complex software applications, and the growing adoption of cloud computing necessitate reliable and high-capacity external storage solutions. Furthermore, the miniaturization and increased durability of Solid State Drives (SSDs) over traditional Hard Disk Drives (HDDs) make portable SSDs an attractive option for professionals, content creators, gamers, and general users alike. Key market drivers include the growing digital content creation industry, the need for efficient data backup and management, and the increasing affordability of SSD technology, leading to a projected Compound Annual Growth Rate (CAGR) of 5.6% over the forecast period of 2025-2033.
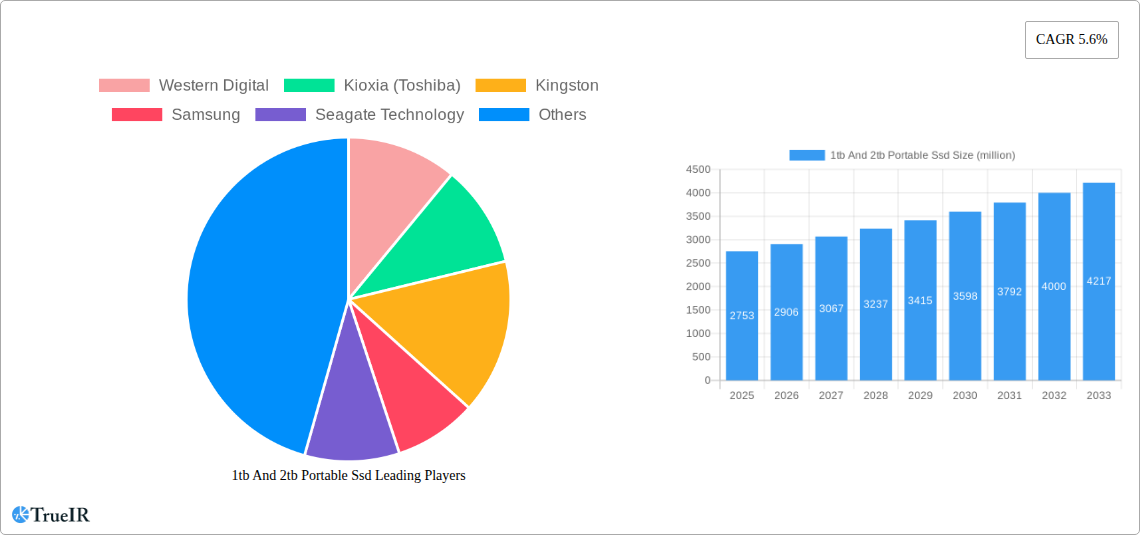
1tb And 2tb Portable Ssd Market Size (In Billion)
Emerging trends in the portable SSD market are centered around enhanced performance, increased capacities, and advanced features. Manufacturers are continuously innovating, introducing new interfaces like USB4 and Thunderbolt 4 to unlock even faster transfer speeds, significantly reducing downtime for large file transfers. The industry is also witnessing a trend towards ruggedized and water-resistant designs, catering to the needs of users who require dependable storage in demanding environments. While the market is largely dominated by established players like Western Digital, Samsung, and Seagate Technology, competitive pressures are driving price reductions and product innovation. Restraints, such as the initial higher cost compared to HDDs for equivalent capacities and concerns over long-term data integrity for some niche applications, are gradually diminishing as SSD technology matures and economies of scale improve, further fueling market growth and adoption.
1tb And 2tb Portable Ssd Company Market Share
1TB And 2TB Portable SSD Market: Comprehensive Analysis & Future Projections (2019-2033)
This in-depth report offers a detailed analysis of the global 1TB and 2TB portable SSD market, providing critical insights into market structure, competitive landscape, trends, opportunities, and future outlook. With a study period spanning from 2019 to 2033, including a base year of 2025 and a forecast period from 2025 to 2033, this report is an indispensable resource for stakeholders seeking to understand and capitalize on the burgeoning demand for high-capacity, high-speed portable storage solutions. We leverage high-volume keywords, including "portable SSD," "1TB SSD," "2TB SSD," "external SSD," "NVMe SSD," "USB-C SSD," "enterprise storage," "personal storage," and "data storage solutions," to ensure maximum SEO optimization and reach.
1TB And 2TB Portable SSD Market Structure & Competitive Landscape
The 1TB and 2TB portable SSD market is characterized by a moderately concentrated competitive landscape, with leading players like Samsung, Western Digital, Seagate Technology, Kingston, and Kioxia (Toshiba) holding significant market share. Innovation drivers, such as advancements in NAND flash technology and the increasing adoption of NVMe interfaces, are fueling product differentiation and performance enhancements. Regulatory impacts, primarily concerning data privacy and security standards, are also shaping market strategies. Product substitutes, including high-capacity traditional HDDs and cloud storage solutions, present a competitive challenge, though the superior speed and durability of SSDs continue to drive adoption. End-user segmentation reveals a robust demand from both enterprise and personal segments, with the latter experiencing rapid growth due to the proliferation of digital content. Merger and acquisition (M&A) trends, while not yet dominating, indicate a potential for consolidation as companies seek to expand their product portfolios and market reach. The market is projected to see a concentration ratio of approximately 65% among the top five players by 2028, with an estimated 15 major M&A activities anticipated within the forecast period.
1TB And 2TB Portable SSD Market Trends & Opportunities
The 1TB and 2TB portable SSD market is experiencing dynamic growth, propelled by a confluence of technological advancements, evolving consumer behaviors, and increasing enterprise data demands. Market size growth is projected to witness a Compound Annual Growth Rate (CAGR) of over 25% during the forecast period. This surge is underpinned by the relentless evolution of NAND flash memory, leading to higher storage densities, improved performance metrics, and more competitive pricing. The increasing adoption of USB 3.2 Gen 2x2 and Thunderbolt interfaces is significantly enhancing data transfer speeds, making portable SSDs an indispensable tool for content creators, professionals, and gamers who require rapid access to large files.
Consumer preferences are shifting towards portable SSDs due to their enhanced durability, lower power consumption, and silent operation compared to traditional hard drives. The growing volume of high-resolution video content, vast gaming libraries, and the increasing use of mobile devices for content creation are directly fueling demand for larger storage capacities, with 1TB and 2TB models becoming the de facto standard.
Technological shifts are also a major opportunity. The integration of NVMe controllers within portable SSDs unlocks desktop-level performance in a portable form factor, appealing to users who demand speed and responsiveness. Furthermore, advancements in compact and ruggedized designs are opening up new application areas, from industrial environments to outdoor adventures. The market penetration rate for portable SSDs within the overall portable storage market is expected to surpass 70% by 2030.
Competitive dynamics are intensifying, with manufacturers constantly innovating to offer faster, more reliable, and feature-rich portable SSDs. Opportunities exist for companies that can deliver superior performance, robust data security features, and compelling value propositions. The market is ripe for products that cater to niche applications, such as professional photography and videography, as well as solutions designed for enhanced cross-platform compatibility. Strategic partnerships and collaborations can further enhance market reach and product adoption. The total addressable market for 1TB and 2TB portable SSDs is estimated to exceed $50 billion by 2033.
Dominant Markets & Segments in 1TB And 2TB Portable Ssd
The global 1TB and 2TB portable SSD market exhibits distinct dominance across various regions and segments. From an Application perspective, the Personal segment is currently the largest and fastest-growing segment. This is driven by the exponential increase in digital content creation and consumption by individuals, including high-resolution photography and videography, extensive gaming libraries, and the burgeoning popularity of portable entertainment devices. The demand for quick and reliable storage for personal data, backups, and media libraries is a primary growth catalyst.
Within the Type segmentation, both 1TB and 2TB capacities are experiencing significant traction. While 1TB remains a popular choice for a balance of capacity and affordability, the 2TB segment is rapidly gaining market share as prices become more accessible and the need for larger storage solutions escalates. This trend is particularly evident among power users, content creators, and professionals who regularly handle massive datasets.
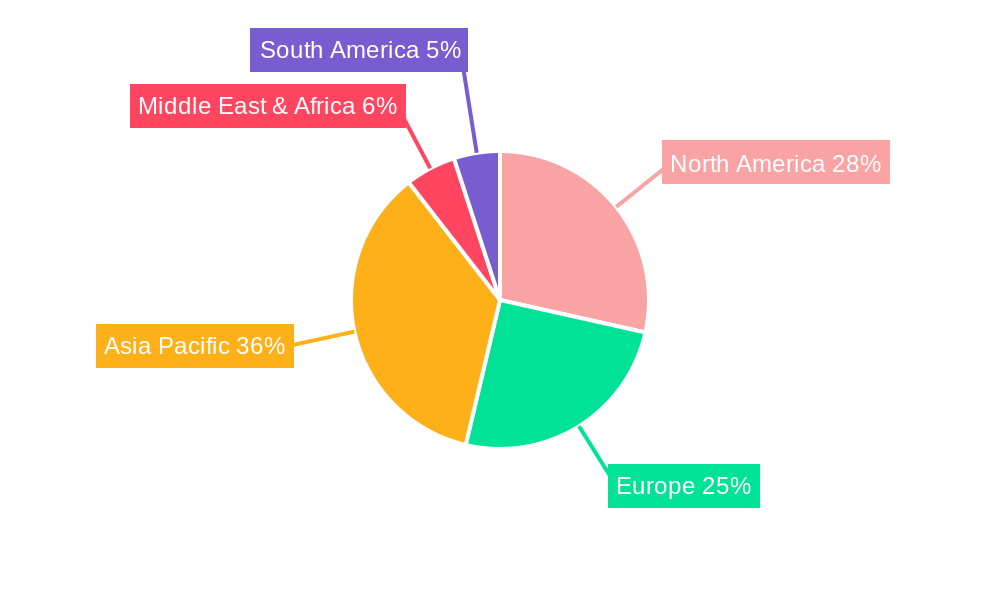
Geographically, North America and Asia-Pacific currently lead the market in terms of revenue and volume.
- North America: Driven by a highly tech-savvy population, a robust creative industry, and a strong presence of enterprise clients demanding high-performance storage for data analytics and large-scale projects. Government initiatives promoting digital infrastructure and cybersecurity also contribute to market growth.
- Asia-Pacific: This region presents immense growth potential due to a rapidly expanding middle class, increasing adoption of advanced digital technologies, and a growing number of small and medium-sized enterprises (SMEs) requiring efficient data management solutions. Countries like China, South Korea, and Japan are at the forefront of this expansion.
Key growth drivers for market dominance in these regions and segments include:
- Infrastructure Development: Widespread availability of high-speed internet and advanced computing devices that complement portable SSD capabilities.
- Policy Support: Government incentives and regulations promoting the adoption of advanced storage technologies and digital transformation initiatives.
- Consumer Spending Power: Increasing disposable income, particularly in emerging economies, allowing for greater investment in premium storage solutions.
- Technological Penetration: Rapid adoption of smartphones, digital cameras, gaming consoles, and high-performance laptops that necessitate larger and faster external storage.
- Enterprise Digitalization: Businesses across various sectors are increasingly relying on external SSDs for critical data backups, project storage, and portable workstation solutions, driving the Enterprise segment. The Enterprise segment is projected to grow at a CAGR of over 22% during the forecast period.
1TB And 2TB Portable Ssd Product Analysis
The 1TB and 2TB portable SSD market is characterized by rapid product innovation, focusing on enhanced speed, durability, and capacity. Key advancements include the widespread adoption of NVMe technology, enabling read/write speeds exceeding 1,000 MB/s, and the integration of USB 3.2 Gen 2x2 and Thunderbolt interfaces for even faster data transfers. Manufacturers are also emphasizing ruggedized designs, offering shockproof, water-resistant, and dustproof capabilities, making these devices ideal for demanding environments. Competitive advantages are being built on performance benchmarks, brand reputation, extended warranty periods, and integrated security features like hardware encryption. Products are tailored for diverse applications, from content creation and gaming to professional data backup and mobile workstation needs, ensuring market fit and strong consumer appeal.
Key Drivers, Barriers & Challenges in 1tb And 2tb Portable Ssd
The 1TB and 2TB portable SSD market is propelled by several key drivers. Technological advancements, particularly in NAND flash technology and interface speeds (NVMe, USB 3.2, Thunderbolt), are continuously improving performance and capacity while reducing cost per gigabyte. Economic factors, including increasing disposable incomes globally and the growing demand for high-performance computing, fuel consumer and enterprise spending. Policy-driven factors, such as government initiatives promoting digital transformation and data security, also contribute to market expansion.
However, several barriers and challenges impede growth. Supply chain issues, including the availability of raw materials and manufacturing capacity, can lead to price volatility and product shortages. Regulatory hurdles, particularly around data privacy and cross-border data transfer regulations, can add complexity for manufacturers and users. Competitive pressures from both established SSD manufacturers and emerging players, as well as from alternative storage solutions like cloud services and high-capacity HDDs, necessitate continuous innovation and competitive pricing. The impact of supply chain disruptions, which can lead to a 10-15% increase in component costs, and the constant need for R&D investment, estimated at 5-8% of revenue for leading players, are significant challenges.
Growth Drivers in the 1tb And 2tb Portable Ssd Market
Key growth drivers for the 1TB and 2TB portable SSD market are multifaceted. Technological advancements are paramount, with ongoing improvements in NAND flash density and the widespread adoption of faster interfaces like NVMe and Thunderbolt, enabling unprecedented data transfer speeds. Economic factors, such as rising global disposable incomes and the increasing affordability of high-capacity SSDs, are making these devices more accessible to a broader consumer base and businesses. Policy-driven factors, including government initiatives promoting digitalization and data sovereignty, further encourage the adoption of reliable and high-performance storage solutions. The ever-increasing volume of digital content, from 8K video to complex scientific data, also acts as a significant catalyst for demand.
Challenges Impacting 1tb And 2tb Portable Ssd Growth
Several challenges impact the growth of the 1TB and 2TB portable SSD market. Regulatory complexities, especially concerning data privacy laws and varying international standards, can create compliance burdens for manufacturers and hinder global market penetration. Supply chain issues, including shortages of critical components like NAND flash chips and controller ICs, can lead to price fluctuations and limited product availability, potentially impacting sales volumes by up to 10-12% during periods of acute shortage. Competitive pressures from established players and emerging market entrants, as well as from alternative storage solutions like cloud-based services and traditional hard drives, demand continuous innovation and aggressive pricing strategies. The constant need for significant investment in research and development to stay ahead of technological curves also presents a financial challenge for some companies.
Key Players Shaping the 1tb And 2tb Portable Ssd Market
- Western Digital
- Kioxia (Toshiba)
- Kingston
- Samsung
- Seagate Technology
- ADATA
- Lexar
- Lenovo
- Sony
- Crucial
Significant 1tb And 2tb Portable Ssd Industry Milestones
- 2019: Widespread adoption of USB 3.1 Gen 2 (10Gbps) leading to faster portable SSDs.
- 2020: Introduction of 2TB portable SSDs becoming more mainstream and accessible.
- 2021: Increased integration of NVMe technology in portable SSDs, pushing performance beyond 1,000MB/s.
- 2022: Emergence of Thunderbolt 3 and USB 3.2 Gen 2x2 (20Gbps) interfaces in premium portable SSD offerings.
- 2023: Focus on ruggedized and ultra-durable portable SSD designs for professional and outdoor use.
- 2024: Continued price reductions driving mass adoption of 1TB and 2TB capacities across all market segments.
- 2025 (Estimated): Expectation of further performance gains with upcoming interface standards and enhanced NAND flash technologies.
Future Outlook for 1tb And 2tb Portable Ssd Market
The future outlook for the 1TB and 2TB portable SSD market is exceptionally bright, driven by continued technological innovation and escalating demand for high-speed, high-capacity storage. Strategic opportunities lie in further miniaturization, increased ruggedization for niche applications, and enhanced cybersecurity features like advanced hardware encryption. The market potential is significant, with an estimated growth trajectory that will see portable SSDs becoming even more indispensable for professionals, content creators, gamers, and everyday users. The ongoing reduction in manufacturing costs is expected to further democratize access to these powerful storage solutions, solidifying their dominance in the portable storage landscape. The integration with emerging technologies like AI and AR will also create new avenues for specialized portable SSD solutions.
1tb And 2tb Portable Ssd Segmentation
-
1. Application
- 1.1. Enterprise
- 1.2. Personal
-
2. Type
- 2.1. 1TB
- 2.2. 2TB
1tb And 2tb Portable Ssd Segmentation By Geography
-
1. North America
- 1.1. United States
- 1.2. Canada
- 1.3. Mexico
-
2. South America
- 2.1. Brazil
- 2.2. Argentina
- 2.3. Rest of South America
-
3. Europe
- 3.1. United Kingdom
- 3.2. Germany
- 3.3. France
- 3.4. Italy
- 3.5. Spain
- 3.6. Russia
- 3.7. Benelux
- 3.8. Nordics
- 3.9. Rest of Europe
-
4. Middle East & Africa
- 4.1. Turkey
- 4.2. Israel
- 4.3. GCC
- 4.4. North Africa
- 4.5. South Africa
- 4.6. Rest of Middle East & Africa
-
5. Asia Pacific
- 5.1. China
- 5.2. India
- 5.3. Japan
- 5.4. South Korea
- 5.5. ASEAN
- 5.6. Oceania
- 5.7. Rest of Asia Pacific
1tb And 2tb Portable Ssd Regional Market Share
Geographic Coverage of 1tb And 2tb Portable Ssd
1tb And 2tb Portable Ssd REPORT HIGHLIGHTS
| Aspects | Details |
|---|---|
| Study Period | 2020-2034 |
| Base Year | 2025 |
| Estimated Year | 2026 |
| Forecast Period | 2026-2034 |
| Historical Period | 2020-2025 |
| Growth Rate | CAGR of 5.6% from 2020-2034 |
| Segmentation |
|
Table of Contents
- 1. Introduction
- 1.1. Research Scope
- 1.2. Market Segmentation
- 1.3. Research Methodology
- 1.4. Definitions and Assumptions
- 2. Executive Summary
- 2.1. Introduction
- 3. Market Dynamics
- 3.1. Introduction
- 3.2. Market Drivers
- 3.3. Market Restrains
- 3.4. Market Trends
- 4. Market Factor Analysis
- 4.1. Porters Five Forces
- 4.2. Supply/Value Chain
- 4.3. PESTEL analysis
- 4.4. Market Entropy
- 4.5. Patent/Trademark Analysis
- 5. Global 1tb And 2tb Portable Ssd Analysis, Insights and Forecast, 2020-2032
- 5.1. Market Analysis, Insights and Forecast - by Application
- 5.1.1. Enterprise
- 5.1.2. Personal
- 5.2. Market Analysis, Insights and Forecast - by Type
- 5.2.1. 1TB
- 5.2.2. 2TB
- 5.3. Market Analysis, Insights and Forecast - by Region
- 5.3.1. North America
- 5.3.2. South America
- 5.3.3. Europe
- 5.3.4. Middle East & Africa
- 5.3.5. Asia Pacific
- 5.1. Market Analysis, Insights and Forecast - by Application
- 6. North America 1tb And 2tb Portable Ssd Analysis, Insights and Forecast, 2020-2032
- 6.1. Market Analysis, Insights and Forecast - by Application
- 6.1.1. Enterprise
- 6.1.2. Personal
- 6.2. Market Analysis, Insights and Forecast - by Type
- 6.2.1. 1TB
- 6.2.2. 2TB
- 6.1. Market Analysis, Insights and Forecast - by Application
- 7. South America 1tb And 2tb Portable Ssd Analysis, Insights and Forecast, 2020-2032
- 7.1. Market Analysis, Insights and Forecast - by Application
- 7.1.1. Enterprise
- 7.1.2. Personal
- 7.2. Market Analysis, Insights and Forecast - by Type
- 7.2.1. 1TB
- 7.2.2. 2TB
- 7.1. Market Analysis, Insights and Forecast - by Application
- 8. Europe 1tb And 2tb Portable Ssd Analysis, Insights and Forecast, 2020-2032
- 8.1. Market Analysis, Insights and Forecast - by Application
- 8.1.1. Enterprise
- 8.1.2. Personal
- 8.2. Market Analysis, Insights and Forecast - by Type
- 8.2.1. 1TB
- 8.2.2. 2TB
- 8.1. Market Analysis, Insights and Forecast - by Application
- 9. Middle East & Africa 1tb And 2tb Portable Ssd Analysis, Insights and Forecast, 2020-2032
- 9.1. Market Analysis, Insights and Forecast - by Application
- 9.1.1. Enterprise
- 9.1.2. Personal
- 9.2. Market Analysis, Insights and Forecast - by Type
- 9.2.1. 1TB
- 9.2.2. 2TB
- 9.1. Market Analysis, Insights and Forecast - by Application
- 10. Asia Pacific 1tb And 2tb Portable Ssd Analysis, Insights and Forecast, 2020-2032
- 10.1. Market Analysis, Insights and Forecast - by Application
- 10.1.1. Enterprise
- 10.1.2. Personal
- 10.2. Market Analysis, Insights and Forecast - by Type
- 10.2.1. 1TB
- 10.2.2. 2TB
- 10.1. Market Analysis, Insights and Forecast - by Application
- 11. Competitive Analysis
- 11.1. Global Market Share Analysis 2025
- 11.2. Company Profiles
- 11.2.1 Western Digital
- 11.2.1.1. Overview
- 11.2.1.2. Products
- 11.2.1.3. SWOT Analysis
- 11.2.1.4. Recent Developments
- 11.2.1.5. Financials (Based on Availability)
- 11.2.2 Kioxia (Toshiba)
- 11.2.2.1. Overview
- 11.2.2.2. Products
- 11.2.2.3. SWOT Analysis
- 11.2.2.4. Recent Developments
- 11.2.2.5. Financials (Based on Availability)
- 11.2.3 Kingston
- 11.2.3.1. Overview
- 11.2.3.2. Products
- 11.2.3.3. SWOT Analysis
- 11.2.3.4. Recent Developments
- 11.2.3.5. Financials (Based on Availability)
- 11.2.4 Samsung
- 11.2.4.1. Overview
- 11.2.4.2. Products
- 11.2.4.3. SWOT Analysis
- 11.2.4.4. Recent Developments
- 11.2.4.5. Financials (Based on Availability)
- 11.2.5 Seagate Technology
- 11.2.5.1. Overview
- 11.2.5.2. Products
- 11.2.5.3. SWOT Analysis
- 11.2.5.4. Recent Developments
- 11.2.5.5. Financials (Based on Availability)
- 11.2.6 ADATA
- 11.2.6.1. Overview
- 11.2.6.2. Products
- 11.2.6.3. SWOT Analysis
- 11.2.6.4. Recent Developments
- 11.2.6.5. Financials (Based on Availability)
- 11.2.7 Lexar
- 11.2.7.1. Overview
- 11.2.7.2. Products
- 11.2.7.3. SWOT Analysis
- 11.2.7.4. Recent Developments
- 11.2.7.5. Financials (Based on Availability)
- 11.2.8 Lenovo
- 11.2.8.1. Overview
- 11.2.8.2. Products
- 11.2.8.3. SWOT Analysis
- 11.2.8.4. Recent Developments
- 11.2.8.5. Financials (Based on Availability)
- 11.2.9 Sony
- 11.2.9.1. Overview
- 11.2.9.2. Products
- 11.2.9.3. SWOT Analysis
- 11.2.9.4. Recent Developments
- 11.2.9.5. Financials (Based on Availability)
- 11.2.10 Crucial
- 11.2.10.1. Overview
- 11.2.10.2. Products
- 11.2.10.3. SWOT Analysis
- 11.2.10.4. Recent Developments
- 11.2.10.5. Financials (Based on Availability)
- 11.2.1 Western Digital
List of Figures
- Figure 1: Global 1tb And 2tb Portable Ssd Revenue Breakdown (million, %) by Region 2025 & 2033
- Figure 2: Global 1tb And 2tb Portable Ssd Volume Breakdown (K, %) by Region 2025 & 2033
- Figure 3: North America 1tb And 2tb Portable Ssd Revenue (million), by Application 2025 & 2033
- Figure 4: North America 1tb And 2tb Portable Ssd Volume (K), by Application 2025 & 2033
- Figure 5: North America 1tb And 2tb Portable Ssd Revenue Share (%), by Application 2025 & 2033
- Figure 6: North America 1tb And 2tb Portable Ssd Volume Share (%), by Application 2025 & 2033
- Figure 7: North America 1tb And 2tb Portable Ssd Revenue (million), by Type 2025 & 2033
- Figure 8: North America 1tb And 2tb Portable Ssd Volume (K), by Type 2025 & 2033
- Figure 9: North America 1tb And 2tb Portable Ssd Revenue Share (%), by Type 2025 & 2033
- Figure 10: North America 1tb And 2tb Portable Ssd Volume Share (%), by Type 2025 & 2033
- Figure 11: North America 1tb And 2tb Portable Ssd Revenue (million), by Country 2025 & 2033
- Figure 12: North America 1tb And 2tb Portable Ssd Volume (K), by Country 2025 & 2033
- Figure 13: North America 1tb And 2tb Portable Ssd Revenue Share (%), by Country 2025 & 2033
- Figure 14: North America 1tb And 2tb Portable Ssd Volume Share (%), by Country 2025 & 2033
- Figure 15: South America 1tb And 2tb Portable Ssd Revenue (million), by Application 2025 & 2033
- Figure 16: South America 1tb And 2tb Portable Ssd Volume (K), by Application 2025 & 2033
- Figure 17: South America 1tb And 2tb Portable Ssd Revenue Share (%), by Application 2025 & 2033
- Figure 18: South America 1tb And 2tb Portable Ssd Volume Share (%), by Application 2025 & 2033
- Figure 19: South America 1tb And 2tb Portable Ssd Revenue (million), by Type 2025 & 2033
- Figure 20: South America 1tb And 2tb Portable Ssd Volume (K), by Type 2025 & 2033
- Figure 21: South America 1tb And 2tb Portable Ssd Revenue Share (%), by Type 2025 & 2033
- Figure 22: South America 1tb And 2tb Portable Ssd Volume Share (%), by Type 2025 & 2033
- Figure 23: South America 1tb And 2tb Portable Ssd Revenue (million), by Country 2025 & 2033
- Figure 24: South America 1tb And 2tb Portable Ssd Volume (K), by Country 2025 & 2033
- Figure 25: South America 1tb And 2tb Portable Ssd Revenue Share (%), by Country 2025 & 2033
- Figure 26: South America 1tb And 2tb Portable Ssd Volume Share (%), by Country 2025 & 2033
- Figure 27: Europe 1tb And 2tb Portable Ssd Revenue (million), by Application 2025 & 2033
- Figure 28: Europe 1tb And 2tb Portable Ssd Volume (K), by Application 2025 & 2033
- Figure 29: Europe 1tb And 2tb Portable Ssd Revenue Share (%), by Application 2025 & 2033
- Figure 30: Europe 1tb And 2tb Portable Ssd Volume Share (%), by Application 2025 & 2033
- Figure 31: Europe 1tb And 2tb Portable Ssd Revenue (million), by Type 2025 & 2033
- Figure 32: Europe 1tb And 2tb Portable Ssd Volume (K), by Type 2025 & 2033
- Figure 33: Europe 1tb And 2tb Portable Ssd Revenue Share (%), by Type 2025 & 2033
- Figure 34: Europe 1tb And 2tb Portable Ssd Volume Share (%), by Type 2025 & 2033
- Figure 35: Europe 1tb And 2tb Portable Ssd Revenue (million), by Country 2025 & 2033
- Figure 36: Europe 1tb And 2tb Portable Ssd Volume (K), by Country 2025 & 2033
- Figure 37: Europe 1tb And 2tb Portable Ssd Revenue Share (%), by Country 2025 & 2033
- Figure 38: Europe 1tb And 2tb Portable Ssd Volume Share (%), by Country 2025 & 2033
- Figure 39: Middle East & Africa 1tb And 2tb Portable Ssd Revenue (million), by Application 2025 & 2033
- Figure 40: Middle East & Africa 1tb And 2tb Portable Ssd Volume (K), by Application 2025 & 2033
- Figure 41: Middle East & Africa 1tb And 2tb Portable Ssd Revenue Share (%), by Application 2025 & 2033
- Figure 42: Middle East & Africa 1tb And 2tb Portable Ssd Volume Share (%), by Application 2025 & 2033
- Figure 43: Middle East & Africa 1tb And 2tb Portable Ssd Revenue (million), by Type 2025 & 2033
- Figure 44: Middle East & Africa 1tb And 2tb Portable Ssd Volume (K), by Type 2025 & 2033
- Figure 45: Middle East & Africa 1tb And 2tb Portable Ssd Revenue Share (%), by Type 2025 & 2033
- Figure 46: Middle East & Africa 1tb And 2tb Portable Ssd Volume Share (%), by Type 2025 & 2033
- Figure 47: Middle East & Africa 1tb And 2tb Portable Ssd Revenue (million), by Country 2025 & 2033
- Figure 48: Middle East & Africa 1tb And 2tb Portable Ssd Volume (K), by Country 2025 & 2033
- Figure 49: Middle East & Africa 1tb And 2tb Portable Ssd Revenue Share (%), by Country 2025 & 2033
- Figure 50: Middle East & Africa 1tb And 2tb Portable Ssd Volume Share (%), by Country 2025 & 2033
- Figure 51: Asia Pacific 1tb And 2tb Portable Ssd Revenue (million), by Application 2025 & 2033
- Figure 52: Asia Pacific 1tb And 2tb Portable Ssd Volume (K), by Application 2025 & 2033
- Figure 53: Asia Pacific 1tb And 2tb Portable Ssd Revenue Share (%), by Application 2025 & 2033
- Figure 54: Asia Pacific 1tb And 2tb Portable Ssd Volume Share (%), by Application 2025 & 2033
- Figure 55: Asia Pacific 1tb And 2tb Portable Ssd Revenue (million), by Type 2025 & 2033
- Figure 56: Asia Pacific 1tb And 2tb Portable Ssd Volume (K), by Type 2025 & 2033
- Figure 57: Asia Pacific 1tb And 2tb Portable Ssd Revenue Share (%), by Type 2025 & 2033
- Figure 58: Asia Pacific 1tb And 2tb Portable Ssd Volume Share (%), by Type 2025 & 2033
- Figure 59: Asia Pacific 1tb And 2tb Portable Ssd Revenue (million), by Country 2025 & 2033
- Figure 60: Asia Pacific 1tb And 2tb Portable Ssd Volume (K), by Country 2025 & 2033
- Figure 61: Asia Pacific 1tb And 2tb Portable Ssd Revenue Share (%), by Country 2025 & 2033
- Figure 62: Asia Pacific 1tb And 2tb Portable Ssd Volume Share (%), by Country 2025 & 2033
List of Tables
- Table 1: Global 1tb And 2tb Portable Ssd Revenue million Forecast, by Application 2020 & 2033
- Table 2: Global 1tb And 2tb Portable Ssd Volume K Forecast, by Application 2020 & 2033
- Table 3: Global 1tb And 2tb Portable Ssd Revenue million Forecast, by Type 2020 & 2033
- Table 4: Global 1tb And 2tb Portable Ssd Volume K Forecast, by Type 2020 & 2033
- Table 5: Global 1tb And 2tb Portable Ssd Revenue million Forecast, by Region 2020 & 2033
- Table 6: Global 1tb And 2tb Portable Ssd Volume K Forecast, by Region 2020 & 2033
- Table 7: Global 1tb And 2tb Portable Ssd Revenue million Forecast, by Application 2020 & 2033
- Table 8: Global 1tb And 2tb Portable Ssd Volume K Forecast, by Application 2020 & 2033
- Table 9: Global 1tb And 2tb Portable Ssd Revenue million Forecast, by Type 2020 & 2033
- Table 10: Global 1tb And 2tb Portable Ssd Volume K Forecast, by Type 2020 & 2033
- Table 11: Global 1tb And 2tb Portable Ssd Revenue million Forecast, by Country 2020 & 2033
- Table 12: Global 1tb And 2tb Portable Ssd Volume K Forecast, by Country 2020 & 2033
- Table 13: United States 1tb And 2tb Portable Ssd Revenue (million) Forecast, by Application 2020 & 2033
- Table 14: United States 1tb And 2tb Portable Ssd Volume (K) Forecast, by Application 2020 & 2033
- Table 15: Canada 1tb And 2tb Portable Ssd Revenue (million) Forecast, by Application 2020 & 2033
- Table 16: Canada 1tb And 2tb Portable Ssd Volume (K) Forecast, by Application 2020 & 2033
- Table 17: Mexico 1tb And 2tb Portable Ssd Revenue (million) Forecast, by Application 2020 & 2033
- Table 18: Mexico 1tb And 2tb Portable Ssd Volume (K) Forecast, by Application 2020 & 2033
- Table 19: Global 1tb And 2tb Portable Ssd Revenue million Forecast, by Application 2020 & 2033
- Table 20: Global 1tb And 2tb Portable Ssd Volume K Forecast, by Application 2020 & 2033
- Table 21: Global 1tb And 2tb Portable Ssd Revenue million Forecast, by Type 2020 & 2033
- Table 22: Global 1tb And 2tb Portable Ssd Volume K Forecast, by Type 2020 & 2033
- Table 23: Global 1tb And 2tb Portable Ssd Revenue million Forecast, by Country 2020 & 2033
- Table 24: Global 1tb And 2tb Portable Ssd Volume K Forecast, by Country 2020 & 2033
- Table 25: Brazil 1tb And 2tb Portable Ssd Revenue (million) Forecast, by Application 2020 & 2033
- Table 26: Brazil 1tb And 2tb Portable Ssd Volume (K) Forecast, by Application 2020 & 2033
- Table 27: Argentina 1tb And 2tb Portable Ssd Revenue (million) Forecast, by Application 2020 & 2033
- Table 28: Argentina 1tb And 2tb Portable Ssd Volume (K) Forecast, by Application 2020 & 2033
- Table 29: Rest of South America 1tb And 2tb Portable Ssd Revenue (million) Forecast, by Application 2020 & 2033
- Table 30: Rest of South America 1tb And 2tb Portable Ssd Volume (K) Forecast, by Application 2020 & 2033
- Table 31: Global 1tb And 2tb Portable Ssd Revenue million Forecast, by Application 2020 & 2033
- Table 32: Global 1tb And 2tb Portable Ssd Volume K Forecast, by Application 2020 & 2033
- Table 33: Global 1tb And 2tb Portable Ssd Revenue million Forecast, by Type 2020 & 2033
- Table 34: Global 1tb And 2tb Portable Ssd Volume K Forecast, by Type 2020 & 2033
- Table 35: Global 1tb And 2tb Portable Ssd Revenue million Forecast, by Country 2020 & 2033
- Table 36: Global 1tb And 2tb Portable Ssd Volume K Forecast, by Country 2020 & 2033
- Table 37: United Kingdom 1tb And 2tb Portable Ssd Revenue (million) Forecast, by Application 2020 & 2033
- Table 38: United Kingdom 1tb And 2tb Portable Ssd Volume (K) Forecast, by Application 2020 & 2033
- Table 39: Germany 1tb And 2tb Portable Ssd Revenue (million) Forecast, by Application 2020 & 2033
- Table 40: Germany 1tb And 2tb Portable Ssd Volume (K) Forecast, by Application 2020 & 2033
- Table 41: France 1tb And 2tb Portable Ssd Revenue (million) Forecast, by Application 2020 & 2033
- Table 42: France 1tb And 2tb Portable Ssd Volume (K) Forecast, by Application 2020 & 2033
- Table 43: Italy 1tb And 2tb Portable Ssd Revenue (million) Forecast, by Application 2020 & 2033
- Table 44: Italy 1tb And 2tb Portable Ssd Volume (K) Forecast, by Application 2020 & 2033
- Table 45: Spain 1tb And 2tb Portable Ssd Revenue (million) Forecast, by Application 2020 & 2033
- Table 46: Spain 1tb And 2tb Portable Ssd Volume (K) Forecast, by Application 2020 & 2033
- Table 47: Russia 1tb And 2tb Portable Ssd Revenue (million) Forecast, by Application 2020 & 2033
- Table 48: Russia 1tb And 2tb Portable Ssd Volume (K) Forecast, by Application 2020 & 2033
- Table 49: Benelux 1tb And 2tb Portable Ssd Revenue (million) Forecast, by Application 2020 & 2033
- Table 50: Benelux 1tb And 2tb Portable Ssd Volume (K) Forecast, by Application 2020 & 2033
- Table 51: Nordics 1tb And 2tb Portable Ssd Revenue (million) Forecast, by Application 2020 & 2033
- Table 52: Nordics 1tb And 2tb Portable Ssd Volume (K) Forecast, by Application 2020 & 2033
- Table 53: Rest of Europe 1tb And 2tb Portable Ssd Revenue (million) Forecast, by Application 2020 & 2033
- Table 54: Rest of Europe 1tb And 2tb Portable Ssd Volume (K) Forecast, by Application 2020 & 2033
- Table 55: Global 1tb And 2tb Portable Ssd Revenue million Forecast, by Application 2020 & 2033
- Table 56: Global 1tb And 2tb Portable Ssd Volume K Forecast, by Application 2020 & 2033
- Table 57: Global 1tb And 2tb Portable Ssd Revenue million Forecast, by Type 2020 & 2033
- Table 58: Global 1tb And 2tb Portable Ssd Volume K Forecast, by Type 2020 & 2033
- Table 59: Global 1tb And 2tb Portable Ssd Revenue million Forecast, by Country 2020 & 2033
- Table 60: Global 1tb And 2tb Portable Ssd Volume K Forecast, by Country 2020 & 2033
- Table 61: Turkey 1tb And 2tb Portable Ssd Revenue (million) Forecast, by Application 2020 & 2033
- Table 62: Turkey 1tb And 2tb Portable Ssd Volume (K) Forecast, by Application 2020 & 2033
- Table 63: Israel 1tb And 2tb Portable Ssd Revenue (million) Forecast, by Application 2020 & 2033
- Table 64: Israel 1tb And 2tb Portable Ssd Volume (K) Forecast, by Application 2020 & 2033
- Table 65: GCC 1tb And 2tb Portable Ssd Revenue (million) Forecast, by Application 2020 & 2033
- Table 66: GCC 1tb And 2tb Portable Ssd Volume (K) Forecast, by Application 2020 & 2033
- Table 67: North Africa 1tb And 2tb Portable Ssd Revenue (million) Forecast, by Application 2020 & 2033
- Table 68: North Africa 1tb And 2tb Portable Ssd Volume (K) Forecast, by Application 2020 & 2033
- Table 69: South Africa 1tb And 2tb Portable Ssd Revenue (million) Forecast, by Application 2020 & 2033
- Table 70: South Africa 1tb And 2tb Portable Ssd Volume (K) Forecast, by Application 2020 & 2033
- Table 71: Rest of Middle East & Africa 1tb And 2tb Portable Ssd Revenue (million) Forecast, by Application 2020 & 2033
- Table 72: Rest of Middle East & Africa 1tb And 2tb Portable Ssd Volume (K) Forecast, by Application 2020 & 2033
- Table 73: Global 1tb And 2tb Portable Ssd Revenue million Forecast, by Application 2020 & 2033
- Table 74: Global 1tb And 2tb Portable Ssd Volume K Forecast, by Application 2020 & 2033
- Table 75: Global 1tb And 2tb Portable Ssd Revenue million Forecast, by Type 2020 & 2033
- Table 76: Global 1tb And 2tb Portable Ssd Volume K Forecast, by Type 2020 & 2033
- Table 77: Global 1tb And 2tb Portable Ssd Revenue million Forecast, by Country 2020 & 2033
- Table 78: Global 1tb And 2tb Portable Ssd Volume K Forecast, by Country 2020 & 2033
- Table 79: China 1tb And 2tb Portable Ssd Revenue (million) Forecast, by Application 2020 & 2033
- Table 80: China 1tb And 2tb Portable Ssd Volume (K) Forecast, by Application 2020 & 2033
- Table 81: India 1tb And 2tb Portable Ssd Revenue (million) Forecast, by Application 2020 & 2033
- Table 82: India 1tb And 2tb Portable Ssd Volume (K) Forecast, by Application 2020 & 2033
- Table 83: Japan 1tb And 2tb Portable Ssd Revenue (million) Forecast, by Application 2020 & 2033
- Table 84: Japan 1tb And 2tb Portable Ssd Volume (K) Forecast, by Application 2020 & 2033
- Table 85: South Korea 1tb And 2tb Portable Ssd Revenue (million) Forecast, by Application 2020 & 2033
- Table 86: South Korea 1tb And 2tb Portable Ssd Volume (K) Forecast, by Application 2020 & 2033
- Table 87: ASEAN 1tb And 2tb Portable Ssd Revenue (million) Forecast, by Application 2020 & 2033
- Table 88: ASEAN 1tb And 2tb Portable Ssd Volume (K) Forecast, by Application 2020 & 2033
- Table 89: Oceania 1tb And 2tb Portable Ssd Revenue (million) Forecast, by Application 2020 & 2033
- Table 90: Oceania 1tb And 2tb Portable Ssd Volume (K) Forecast, by Application 2020 & 2033
- Table 91: Rest of Asia Pacific 1tb And 2tb Portable Ssd Revenue (million) Forecast, by Application 2020 & 2033
- Table 92: Rest of Asia Pacific 1tb And 2tb Portable Ssd Volume (K) Forecast, by Application 2020 & 2033
Frequently Asked Questions
1. What is the projected Compound Annual Growth Rate (CAGR) of the 1tb And 2tb Portable Ssd?
The projected CAGR is approximately 5.6%.
2. Which companies are prominent players in the 1tb And 2tb Portable Ssd?
Key companies in the market include Western Digital, Kioxia (Toshiba), Kingston, Samsung, Seagate Technology, ADATA, Lexar, Lenovo, Sony, Crucial.
3. What are the main segments of the 1tb And 2tb Portable Ssd?
The market segments include Application, Type.
4. Can you provide details about the market size?
The market size is estimated to be USD 2753 million as of 2022.
5. What are some drivers contributing to market growth?
N/A
6. What are the notable trends driving market growth?
N/A
7. Are there any restraints impacting market growth?
N/A
8. Can you provide examples of recent developments in the market?
N/A
9. What pricing options are available for accessing the report?
Pricing options include single-user, multi-user, and enterprise licenses priced at USD 3950.00, USD 5925.00, and USD 7900.00 respectively.
10. Is the market size provided in terms of value or volume?
The market size is provided in terms of value, measured in million and volume, measured in K.
11. Are there any specific market keywords associated with the report?
Yes, the market keyword associated with the report is "1tb And 2tb Portable Ssd," which aids in identifying and referencing the specific market segment covered.
12. How do I determine which pricing option suits my needs best?
The pricing options vary based on user requirements and access needs. Individual users may opt for single-user licenses, while businesses requiring broader access may choose multi-user or enterprise licenses for cost-effective access to the report.
13. Are there any additional resources or data provided in the 1tb And 2tb Portable Ssd report?
While the report offers comprehensive insights, it's advisable to review the specific contents or supplementary materials provided to ascertain if additional resources or data are available.
14. How can I stay updated on further developments or reports in the 1tb And 2tb Portable Ssd?
To stay informed about further developments, trends, and reports in the 1tb And 2tb Portable Ssd, consider subscribing to industry newsletters, following relevant companies and organizations, or regularly checking reputable industry news sources and publications.
Methodology
Step 1 - Identification of Relevant Samples Size from Population Database


Step 2 - Approaches for Defining Global Market Size (Value, Volume* & Price*)

Note*: In applicable scenarios
Step 3 - Data Sources
Primary Research
- Web Analytics
- Survey Reports
- Research Institute
- Latest Research Reports
- Opinion Leaders
Secondary Research
- Annual Reports
- White Paper
- Latest Press Release
- Industry Association
- Paid Database
- Investor Presentations

Step 4 - Data Triangulation
Involves using different sources of information in order to increase the validity of a study
These sources are likely to be stakeholders in a program - participants, other researchers, program staff, other community members, and so on.
Then we put all data in single framework & apply various statistical tools to find out the dynamic on the market.
During the analysis stage, feedback from the stakeholder groups would be compared to determine areas of agreement as well as areas of divergence