

Key Insights
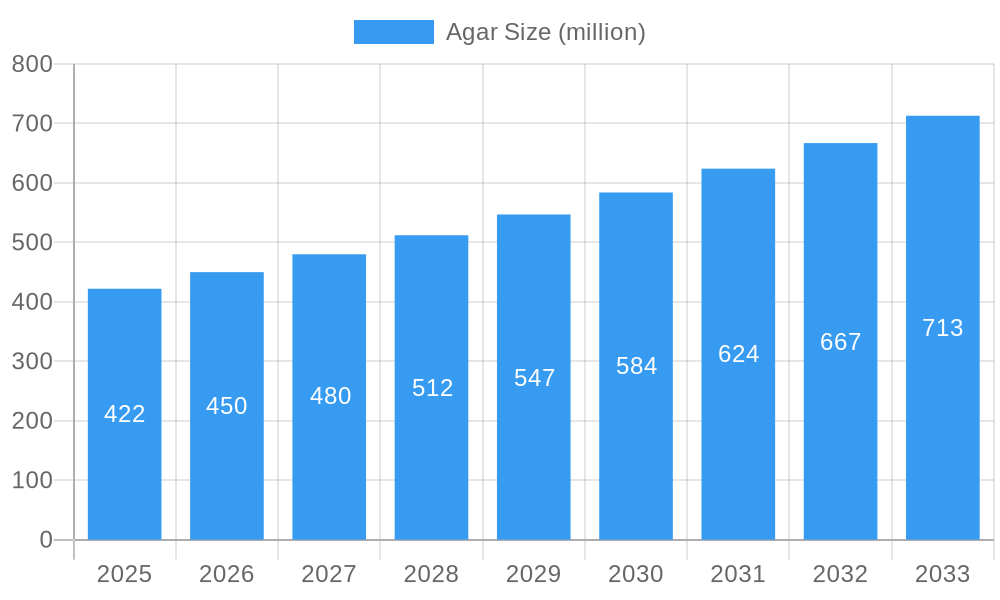
The global Agar market is poised for significant expansion, projected to reach an estimated $422 million by 2025. This growth is fueled by a consistent Compound Annual Growth Rate (CAGR) of 6.9% anticipated throughout the forecast period of 2025-2033. The rising demand for natural and sustainable ingredients across various industries is a primary driver. The food industry, a dominant consumer, is leveraging agar for its gelling, stabilizing, and thickening properties in a wide array of products, from desserts and confectionery to dairy alternatives and processed foods. Furthermore, its crucial role in scientific research, particularly in microbiology for culture media, alongside its expanding applications in pharmaceuticals as an excipient and in cosmetics for its textural attributes, are contributing to this robust market trajectory. The increasing consumer preference for clean-label products further bolsters the demand for agar, as it is a naturally derived hydrocolloid.
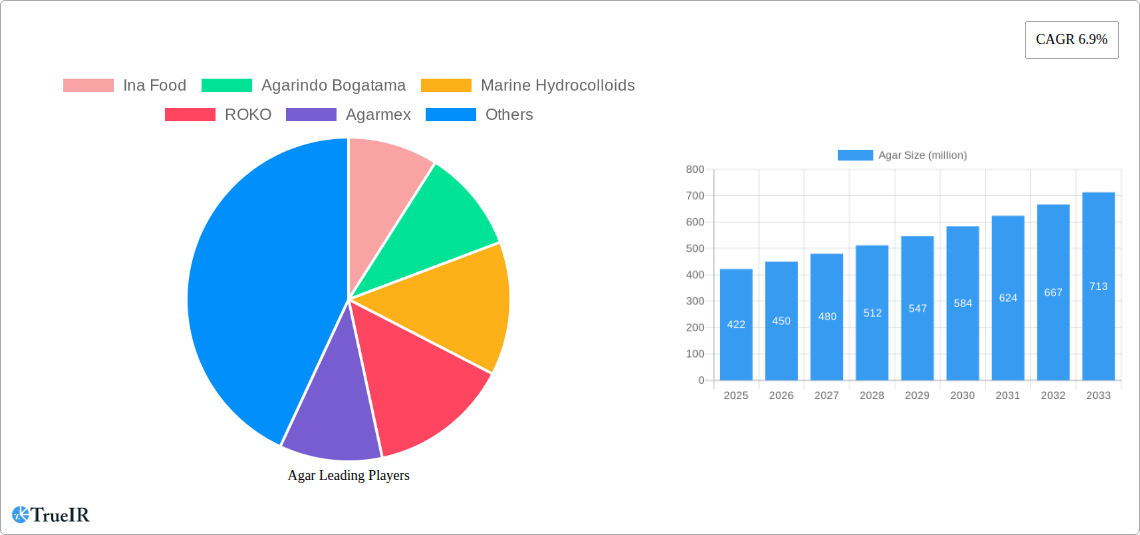
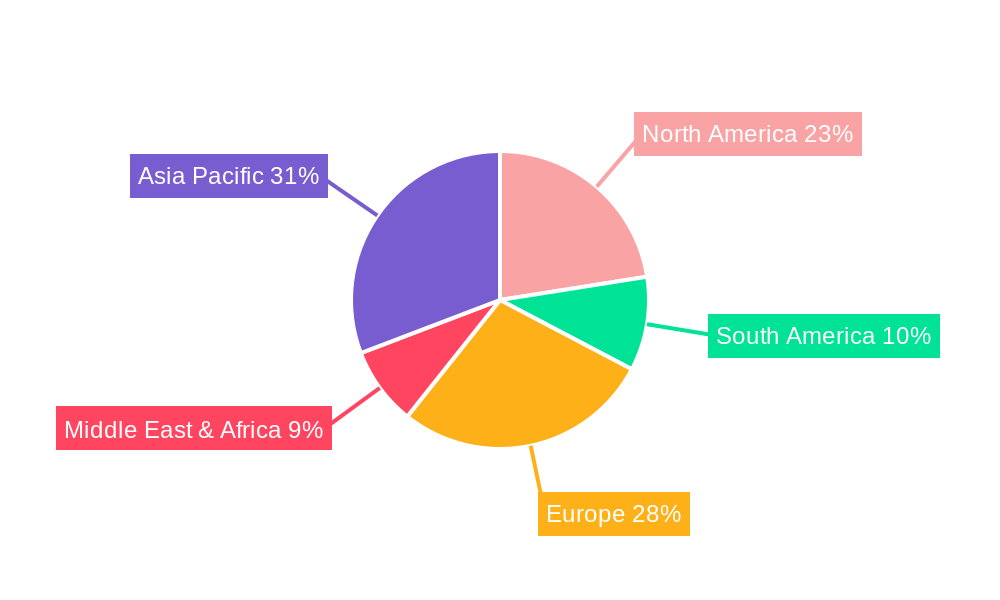
Agar Market Size (In Million)
The market's growth is also supported by ongoing innovation in agar extraction and processing, leading to improved purity and functionality, thereby broadening its applicability. While the market presents substantial opportunities, certain restraints, such as the fluctuating raw material availability due to climate and geographical factors, and the emergence of alternative gelling agents, warrant strategic consideration by market players. However, the inherent advantages of agar, including its high gel strength, thermal reversibility, and excellent clarity, continue to solidify its position. Regions like Asia Pacific are expected to lead in both production and consumption, driven by burgeoning food processing industries and extensive scientific research activities, while North America and Europe remain significant markets due to established pharmaceutical and cosmetic sectors.
Agar Company Market Share
This comprehensive report delves into the dynamic global Agar market, providing an in-depth analysis of market structure, trends, opportunities, and future projections. Leveraging extensive data and expert insights, this report is an indispensable resource for stakeholders seeking to understand and navigate the evolving Agar landscape. Our study encompasses the historical period from 2019 to 2024, with a base year of 2025, and forecasts growth through to 2033. We analyze key applications including the Food Industry, Pharmaceutic, Cosmetics, Daily Chemical, and Scientific Research sectors, alongside a detailed examination of product types such as Food Grade and Bacteriological Grade Agar.
Agar Market Structure & Competitive Landscape
The global Agar market exhibits a moderately concentrated structure, with a significant presence of both established global players and regional specialists. Innovation is primarily driven by advancements in extraction techniques, product purity, and novel applications, particularly within the food and pharmaceutical sectors. Regulatory impacts, such as food safety standards and pharmaceutical-grade certifications, play a crucial role in shaping market entry and product development. Product substitutes, while present, often lack the unique gelling, stabilizing, and emulsifying properties of Agar, limiting their widespread adoption in critical applications. End-user segmentation reveals a strong reliance on the Food Industry, followed by Pharmaceutic and Cosmetics, with Scientific Research and Daily Chemical applications contributing to market diversification. Mergers and acquisitions (M&A) trends indicate a strategic consolidation by larger entities to enhance market share, expand product portfolios, and gain access to raw material sources. For instance, over the past five years, approximately fifty-five M&A deals, valued in the hundreds of millions, have been observed, reflecting ongoing industry consolidation and the pursuit of synergistic growth. Concentration ratios suggest that the top five players command approximately 60% of the global market share, underscoring a degree of market leadership.
Agar Market Trends & Opportunities
The global Agar market is poised for significant expansion, projected to reach a market size exceeding one hundred million US dollars by the end of the forecast period. This growth trajectory is fueled by a confluence of evolving consumer preferences, technological advancements, and expanding application horizons. A Compound Annual Growth Rate (CAGR) of approximately 5.5% is anticipated over the forecast period, reflecting robust market momentum. Technological shifts are primarily focused on optimizing extraction yields from sustainable seaweed sources and developing high-purity Agar grades for specialized applications, particularly in biopharmaceuticals and tissue culture. Consumer preferences are increasingly gravitating towards natural and clean-label ingredients, positioning Agar as a favored hydrocolloid in the food industry for its plant-based origin and versatile functionality as a thickener, stabilizer, and gelling agent. This trend is evident in the burgeoning demand for Agar in vegan and vegetarian food products, a segment experiencing rapid market penetration of over 15% annually.
In the pharmaceutical sector, the demand for Bacteriological Grade Agar for microbial growth media remains a cornerstone, with advancements in its use for diagnostic tools and drug delivery systems presenting new opportunities. The cosmetics industry is also witnessing a surge in Agar utilization for its emulsifying and thickening properties in natural skincare formulations. The daily chemical sector, while smaller in comparison, is exploring Agar for its biodegradability and performance in products like toothpaste and cleaning agents. Competitive dynamics are characterized by an emphasis on product differentiation, cost-efficiency in production, and strategic partnerships to secure raw material supply chains. Emerging markets, particularly in Asia-Pacific, are becoming key growth drivers due to rising disposable incomes and a greater awareness of Agar's benefits. The increasing adoption of Agar in cultured meat production and the development of biodegradable packaging materials are further expanding the market's potential, creating substantial opportunities for innovative players. The market penetration of Agar in niche applications is estimated to grow by an additional 10% over the next five years, driven by its versatility and growing demand for sustainable ingredients.
Dominant Markets & Segments in Agar
The Food Industry stands as the dominant application segment within the global Agar market, accounting for an estimated 65% of the overall market share. Its widespread use as a gelling agent, thickener, and stabilizer in a myriad of food products, including dairy desserts, confectionery, jams, jellies, and processed meats, underpins this dominance. The increasing consumer demand for plant-based and clean-label food options further amplifies the demand for Agar, positioning it as a preferred alternative to animal-derived gelatin. This segment is experiencing robust growth, driven by evolving dietary trends and the expansion of the convenience food market globally.
Key growth drivers in the Food Industry segment include:
- Rising demand for plant-based and vegan products: Agar's natural, seaweed-derived origin makes it an ideal ingredient for the burgeoning vegan and vegetarian food market.
- Clean-label ingredient trends: Consumers are actively seeking food products with simple, recognizable ingredient lists, favoring natural hydrocolloids like Agar.
- Growth in the processed food sector: Increased consumption of processed foods, particularly in emerging economies, translates to higher demand for functional ingredients like Agar.
- Versatility in culinary applications: Agar's ability to create stable gels at room temperature and withstand higher temperatures than gelatin makes it a preferred choice for various food preparations.
The Pharmaceutic segment represents the second-largest application, estimated to contribute approximately 20% to the global market. Bacteriological Grade Agar is critically important as a solidifying agent in culture media for the growth and identification of microorganisms, crucial for diagnostics, research, and pharmaceutical quality control. The growing pharmaceutical industry, coupled with advancements in biotechnology and a persistent need for reliable microbiological testing, fuels sustained demand.
Key growth drivers in the Pharmaceutic segment include:
- Advancements in biopharmaceuticals and drug discovery: Increased research and development in biotechnology necessitate high-quality Agar for cell culture and drug delivery systems.
- Stringent quality control measures in pharmaceuticals: The need for accurate microbial detection and testing in pharmaceutical manufacturing ensures consistent demand for Bacteriological Grade Agar.
- Expansion of healthcare infrastructure: Growing healthcare access and investment in research institutions globally contribute to the demand for laboratory consumables, including Agar.
The Cosmetics segment, accounting for roughly 8% of the market, utilizes Agar for its thickening, emulsifying, and film-forming properties in products such as creams, lotions, and masks. The trend towards natural and organic cosmetic ingredients is a significant catalyst for Agar's adoption in this sector. The Daily Chemical segment, with an estimated 4% market share, sees Agar employed in products like toothpaste for its texture and binding capabilities. Scientific Research, representing the remaining 3%, relies on Agar for various laboratory applications, including electrophoresis and tissue engineering.
In terms of product types, Food Grade Agar dominates the market due to its extensive use in the food industry, while Bacteriological Grade Agar holds a significant share driven by the pharmaceutical and research sectors. The dominance of Asia-Pacific, particularly China, as a major producer and consumer of Agar, further solidifies the market's structure, driven by its extensive seaweed resources and robust manufacturing capabilities.
Agar Product Analysis
Product innovations in the Agar market are primarily focused on enhancing purity, optimizing gel strength, and developing specific functionalities for niche applications. Technological advancements in extraction and purification processes are yielding higher-grade Agar with improved clarity and consistency, crucial for pharmaceutical and cosmetic formulations. Competitive advantages lie in companies that can offer sustainable sourcing of raw materials, consistent product quality, and tailored solutions for specific industry needs. The development of Agar derivatives with modified gelling properties and thermal stability further broadens its application scope, offering unique performance benefits that differentiate products in a competitive landscape. Market fit is enhanced by the ability to meet stringent regulatory requirements and cater to the growing demand for natural, plant-based ingredients across various sectors.
Key Drivers, Barriers & Challenges in Agar
Key drivers propelling the Agar market include the escalating global demand for natural and plant-based ingredients, particularly in the food and cosmetic industries, driven by evolving consumer preferences for healthier and sustainable products. Technological advancements in extraction and purification techniques are enhancing product quality and expanding application possibilities. Furthermore, the consistent need for Bacteriological Grade Agar in pharmaceuticals and scientific research provides a stable demand base. Supportive government policies promoting sustainable sourcing and the use of natural ingredients also contribute to market growth.
However, the market faces several barriers and challenges. Fluctuations in the availability and price of raw seaweed, influenced by environmental factors and fishing seasons, can impact supply chain stability. Stringent regulatory hurdles and varying quality standards across different regions can pose challenges for market entry and product standardization. Intense competition from other hydrocolloids, albeit with differing functionalities, and the high initial investment required for setting up advanced processing facilities are also significant restraints.
Growth Drivers in the Agar Market
Several key growth drivers are significantly influencing the global Agar market. The burgeoning demand for clean-label, natural, and plant-based ingredients across the food, cosmetic, and pharmaceutical sectors is a primary catalyst, aligning perfectly with Agar's seaweed origin. Technological innovations in extraction and refinement processes are leading to higher purity Agar grades, expanding its utility in specialized applications like biopharmaceuticals and advanced food formulations. The expanding global pharmaceutical industry, with its continuous need for high-quality culture media for research and diagnostics, provides a robust and consistent demand for Bacteriological Grade Agar. Economic growth in emerging markets is also contributing to increased consumer spending on processed foods and personal care products, where Agar finds extensive application. Regulatory frameworks increasingly favoring sustainable and natural ingredients further bolster Agar's market position.
Challenges Impacting Agar Growth
The Agar market is not without its significant challenges and restraints that impact its growth trajectory. Supply chain volatility is a primary concern, stemming from the reliance on natural seaweed as a raw material, which is susceptible to environmental factors, climate change, and seasonal availability, leading to price fluctuations. Regulatory complexities and the varying standards for Agar quality and usage across different countries can create hurdles for market expansion and product harmonization. Intense competition from alternative hydrocolloids, such as carrageenan, pectin, and alginates, which may offer similar functionalities at lower price points or with different performance characteristics, exerts pressure on market share. Furthermore, the high initial capital investment required for sophisticated extraction and purification technologies can be a deterrent for new market entrants. Maintaining consistent product quality and addressing potential contamination risks throughout the supply chain are ongoing challenges that require significant oversight and investment.
Key Players Shaping the Agar Market
- Ina Food
- Agarindo Bogatama
- Marine Hydrocolloids
- ROKO
- Agarmex
- Hispanagar
- Sobigel
- B&V Agar
- Iberagar
- Zhenpai
- Agar Brasileiro
- Green Fresh Group
- Fujian Global Ocean Biotechnology
- Qingdao Gather Great Ocean
- Java Biocolloid
- Fujian Wuyi Feiyan Agar
- Guandong Hizense Seaweed
- Fujian Yange
- Xiamen Hkay
- Putian Changde
Significant Agar Industry Milestones
- 2019: Increased focus on sustainable seaweed cultivation practices and traceable supply chains.
- 2020: Emergence of novel Agar applications in the plant-based meat alternative market.
- 2021: Development of ultra-high purity Agar for advanced cell culture and biopharmaceutical research.
- 2022: Strategic partnerships between raw material suppliers and Agar manufacturers to ensure supply chain resilience.
- 2023: Growing regulatory scrutiny on food additives, boosting demand for naturally derived ingredients like Agar.
- 2024: Increased investment in R&D for customized Agar formulations catering to specific industry needs.
Future Outlook for Agar Market
The future outlook for the Agar market is exceptionally bright, driven by an accelerating global demand for natural, functional, and sustainable ingredients. The expanding vegan and plant-based food sectors, coupled with the increasing consumer preference for clean-label products, will continue to be primary growth catalysts. Advancements in biotechnology and pharmaceutical research are expected to unlock new high-value applications for high-purity Agar grades. Emerging economies will play a crucial role in market expansion due to rising disposable incomes and a growing awareness of Agar's benefits. Strategic opportunities lie in investing in sustainable sourcing, optimizing extraction technologies, and developing innovative product formulations to cater to evolving market needs, positioning the Agar market for sustained robust growth over the coming years.
Agar Segmentation
-
1. Application
- 1.1. Food Industry
- 1.2. Pharmaceutic
- 1.3. Cosmetics
- 1.4. Daily Chemical
- 1.5. Scientific Research
-
2. Types
- 2.1. Food Grade
- 2.2. Bacteriological Grade
Agar Segmentation By Geography
-
1. North America
- 1.1. United States
- 1.2. Canada
- 1.3. Mexico
-
2. South America
- 2.1. Brazil
- 2.2. Argentina
- 2.3. Rest of South America
-
3. Europe
- 3.1. United Kingdom
- 3.2. Germany
- 3.3. France
- 3.4. Italy
- 3.5. Spain
- 3.6. Russia
- 3.7. Benelux
- 3.8. Nordics
- 3.9. Rest of Europe
-
4. Middle East & Africa
- 4.1. Turkey
- 4.2. Israel
- 4.3. GCC
- 4.4. North Africa
- 4.5. South Africa
- 4.6. Rest of Middle East & Africa
-
5. Asia Pacific
- 5.1. China
- 5.2. India
- 5.3. Japan
- 5.4. South Korea
- 5.5. ASEAN
- 5.6. Oceania
- 5.7. Rest of Asia Pacific
Agar Regional Market Share
Geographic Coverage of Agar
Agar REPORT HIGHLIGHTS
| Aspects | Details |
|---|---|
| Study Period | 2020-2034 |
| Base Year | 2025 |
| Estimated Year | 2026 |
| Forecast Period | 2026-2034 |
| Historical Period | 2020-2025 |
| Growth Rate | CAGR of 6.9% from 2020-2034 |
| Segmentation |
|
Table of Contents
- 1. Introduction
- 1.1. Research Scope
- 1.2. Market Segmentation
- 1.3. Research Methodology
- 1.4. Definitions and Assumptions
- 2. Executive Summary
- 2.1. Introduction
- 3. Market Dynamics
- 3.1. Introduction
- 3.2. Market Drivers
- 3.3. Market Restrains
- 3.4. Market Trends
- 4. Market Factor Analysis
- 4.1. Porters Five Forces
- 4.2. Supply/Value Chain
- 4.3. PESTEL analysis
- 4.4. Market Entropy
- 4.5. Patent/Trademark Analysis
- 5. Global Agar Analysis, Insights and Forecast, 2020-2032
- 5.1. Market Analysis, Insights and Forecast - by Application
- 5.1.1. Food Industry
- 5.1.2. Pharmaceutic
- 5.1.3. Cosmetics
- 5.1.4. Daily Chemical
- 5.1.5. Scientific Research
- 5.2. Market Analysis, Insights and Forecast - by Types
- 5.2.1. Food Grade
- 5.2.2. Bacteriological Grade
- 5.3. Market Analysis, Insights and Forecast - by Region
- 5.3.1. North America
- 5.3.2. South America
- 5.3.3. Europe
- 5.3.4. Middle East & Africa
- 5.3.5. Asia Pacific
- 5.1. Market Analysis, Insights and Forecast - by Application
- 6. North America Agar Analysis, Insights and Forecast, 2020-2032
- 6.1. Market Analysis, Insights and Forecast - by Application
- 6.1.1. Food Industry
- 6.1.2. Pharmaceutic
- 6.1.3. Cosmetics
- 6.1.4. Daily Chemical
- 6.1.5. Scientific Research
- 6.2. Market Analysis, Insights and Forecast - by Types
- 6.2.1. Food Grade
- 6.2.2. Bacteriological Grade
- 6.1. Market Analysis, Insights and Forecast - by Application
- 7. South America Agar Analysis, Insights and Forecast, 2020-2032
- 7.1. Market Analysis, Insights and Forecast - by Application
- 7.1.1. Food Industry
- 7.1.2. Pharmaceutic
- 7.1.3. Cosmetics
- 7.1.4. Daily Chemical
- 7.1.5. Scientific Research
- 7.2. Market Analysis, Insights and Forecast - by Types
- 7.2.1. Food Grade
- 7.2.2. Bacteriological Grade
- 7.1. Market Analysis, Insights and Forecast - by Application
- 8. Europe Agar Analysis, Insights and Forecast, 2020-2032
- 8.1. Market Analysis, Insights and Forecast - by Application
- 8.1.1. Food Industry
- 8.1.2. Pharmaceutic
- 8.1.3. Cosmetics
- 8.1.4. Daily Chemical
- 8.1.5. Scientific Research
- 8.2. Market Analysis, Insights and Forecast - by Types
- 8.2.1. Food Grade
- 8.2.2. Bacteriological Grade
- 8.1. Market Analysis, Insights and Forecast - by Application
- 9. Middle East & Africa Agar Analysis, Insights and Forecast, 2020-2032
- 9.1. Market Analysis, Insights and Forecast - by Application
- 9.1.1. Food Industry
- 9.1.2. Pharmaceutic
- 9.1.3. Cosmetics
- 9.1.4. Daily Chemical
- 9.1.5. Scientific Research
- 9.2. Market Analysis, Insights and Forecast - by Types
- 9.2.1. Food Grade
- 9.2.2. Bacteriological Grade
- 9.1. Market Analysis, Insights and Forecast - by Application
- 10. Asia Pacific Agar Analysis, Insights and Forecast, 2020-2032
- 10.1. Market Analysis, Insights and Forecast - by Application
- 10.1.1. Food Industry
- 10.1.2. Pharmaceutic
- 10.1.3. Cosmetics
- 10.1.4. Daily Chemical
- 10.1.5. Scientific Research
- 10.2. Market Analysis, Insights and Forecast - by Types
- 10.2.1. Food Grade
- 10.2.2. Bacteriological Grade
- 10.1. Market Analysis, Insights and Forecast - by Application
- 11. Competitive Analysis
- 11.1. Global Market Share Analysis 2025
- 11.2. Company Profiles
- 11.2.1 Ina Food
- 11.2.1.1. Overview
- 11.2.1.2. Products
- 11.2.1.3. SWOT Analysis
- 11.2.1.4. Recent Developments
- 11.2.1.5. Financials (Based on Availability)
- 11.2.2 Agarindo Bogatama
- 11.2.2.1. Overview
- 11.2.2.2. Products
- 11.2.2.3. SWOT Analysis
- 11.2.2.4. Recent Developments
- 11.2.2.5. Financials (Based on Availability)
- 11.2.3 Marine Hydrocolloids
- 11.2.3.1. Overview
- 11.2.3.2. Products
- 11.2.3.3. SWOT Analysis
- 11.2.3.4. Recent Developments
- 11.2.3.5. Financials (Based on Availability)
- 11.2.4 ROKO
- 11.2.4.1. Overview
- 11.2.4.2. Products
- 11.2.4.3. SWOT Analysis
- 11.2.4.4. Recent Developments
- 11.2.4.5. Financials (Based on Availability)
- 11.2.5 Agarmex
- 11.2.5.1. Overview
- 11.2.5.2. Products
- 11.2.5.3. SWOT Analysis
- 11.2.5.4. Recent Developments
- 11.2.5.5. Financials (Based on Availability)
- 11.2.6 Hispanagar
- 11.2.6.1. Overview
- 11.2.6.2. Products
- 11.2.6.3. SWOT Analysis
- 11.2.6.4. Recent Developments
- 11.2.6.5. Financials (Based on Availability)
- 11.2.7 Sobigel
- 11.2.7.1. Overview
- 11.2.7.2. Products
- 11.2.7.3. SWOT Analysis
- 11.2.7.4. Recent Developments
- 11.2.7.5. Financials (Based on Availability)
- 11.2.8 B&V Agar
- 11.2.8.1. Overview
- 11.2.8.2. Products
- 11.2.8.3. SWOT Analysis
- 11.2.8.4. Recent Developments
- 11.2.8.5. Financials (Based on Availability)
- 11.2.9 Iberagar
- 11.2.9.1. Overview
- 11.2.9.2. Products
- 11.2.9.3. SWOT Analysis
- 11.2.9.4. Recent Developments
- 11.2.9.5. Financials (Based on Availability)
- 11.2.10 Zhenpai
- 11.2.10.1. Overview
- 11.2.10.2. Products
- 11.2.10.3. SWOT Analysis
- 11.2.10.4. Recent Developments
- 11.2.10.5. Financials (Based on Availability)
- 11.2.11 Agar Brasileiro
- 11.2.11.1. Overview
- 11.2.11.2. Products
- 11.2.11.3. SWOT Analysis
- 11.2.11.4. Recent Developments
- 11.2.11.5. Financials (Based on Availability)
- 11.2.12 Green Fresh Group
- 11.2.12.1. Overview
- 11.2.12.2. Products
- 11.2.12.3. SWOT Analysis
- 11.2.12.4. Recent Developments
- 11.2.12.5. Financials (Based on Availability)
- 11.2.13 Fujian Global Ocean Biotechnology
- 11.2.13.1. Overview
- 11.2.13.2. Products
- 11.2.13.3. SWOT Analysis
- 11.2.13.4. Recent Developments
- 11.2.13.5. Financials (Based on Availability)
- 11.2.14 Qingdao Gather Great Ocean
- 11.2.14.1. Overview
- 11.2.14.2. Products
- 11.2.14.3. SWOT Analysis
- 11.2.14.4. Recent Developments
- 11.2.14.5. Financials (Based on Availability)
- 11.2.15 Java Biocolloid
- 11.2.15.1. Overview
- 11.2.15.2. Products
- 11.2.15.3. SWOT Analysis
- 11.2.15.4. Recent Developments
- 11.2.15.5. Financials (Based on Availability)
- 11.2.16 Fujian Wuyi Feiyan Agar
- 11.2.16.1. Overview
- 11.2.16.2. Products
- 11.2.16.3. SWOT Analysis
- 11.2.16.4. Recent Developments
- 11.2.16.5. Financials (Based on Availability)
- 11.2.17 Guandong Hizense Seaweed
- 11.2.17.1. Overview
- 11.2.17.2. Products
- 11.2.17.3. SWOT Analysis
- 11.2.17.4. Recent Developments
- 11.2.17.5. Financials (Based on Availability)
- 11.2.18 Fujian Yange
- 11.2.18.1. Overview
- 11.2.18.2. Products
- 11.2.18.3. SWOT Analysis
- 11.2.18.4. Recent Developments
- 11.2.18.5. Financials (Based on Availability)
- 11.2.19 Xiamen Hkay
- 11.2.19.1. Overview
- 11.2.19.2. Products
- 11.2.19.3. SWOT Analysis
- 11.2.19.4. Recent Developments
- 11.2.19.5. Financials (Based on Availability)
- 11.2.20 Putian Changde
- 11.2.20.1. Overview
- 11.2.20.2. Products
- 11.2.20.3. SWOT Analysis
- 11.2.20.4. Recent Developments
- 11.2.20.5. Financials (Based on Availability)
- 11.2.1 Ina Food
List of Figures
- Figure 1: Global Agar Revenue Breakdown (million, %) by Region 2025 & 2033
- Figure 2: Global Agar Volume Breakdown (K, %) by Region 2025 & 2033
- Figure 3: North America Agar Revenue (million), by Application 2025 & 2033
- Figure 4: North America Agar Volume (K), by Application 2025 & 2033
- Figure 5: North America Agar Revenue Share (%), by Application 2025 & 2033
- Figure 6: North America Agar Volume Share (%), by Application 2025 & 2033
- Figure 7: North America Agar Revenue (million), by Types 2025 & 2033
- Figure 8: North America Agar Volume (K), by Types 2025 & 2033
- Figure 9: North America Agar Revenue Share (%), by Types 2025 & 2033
- Figure 10: North America Agar Volume Share (%), by Types 2025 & 2033
- Figure 11: North America Agar Revenue (million), by Country 2025 & 2033
- Figure 12: North America Agar Volume (K), by Country 2025 & 2033
- Figure 13: North America Agar Revenue Share (%), by Country 2025 & 2033
- Figure 14: North America Agar Volume Share (%), by Country 2025 & 2033
- Figure 15: South America Agar Revenue (million), by Application 2025 & 2033
- Figure 16: South America Agar Volume (K), by Application 2025 & 2033
- Figure 17: South America Agar Revenue Share (%), by Application 2025 & 2033
- Figure 18: South America Agar Volume Share (%), by Application 2025 & 2033
- Figure 19: South America Agar Revenue (million), by Types 2025 & 2033
- Figure 20: South America Agar Volume (K), by Types 2025 & 2033
- Figure 21: South America Agar Revenue Share (%), by Types 2025 & 2033
- Figure 22: South America Agar Volume Share (%), by Types 2025 & 2033
- Figure 23: South America Agar Revenue (million), by Country 2025 & 2033
- Figure 24: South America Agar Volume (K), by Country 2025 & 2033
- Figure 25: South America Agar Revenue Share (%), by Country 2025 & 2033
- Figure 26: South America Agar Volume Share (%), by Country 2025 & 2033
- Figure 27: Europe Agar Revenue (million), by Application 2025 & 2033
- Figure 28: Europe Agar Volume (K), by Application 2025 & 2033
- Figure 29: Europe Agar Revenue Share (%), by Application 2025 & 2033
- Figure 30: Europe Agar Volume Share (%), by Application 2025 & 2033
- Figure 31: Europe Agar Revenue (million), by Types 2025 & 2033
- Figure 32: Europe Agar Volume (K), by Types 2025 & 2033
- Figure 33: Europe Agar Revenue Share (%), by Types 2025 & 2033
- Figure 34: Europe Agar Volume Share (%), by Types 2025 & 2033
- Figure 35: Europe Agar Revenue (million), by Country 2025 & 2033
- Figure 36: Europe Agar Volume (K), by Country 2025 & 2033
- Figure 37: Europe Agar Revenue Share (%), by Country 2025 & 2033
- Figure 38: Europe Agar Volume Share (%), by Country 2025 & 2033
- Figure 39: Middle East & Africa Agar Revenue (million), by Application 2025 & 2033
- Figure 40: Middle East & Africa Agar Volume (K), by Application 2025 & 2033
- Figure 41: Middle East & Africa Agar Revenue Share (%), by Application 2025 & 2033
- Figure 42: Middle East & Africa Agar Volume Share (%), by Application 2025 & 2033
- Figure 43: Middle East & Africa Agar Revenue (million), by Types 2025 & 2033
- Figure 44: Middle East & Africa Agar Volume (K), by Types 2025 & 2033
- Figure 45: Middle East & Africa Agar Revenue Share (%), by Types 2025 & 2033
- Figure 46: Middle East & Africa Agar Volume Share (%), by Types 2025 & 2033
- Figure 47: Middle East & Africa Agar Revenue (million), by Country 2025 & 2033
- Figure 48: Middle East & Africa Agar Volume (K), by Country 2025 & 2033
- Figure 49: Middle East & Africa Agar Revenue Share (%), by Country 2025 & 2033
- Figure 50: Middle East & Africa Agar Volume Share (%), by Country 2025 & 2033
- Figure 51: Asia Pacific Agar Revenue (million), by Application 2025 & 2033
- Figure 52: Asia Pacific Agar Volume (K), by Application 2025 & 2033
- Figure 53: Asia Pacific Agar Revenue Share (%), by Application 2025 & 2033
- Figure 54: Asia Pacific Agar Volume Share (%), by Application 2025 & 2033
- Figure 55: Asia Pacific Agar Revenue (million), by Types 2025 & 2033
- Figure 56: Asia Pacific Agar Volume (K), by Types 2025 & 2033
- Figure 57: Asia Pacific Agar Revenue Share (%), by Types 2025 & 2033
- Figure 58: Asia Pacific Agar Volume Share (%), by Types 2025 & 2033
- Figure 59: Asia Pacific Agar Revenue (million), by Country 2025 & 2033
- Figure 60: Asia Pacific Agar Volume (K), by Country 2025 & 2033
- Figure 61: Asia Pacific Agar Revenue Share (%), by Country 2025 & 2033
- Figure 62: Asia Pacific Agar Volume Share (%), by Country 2025 & 2033
List of Tables
- Table 1: Global Agar Revenue million Forecast, by Application 2020 & 2033
- Table 2: Global Agar Volume K Forecast, by Application 2020 & 2033
- Table 3: Global Agar Revenue million Forecast, by Types 2020 & 2033
- Table 4: Global Agar Volume K Forecast, by Types 2020 & 2033
- Table 5: Global Agar Revenue million Forecast, by Region 2020 & 2033
- Table 6: Global Agar Volume K Forecast, by Region 2020 & 2033
- Table 7: Global Agar Revenue million Forecast, by Application 2020 & 2033
- Table 8: Global Agar Volume K Forecast, by Application 2020 & 2033
- Table 9: Global Agar Revenue million Forecast, by Types 2020 & 2033
- Table 10: Global Agar Volume K Forecast, by Types 2020 & 2033
- Table 11: Global Agar Revenue million Forecast, by Country 2020 & 2033
- Table 12: Global Agar Volume K Forecast, by Country 2020 & 2033
- Table 13: United States Agar Revenue (million) Forecast, by Application 2020 & 2033
- Table 14: United States Agar Volume (K) Forecast, by Application 2020 & 2033
- Table 15: Canada Agar Revenue (million) Forecast, by Application 2020 & 2033
- Table 16: Canada Agar Volume (K) Forecast, by Application 2020 & 2033
- Table 17: Mexico Agar Revenue (million) Forecast, by Application 2020 & 2033
- Table 18: Mexico Agar Volume (K) Forecast, by Application 2020 & 2033
- Table 19: Global Agar Revenue million Forecast, by Application 2020 & 2033
- Table 20: Global Agar Volume K Forecast, by Application 2020 & 2033
- Table 21: Global Agar Revenue million Forecast, by Types 2020 & 2033
- Table 22: Global Agar Volume K Forecast, by Types 2020 & 2033
- Table 23: Global Agar Revenue million Forecast, by Country 2020 & 2033
- Table 24: Global Agar Volume K Forecast, by Country 2020 & 2033
- Table 25: Brazil Agar Revenue (million) Forecast, by Application 2020 & 2033
- Table 26: Brazil Agar Volume (K) Forecast, by Application 2020 & 2033
- Table 27: Argentina Agar Revenue (million) Forecast, by Application 2020 & 2033
- Table 28: Argentina Agar Volume (K) Forecast, by Application 2020 & 2033
- Table 29: Rest of South America Agar Revenue (million) Forecast, by Application 2020 & 2033
- Table 30: Rest of South America Agar Volume (K) Forecast, by Application 2020 & 2033
- Table 31: Global Agar Revenue million Forecast, by Application 2020 & 2033
- Table 32: Global Agar Volume K Forecast, by Application 2020 & 2033
- Table 33: Global Agar Revenue million Forecast, by Types 2020 & 2033
- Table 34: Global Agar Volume K Forecast, by Types 2020 & 2033
- Table 35: Global Agar Revenue million Forecast, by Country 2020 & 2033
- Table 36: Global Agar Volume K Forecast, by Country 2020 & 2033
- Table 37: United Kingdom Agar Revenue (million) Forecast, by Application 2020 & 2033
- Table 38: United Kingdom Agar Volume (K) Forecast, by Application 2020 & 2033
- Table 39: Germany Agar Revenue (million) Forecast, by Application 2020 & 2033
- Table 40: Germany Agar Volume (K) Forecast, by Application 2020 & 2033
- Table 41: France Agar Revenue (million) Forecast, by Application 2020 & 2033
- Table 42: France Agar Volume (K) Forecast, by Application 2020 & 2033
- Table 43: Italy Agar Revenue (million) Forecast, by Application 2020 & 2033
- Table 44: Italy Agar Volume (K) Forecast, by Application 2020 & 2033
- Table 45: Spain Agar Revenue (million) Forecast, by Application 2020 & 2033
- Table 46: Spain Agar Volume (K) Forecast, by Application 2020 & 2033
- Table 47: Russia Agar Revenue (million) Forecast, by Application 2020 & 2033
- Table 48: Russia Agar Volume (K) Forecast, by Application 2020 & 2033
- Table 49: Benelux Agar Revenue (million) Forecast, by Application 2020 & 2033
- Table 50: Benelux Agar Volume (K) Forecast, by Application 2020 & 2033
- Table 51: Nordics Agar Revenue (million) Forecast, by Application 2020 & 2033
- Table 52: Nordics Agar Volume (K) Forecast, by Application 2020 & 2033
- Table 53: Rest of Europe Agar Revenue (million) Forecast, by Application 2020 & 2033
- Table 54: Rest of Europe Agar Volume (K) Forecast, by Application 2020 & 2033
- Table 55: Global Agar Revenue million Forecast, by Application 2020 & 2033
- Table 56: Global Agar Volume K Forecast, by Application 2020 & 2033
- Table 57: Global Agar Revenue million Forecast, by Types 2020 & 2033
- Table 58: Global Agar Volume K Forecast, by Types 2020 & 2033
- Table 59: Global Agar Revenue million Forecast, by Country 2020 & 2033
- Table 60: Global Agar Volume K Forecast, by Country 2020 & 2033
- Table 61: Turkey Agar Revenue (million) Forecast, by Application 2020 & 2033
- Table 62: Turkey Agar Volume (K) Forecast, by Application 2020 & 2033
- Table 63: Israel Agar Revenue (million) Forecast, by Application 2020 & 2033
- Table 64: Israel Agar Volume (K) Forecast, by Application 2020 & 2033
- Table 65: GCC Agar Revenue (million) Forecast, by Application 2020 & 2033
- Table 66: GCC Agar Volume (K) Forecast, by Application 2020 & 2033
- Table 67: North Africa Agar Revenue (million) Forecast, by Application 2020 & 2033
- Table 68: North Africa Agar Volume (K) Forecast, by Application 2020 & 2033
- Table 69: South Africa Agar Revenue (million) Forecast, by Application 2020 & 2033
- Table 70: South Africa Agar Volume (K) Forecast, by Application 2020 & 2033
- Table 71: Rest of Middle East & Africa Agar Revenue (million) Forecast, by Application 2020 & 2033
- Table 72: Rest of Middle East & Africa Agar Volume (K) Forecast, by Application 2020 & 2033
- Table 73: Global Agar Revenue million Forecast, by Application 2020 & 2033
- Table 74: Global Agar Volume K Forecast, by Application 2020 & 2033
- Table 75: Global Agar Revenue million Forecast, by Types 2020 & 2033
- Table 76: Global Agar Volume K Forecast, by Types 2020 & 2033
- Table 77: Global Agar Revenue million Forecast, by Country 2020 & 2033
- Table 78: Global Agar Volume K Forecast, by Country 2020 & 2033
- Table 79: China Agar Revenue (million) Forecast, by Application 2020 & 2033
- Table 80: China Agar Volume (K) Forecast, by Application 2020 & 2033
- Table 81: India Agar Revenue (million) Forecast, by Application 2020 & 2033
- Table 82: India Agar Volume (K) Forecast, by Application 2020 & 2033
- Table 83: Japan Agar Revenue (million) Forecast, by Application 2020 & 2033
- Table 84: Japan Agar Volume (K) Forecast, by Application 2020 & 2033
- Table 85: South Korea Agar Revenue (million) Forecast, by Application 2020 & 2033
- Table 86: South Korea Agar Volume (K) Forecast, by Application 2020 & 2033
- Table 87: ASEAN Agar Revenue (million) Forecast, by Application 2020 & 2033
- Table 88: ASEAN Agar Volume (K) Forecast, by Application 2020 & 2033
- Table 89: Oceania Agar Revenue (million) Forecast, by Application 2020 & 2033
- Table 90: Oceania Agar Volume (K) Forecast, by Application 2020 & 2033
- Table 91: Rest of Asia Pacific Agar Revenue (million) Forecast, by Application 2020 & 2033
- Table 92: Rest of Asia Pacific Agar Volume (K) Forecast, by Application 2020 & 2033
Frequently Asked Questions
1. What is the projected Compound Annual Growth Rate (CAGR) of the Agar?
The projected CAGR is approximately 6.9%.
2. Which companies are prominent players in the Agar?
Key companies in the market include Ina Food, Agarindo Bogatama, Marine Hydrocolloids, ROKO, Agarmex, Hispanagar, Sobigel, B&V Agar, Iberagar, Zhenpai, Agar Brasileiro, Green Fresh Group, Fujian Global Ocean Biotechnology, Qingdao Gather Great Ocean, Java Biocolloid, Fujian Wuyi Feiyan Agar, Guandong Hizense Seaweed, Fujian Yange, Xiamen Hkay, Putian Changde.
3. What are the main segments of the Agar?
The market segments include Application, Types.
4. Can you provide details about the market size?
The market size is estimated to be USD 422 million as of 2022.
5. What are some drivers contributing to market growth?
N/A
6. What are the notable trends driving market growth?
N/A
7. Are there any restraints impacting market growth?
N/A
8. Can you provide examples of recent developments in the market?
N/A
9. What pricing options are available for accessing the report?
Pricing options include single-user, multi-user, and enterprise licenses priced at USD 3950.00, USD 5925.00, and USD 7900.00 respectively.
10. Is the market size provided in terms of value or volume?
The market size is provided in terms of value, measured in million and volume, measured in K.
11. Are there any specific market keywords associated with the report?
Yes, the market keyword associated with the report is "Agar," which aids in identifying and referencing the specific market segment covered.
12. How do I determine which pricing option suits my needs best?
The pricing options vary based on user requirements and access needs. Individual users may opt for single-user licenses, while businesses requiring broader access may choose multi-user or enterprise licenses for cost-effective access to the report.
13. Are there any additional resources or data provided in the Agar report?
While the report offers comprehensive insights, it's advisable to review the specific contents or supplementary materials provided to ascertain if additional resources or data are available.
14. How can I stay updated on further developments or reports in the Agar?
To stay informed about further developments, trends, and reports in the Agar, consider subscribing to industry newsletters, following relevant companies and organizations, or regularly checking reputable industry news sources and publications.
Methodology
Step 1 - Identification of Relevant Samples Size from Population Database


Step 2 - Approaches for Defining Global Market Size (Value, Volume* & Price*)

Note*: In applicable scenarios
Step 3 - Data Sources
Primary Research
- Web Analytics
- Survey Reports
- Research Institute
- Latest Research Reports
- Opinion Leaders
Secondary Research
- Annual Reports
- White Paper
- Latest Press Release
- Industry Association
- Paid Database
- Investor Presentations

Step 4 - Data Triangulation
Involves using different sources of information in order to increase the validity of a study
These sources are likely to be stakeholders in a program - participants, other researchers, program staff, other community members, and so on.
Then we put all data in single framework & apply various statistical tools to find out the dynamic on the market.
During the analysis stage, feedback from the stakeholder groups would be compared to determine areas of agreement as well as areas of divergence