

Key Insights
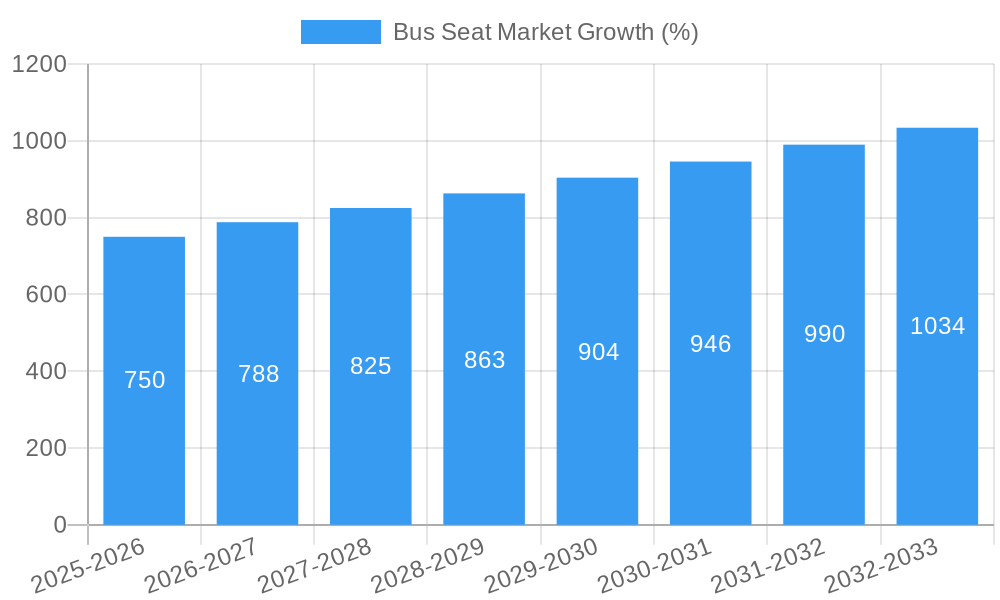
The global bus seat market is experiencing robust growth, driven by increasing passenger transportation needs across various segments, including public transit and school buses. A compound annual growth rate (CAGR) exceeding 5% from 2019 to 2024 suggests a consistently expanding market. This growth is fueled by several key factors. Firstly, the rising global population and increasing urbanization are leading to greater demand for efficient and comfortable public transportation, necessitating a larger supply of bus seats. Secondly, advancements in seat design, incorporating enhanced ergonomics and safety features, are boosting market appeal. The incorporation of features like improved cushioning, adjustable backrests, and safety restraints caters to both passenger comfort and regulatory compliance, driving demand for premium bus seats. Furthermore, the expanding e-commerce sector and improved supply chains are facilitating smoother product distribution and increased availability, contributing to market expansion. However, fluctuating raw material prices and the impact of global economic conditions pose potential challenges to sustained growth.
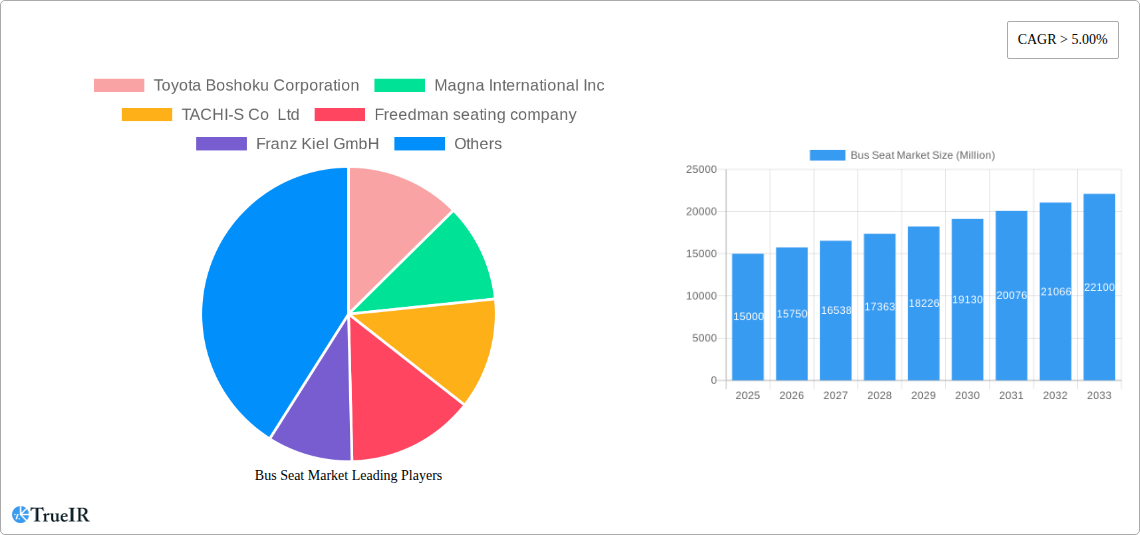
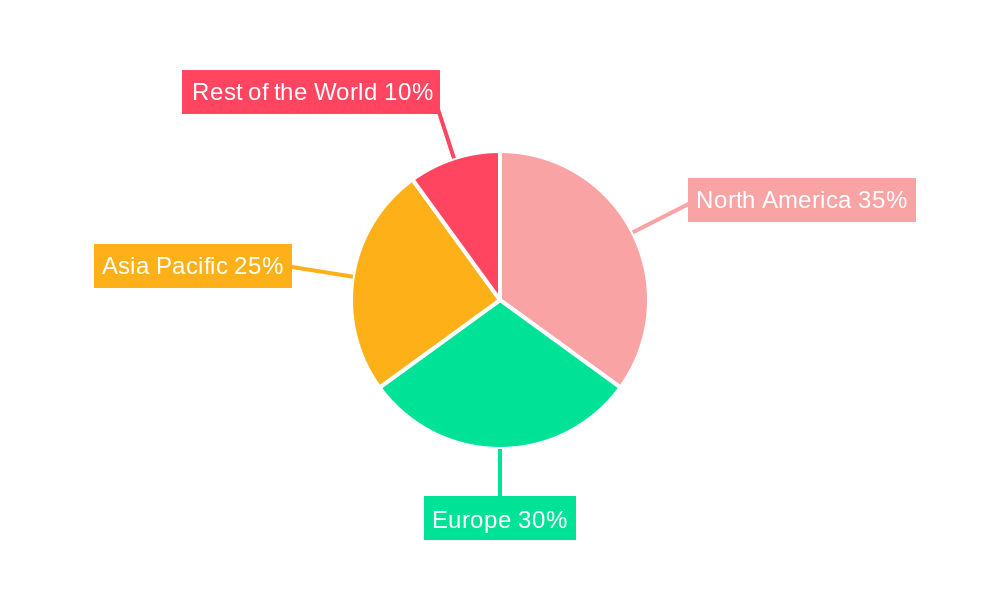
Segment-wise, the recliner seat type is expected to witness faster growth compared to standard seats due to its increased comfort and appeal among passengers. Similarly, within the component type segment, the demand for advanced upholstery materials and high-quality frames is expected to drive growth. Geographically, North America and Europe currently hold significant market shares, attributed to established public transportation systems and relatively high disposable incomes. However, the Asia-Pacific region, especially India and China, presents a significant growth opportunity given rapid urbanization and infrastructure development. Major players in the market, including Toyota Boshoku Corporation, Magna International Inc., and others, are focusing on strategic partnerships, technological innovation, and regional expansion to maintain competitiveness and capture a larger market share. The market is poised for further expansion, driven by continuous infrastructure investments, technological advancements, and rising passenger demand for comfortable and safe bus travel.
Dynamic Bus Seat Market Report: 2019-2033
This comprehensive report provides a detailed analysis of the global Bus Seat Market, offering invaluable insights for stakeholders across the value chain. With a study period spanning 2019-2033, a base year of 2025, and a forecast period of 2025-2033, this report is your definitive guide to understanding the current market landscape and future growth trajectory. The market is expected to reach xx Million by 2033, exhibiting a CAGR of xx% during the forecast period.
Bus Seat Market Structure & Competitive Landscape
The global bus seat market is moderately concentrated, with a few major players holding significant market share. However, the presence of several regional and niche players fosters competition and innovation. The market structure is influenced by factors such as technological advancements, regulatory changes, and the increasing demand for enhanced passenger comfort and safety features. Mergers and acquisitions (M&A) activity has been relatively moderate in recent years, with a reported xx Million in M&A volume in 2024. Concentration ratios are expected to remain relatively stable in the coming years, with a Herfindahl-Hirschman Index (HHI) of approximately xx.
Key Market Characteristics:
- High barriers to entry: Significant capital investment and specialized manufacturing capabilities are required.
- Strong brand loyalty: Established brands benefit from reputation and customer trust.
- Product differentiation: Innovation in materials, designs, and features is crucial for competitiveness.
- Government regulations: Safety and emission standards impact market dynamics.
- Growing demand for luxury and technologically advanced seating: This trend pushes the market towards higher-value products.
Bus Seat Market Market Trends & Opportunities
The global bus seat market is experiencing robust growth, driven by factors such as increasing passenger traffic, rising disposable incomes in emerging economies, and the expansion of public transportation networks. Technological advancements, such as the integration of advanced comfort features and smart technologies, are transforming the market. Consumers are increasingly demanding enhanced comfort, safety, and convenience, leading to a higher preference for technologically advanced and ergonomic seating solutions. The market exhibits significant regional variations, with certain regions demonstrating faster growth than others due to varying levels of infrastructure development and economic conditions. Competitive dynamics are characterized by both intense rivalry among established players and the emergence of new entrants offering innovative products and solutions. The market penetration rate of technologically advanced bus seats is increasing at a CAGR of xx%, indicating strong growth in this segment. Overall market size is projected to grow from xx Million in 2024 to xx Million by 2033, presenting numerous opportunities for both established and emerging players.
Dominant Markets & Segments in Bus Seat Market
The North American bus seat market is currently the largest, driven by factors including robust public transportation infrastructure and government investments. However, Asia-Pacific is projected to be the fastest-growing region due to rapid urbanization and rising demand for affordable and comfortable bus travel.
Key Growth Drivers by Segment:
- By Seat Type: The recliner segment is experiencing rapid growth due to the increasing demand for enhanced passenger comfort.
- By Component Type: The upholstery segment is expected to show significant growth due to innovation in materials and designs that enhance comfort and aesthetics.
- By Bus Type: The transit bus segment holds the largest market share; however, the school bus segment is exhibiting significant growth owing to stricter safety regulations and government initiatives.
Market Dominance Analysis:
- North America holds the largest market share currently due to high per capita income and extensive bus transportation networks.
- Asia-Pacific is anticipated to witness the highest growth rate owing to increasing infrastructure development and population growth.
- Europe shows steady growth, driven by government initiatives to improve public transportation.
Bus Seat Market Product Analysis
The bus seat market is witnessing continuous product innovation, driven by advancements in materials science, ergonomics, and smart technologies. Manufacturers are focusing on developing lighter, more durable, and comfortable seats with enhanced safety features. Integration of technologies such as heating, ventilation, massage functions, and USB charging ports is driving premiumization in the market. The adoption of sustainable materials and manufacturing processes is gaining traction, as consumers and governments increasingly prioritize environmental concerns. These innovations are improving passenger experience and enhancing the overall value proposition of bus travel.
Key Drivers, Barriers & Challenges in Bus Seat Market
Key Drivers:
- Rising demand for comfortable and safe public transport.
- Growing urbanization and increasing passenger traffic.
- Technological advancements in seating design and materials.
- Government initiatives promoting sustainable and efficient public transportation.
Challenges and Restraints:
- Fluctuations in raw material prices impact production costs.
- Stringent safety and emission regulations pose challenges for manufacturers.
- Intense competition from both established and emerging players.
- Supply chain disruptions caused by geopolitical instability and pandemics. The impact of supply chain disruptions on the market is estimated to be approximately xx Million annually.
Growth Drivers in the Bus Seat Market Market
The bus seat market is driven by several key factors including increased investment in public transportation infrastructure, rising disposable incomes leading to greater demand for comfortable travel, advancements in materials science resulting in lighter and more durable seats, and government regulations promoting safety standards.
Challenges Impacting Bus Seat Market Growth
Challenges include volatile raw material costs affecting profitability, stringent regulatory compliance adding to manufacturing complexity, and stiff competition among established and new entrants impacting market share.
Key Players Shaping the Bus Seat Market Market
- Toyota Boshoku Corporation
- Magna International Inc
- TACHI-S Co Ltd
- Freedman seating company
- Franz Kiel GmbH
- Commercial Vehicle Group Inc
- Harita Seating Company
- Prakash Seating Private Ltd
- Lazzerini SRL
- Grammer AG
Significant Bus Seat Market Industry Milestones
- August 2022: Volvo Buses India launches the next-gen Volvo 9600 platform, featuring 15m and 13.5m coaches with increased passenger capacity. This highlights the trend towards larger and more comfortable buses, driving demand for advanced seating systems.
- October 2021: Lear Corporation's acquisition of Kongsberg Automotive's ICS business unit strengthens its position in the comfort seating segment, signaling a consolidation trend in the market. This focuses attention on advanced features like massage and ventilation.
- April 2021: Freedman Seating Company introduces SeatLink™, a seat information tracking system, enhancing passenger safety and management capabilities within buses. This showcases technological innovation to improve operational efficiency and passenger experience.
Future Outlook for Bus Seat Market Market
The bus seat market is poised for continued growth, driven by sustained investment in public transportation, technological advancements focused on improved comfort and safety, and rising demand for sustainable seating solutions. Strategic opportunities exist for manufacturers who can effectively leverage technological innovations, cater to evolving consumer preferences, and optimize their supply chains to address potential disruptions. The market's overall potential remains substantial, with ample room for expansion in both developed and emerging markets.
Bus Seat Market Segmentation
-
1. Seat Type
- 1.1. Standard
- 1.2. Recliner
-
2. Component Type
- 2.1. Frame
- 2.2. Upholstery
-
3. Bus Type
- 3.1. Transit Bus
- 3.2. School Bus
- 3.3. Others
Bus Seat Market Segmentation By Geography
-
1. North America
- 1.1. United States
- 1.2. Canada
- 1.3. Rest of North America
-
2. Europe
- 2.1. Germany
- 2.2. United Kingdom
- 2.3. France
- 2.4. Rest of Europe
-
3. Asia Pacific
- 3.1. India
- 3.2. China
- 3.3. Japan
- 3.4. South Korea
- 3.5. Rest of Asia Pacific
-
4. Rest of the World
- 4.1. South America
- 4.2. Middle East and Africa
Bus Seat Market REPORT HIGHLIGHTS
| Aspects | Details |
|---|---|
| Study Period | 2019-2033 |
| Base Year | 2024 |
| Estimated Year | 2025 |
| Forecast Period | 2025-2033 |
| Historical Period | 2019-2024 |
| Growth Rate | CAGR of > 5.00% from 2019-2033 |
| Segmentation |
|
Table of Contents
- 1. Introduction
- 1.1. Research Scope
- 1.2. Market Segmentation
- 1.3. Research Methodology
- 1.4. Definitions and Assumptions
- 2. Executive Summary
- 2.1. Introduction
- 3. Market Dynamics
- 3.1. Introduction
- 3.2. Market Drivers
- 3.2.1. Increase in Passenger Car Sales Propelling Market Growth
- 3.3. Market Restrains
- 3.3.1. Fluctuation in Raw Material Prices
- 3.4. Market Trends
- 3.4.1. Recliner Seats Segment of Market to Play key role in the Market
- 4. Market Factor Analysis
- 4.1. Porters Five Forces
- 4.2. Supply/Value Chain
- 4.3. PESTEL analysis
- 4.4. Market Entropy
- 4.5. Patent/Trademark Analysis
- 5. Global Bus Seat Market Analysis, Insights and Forecast, 2019-2031
- 5.1. Market Analysis, Insights and Forecast - by Seat Type
- 5.1.1. Standard
- 5.1.2. Recliner
- 5.2. Market Analysis, Insights and Forecast - by Component Type
- 5.2.1. Frame
- 5.2.2. Upholstery
- 5.3. Market Analysis, Insights and Forecast - by Bus Type
- 5.3.1. Transit Bus
- 5.3.2. School Bus
- 5.3.3. Others
- 5.4. Market Analysis, Insights and Forecast - by Region
- 5.4.1. North America
- 5.4.2. Europe
- 5.4.3. Asia Pacific
- 5.4.4. Rest of the World
- 5.1. Market Analysis, Insights and Forecast - by Seat Type
- 6. North America Bus Seat Market Analysis, Insights and Forecast, 2019-2031
- 6.1. Market Analysis, Insights and Forecast - by Seat Type
- 6.1.1. Standard
- 6.1.2. Recliner
- 6.2. Market Analysis, Insights and Forecast - by Component Type
- 6.2.1. Frame
- 6.2.2. Upholstery
- 6.3. Market Analysis, Insights and Forecast - by Bus Type
- 6.3.1. Transit Bus
- 6.3.2. School Bus
- 6.3.3. Others
- 6.1. Market Analysis, Insights and Forecast - by Seat Type
- 7. Europe Bus Seat Market Analysis, Insights and Forecast, 2019-2031
- 7.1. Market Analysis, Insights and Forecast - by Seat Type
- 7.1.1. Standard
- 7.1.2. Recliner
- 7.2. Market Analysis, Insights and Forecast - by Component Type
- 7.2.1. Frame
- 7.2.2. Upholstery
- 7.3. Market Analysis, Insights and Forecast - by Bus Type
- 7.3.1. Transit Bus
- 7.3.2. School Bus
- 7.3.3. Others
- 7.1. Market Analysis, Insights and Forecast - by Seat Type
- 8. Asia Pacific Bus Seat Market Analysis, Insights and Forecast, 2019-2031
- 8.1. Market Analysis, Insights and Forecast - by Seat Type
- 8.1.1. Standard
- 8.1.2. Recliner
- 8.2. Market Analysis, Insights and Forecast - by Component Type
- 8.2.1. Frame
- 8.2.2. Upholstery
- 8.3. Market Analysis, Insights and Forecast - by Bus Type
- 8.3.1. Transit Bus
- 8.3.2. School Bus
- 8.3.3. Others
- 8.1. Market Analysis, Insights and Forecast - by Seat Type
- 9. Rest of the World Bus Seat Market Analysis, Insights and Forecast, 2019-2031
- 9.1. Market Analysis, Insights and Forecast - by Seat Type
- 9.1.1. Standard
- 9.1.2. Recliner
- 9.2. Market Analysis, Insights and Forecast - by Component Type
- 9.2.1. Frame
- 9.2.2. Upholstery
- 9.3. Market Analysis, Insights and Forecast - by Bus Type
- 9.3.1. Transit Bus
- 9.3.2. School Bus
- 9.3.3. Others
- 9.1. Market Analysis, Insights and Forecast - by Seat Type
- 10. North America Bus Seat Market Analysis, Insights and Forecast, 2019-2031
- 10.1. Market Analysis, Insights and Forecast - By Country/Sub-region
- 10.1.1 United States
- 10.1.2 Canada
- 10.1.3 Rest of North America
- 11. Europe Bus Seat Market Analysis, Insights and Forecast, 2019-2031
- 11.1. Market Analysis, Insights and Forecast - By Country/Sub-region
- 11.1.1 Germany
- 11.1.2 United Kingdom
- 11.1.3 France
- 11.1.4 Rest of Europe
- 12. Asia Pacific Bus Seat Market Analysis, Insights and Forecast, 2019-2031
- 12.1. Market Analysis, Insights and Forecast - By Country/Sub-region
- 12.1.1 India
- 12.1.2 China
- 12.1.3 Japan
- 12.1.4 South Korea
- 12.1.5 Rest of Asia Pacific
- 13. Rest of the World Bus Seat Market Analysis, Insights and Forecast, 2019-2031
- 13.1. Market Analysis, Insights and Forecast - By Country/Sub-region
- 13.1.1 South America
- 13.1.2 Middle East and Africa
- 14. Competitive Analysis
- 14.1. Global Market Share Analysis 2024
- 14.2. Company Profiles
- 14.2.1 Toyota Boshoku Corporation
- 14.2.1.1. Overview
- 14.2.1.2. Products
- 14.2.1.3. SWOT Analysis
- 14.2.1.4. Recent Developments
- 14.2.1.5. Financials (Based on Availability)
- 14.2.2 Magna International Inc
- 14.2.2.1. Overview
- 14.2.2.2. Products
- 14.2.2.3. SWOT Analysis
- 14.2.2.4. Recent Developments
- 14.2.2.5. Financials (Based on Availability)
- 14.2.3 TACHI-S Co Ltd
- 14.2.3.1. Overview
- 14.2.3.2. Products
- 14.2.3.3. SWOT Analysis
- 14.2.3.4. Recent Developments
- 14.2.3.5. Financials (Based on Availability)
- 14.2.4 Freedman seating company
- 14.2.4.1. Overview
- 14.2.4.2. Products
- 14.2.4.3. SWOT Analysis
- 14.2.4.4. Recent Developments
- 14.2.4.5. Financials (Based on Availability)
- 14.2.5 Franz Kiel GmbH
- 14.2.5.1. Overview
- 14.2.5.2. Products
- 14.2.5.3. SWOT Analysis
- 14.2.5.4. Recent Developments
- 14.2.5.5. Financials (Based on Availability)
- 14.2.6 Commercial Vehicle Group Inc
- 14.2.6.1. Overview
- 14.2.6.2. Products
- 14.2.6.3. SWOT Analysis
- 14.2.6.4. Recent Developments
- 14.2.6.5. Financials (Based on Availability)
- 14.2.7 Harita Seating Company
- 14.2.7.1. Overview
- 14.2.7.2. Products
- 14.2.7.3. SWOT Analysis
- 14.2.7.4. Recent Developments
- 14.2.7.5. Financials (Based on Availability)
- 14.2.8 Prakash Seating Private Ltd
- 14.2.8.1. Overview
- 14.2.8.2. Products
- 14.2.8.3. SWOT Analysis
- 14.2.8.4. Recent Developments
- 14.2.8.5. Financials (Based on Availability)
- 14.2.9 Lazzerini SRL*List Not Exhaustive
- 14.2.9.1. Overview
- 14.2.9.2. Products
- 14.2.9.3. SWOT Analysis
- 14.2.9.4. Recent Developments
- 14.2.9.5. Financials (Based on Availability)
- 14.2.10 Grammer AG
- 14.2.10.1. Overview
- 14.2.10.2. Products
- 14.2.10.3. SWOT Analysis
- 14.2.10.4. Recent Developments
- 14.2.10.5. Financials (Based on Availability)
- 14.2.1 Toyota Boshoku Corporation
List of Figures
- Figure 1: Global Bus Seat Market Revenue Breakdown (Million, %) by Region 2024 & 2032
- Figure 2: North America Bus Seat Market Revenue (Million), by Country 2024 & 2032
- Figure 3: North America Bus Seat Market Revenue Share (%), by Country 2024 & 2032
- Figure 4: Europe Bus Seat Market Revenue (Million), by Country 2024 & 2032
- Figure 5: Europe Bus Seat Market Revenue Share (%), by Country 2024 & 2032
- Figure 6: Asia Pacific Bus Seat Market Revenue (Million), by Country 2024 & 2032
- Figure 7: Asia Pacific Bus Seat Market Revenue Share (%), by Country 2024 & 2032
- Figure 8: Rest of the World Bus Seat Market Revenue (Million), by Country 2024 & 2032
- Figure 9: Rest of the World Bus Seat Market Revenue Share (%), by Country 2024 & 2032
- Figure 10: North America Bus Seat Market Revenue (Million), by Seat Type 2024 & 2032
- Figure 11: North America Bus Seat Market Revenue Share (%), by Seat Type 2024 & 2032
- Figure 12: North America Bus Seat Market Revenue (Million), by Component Type 2024 & 2032
- Figure 13: North America Bus Seat Market Revenue Share (%), by Component Type 2024 & 2032
- Figure 14: North America Bus Seat Market Revenue (Million), by Bus Type 2024 & 2032
- Figure 15: North America Bus Seat Market Revenue Share (%), by Bus Type 2024 & 2032
- Figure 16: North America Bus Seat Market Revenue (Million), by Country 2024 & 2032
- Figure 17: North America Bus Seat Market Revenue Share (%), by Country 2024 & 2032
- Figure 18: Europe Bus Seat Market Revenue (Million), by Seat Type 2024 & 2032
- Figure 19: Europe Bus Seat Market Revenue Share (%), by Seat Type 2024 & 2032
- Figure 20: Europe Bus Seat Market Revenue (Million), by Component Type 2024 & 2032
- Figure 21: Europe Bus Seat Market Revenue Share (%), by Component Type 2024 & 2032
- Figure 22: Europe Bus Seat Market Revenue (Million), by Bus Type 2024 & 2032
- Figure 23: Europe Bus Seat Market Revenue Share (%), by Bus Type 2024 & 2032
- Figure 24: Europe Bus Seat Market Revenue (Million), by Country 2024 & 2032
- Figure 25: Europe Bus Seat Market Revenue Share (%), by Country 2024 & 2032
- Figure 26: Asia Pacific Bus Seat Market Revenue (Million), by Seat Type 2024 & 2032
- Figure 27: Asia Pacific Bus Seat Market Revenue Share (%), by Seat Type 2024 & 2032
- Figure 28: Asia Pacific Bus Seat Market Revenue (Million), by Component Type 2024 & 2032
- Figure 29: Asia Pacific Bus Seat Market Revenue Share (%), by Component Type 2024 & 2032
- Figure 30: Asia Pacific Bus Seat Market Revenue (Million), by Bus Type 2024 & 2032
- Figure 31: Asia Pacific Bus Seat Market Revenue Share (%), by Bus Type 2024 & 2032
- Figure 32: Asia Pacific Bus Seat Market Revenue (Million), by Country 2024 & 2032
- Figure 33: Asia Pacific Bus Seat Market Revenue Share (%), by Country 2024 & 2032
- Figure 34: Rest of the World Bus Seat Market Revenue (Million), by Seat Type 2024 & 2032
- Figure 35: Rest of the World Bus Seat Market Revenue Share (%), by Seat Type 2024 & 2032
- Figure 36: Rest of the World Bus Seat Market Revenue (Million), by Component Type 2024 & 2032
- Figure 37: Rest of the World Bus Seat Market Revenue Share (%), by Component Type 2024 & 2032
- Figure 38: Rest of the World Bus Seat Market Revenue (Million), by Bus Type 2024 & 2032
- Figure 39: Rest of the World Bus Seat Market Revenue Share (%), by Bus Type 2024 & 2032
- Figure 40: Rest of the World Bus Seat Market Revenue (Million), by Country 2024 & 2032
- Figure 41: Rest of the World Bus Seat Market Revenue Share (%), by Country 2024 & 2032
List of Tables
- Table 1: Global Bus Seat Market Revenue Million Forecast, by Region 2019 & 2032
- Table 2: Global Bus Seat Market Revenue Million Forecast, by Seat Type 2019 & 2032
- Table 3: Global Bus Seat Market Revenue Million Forecast, by Component Type 2019 & 2032
- Table 4: Global Bus Seat Market Revenue Million Forecast, by Bus Type 2019 & 2032
- Table 5: Global Bus Seat Market Revenue Million Forecast, by Region 2019 & 2032
- Table 6: Global Bus Seat Market Revenue Million Forecast, by Country 2019 & 2032
- Table 7: United States Bus Seat Market Revenue (Million) Forecast, by Application 2019 & 2032
- Table 8: Canada Bus Seat Market Revenue (Million) Forecast, by Application 2019 & 2032
- Table 9: Rest of North America Bus Seat Market Revenue (Million) Forecast, by Application 2019 & 2032
- Table 10: Global Bus Seat Market Revenue Million Forecast, by Country 2019 & 2032
- Table 11: Germany Bus Seat Market Revenue (Million) Forecast, by Application 2019 & 2032
- Table 12: United Kingdom Bus Seat Market Revenue (Million) Forecast, by Application 2019 & 2032
- Table 13: France Bus Seat Market Revenue (Million) Forecast, by Application 2019 & 2032
- Table 14: Rest of Europe Bus Seat Market Revenue (Million) Forecast, by Application 2019 & 2032
- Table 15: Global Bus Seat Market Revenue Million Forecast, by Country 2019 & 2032
- Table 16: India Bus Seat Market Revenue (Million) Forecast, by Application 2019 & 2032
- Table 17: China Bus Seat Market Revenue (Million) Forecast, by Application 2019 & 2032
- Table 18: Japan Bus Seat Market Revenue (Million) Forecast, by Application 2019 & 2032
- Table 19: South Korea Bus Seat Market Revenue (Million) Forecast, by Application 2019 & 2032
- Table 20: Rest of Asia Pacific Bus Seat Market Revenue (Million) Forecast, by Application 2019 & 2032
- Table 21: Global Bus Seat Market Revenue Million Forecast, by Country 2019 & 2032
- Table 22: South America Bus Seat Market Revenue (Million) Forecast, by Application 2019 & 2032
- Table 23: Middle East and Africa Bus Seat Market Revenue (Million) Forecast, by Application 2019 & 2032
- Table 24: Global Bus Seat Market Revenue Million Forecast, by Seat Type 2019 & 2032
- Table 25: Global Bus Seat Market Revenue Million Forecast, by Component Type 2019 & 2032
- Table 26: Global Bus Seat Market Revenue Million Forecast, by Bus Type 2019 & 2032
- Table 27: Global Bus Seat Market Revenue Million Forecast, by Country 2019 & 2032
- Table 28: United States Bus Seat Market Revenue (Million) Forecast, by Application 2019 & 2032
- Table 29: Canada Bus Seat Market Revenue (Million) Forecast, by Application 2019 & 2032
- Table 30: Rest of North America Bus Seat Market Revenue (Million) Forecast, by Application 2019 & 2032
- Table 31: Global Bus Seat Market Revenue Million Forecast, by Seat Type 2019 & 2032
- Table 32: Global Bus Seat Market Revenue Million Forecast, by Component Type 2019 & 2032
- Table 33: Global Bus Seat Market Revenue Million Forecast, by Bus Type 2019 & 2032
- Table 34: Global Bus Seat Market Revenue Million Forecast, by Country 2019 & 2032
- Table 35: Germany Bus Seat Market Revenue (Million) Forecast, by Application 2019 & 2032
- Table 36: United Kingdom Bus Seat Market Revenue (Million) Forecast, by Application 2019 & 2032
- Table 37: France Bus Seat Market Revenue (Million) Forecast, by Application 2019 & 2032
- Table 38: Rest of Europe Bus Seat Market Revenue (Million) Forecast, by Application 2019 & 2032
- Table 39: Global Bus Seat Market Revenue Million Forecast, by Seat Type 2019 & 2032
- Table 40: Global Bus Seat Market Revenue Million Forecast, by Component Type 2019 & 2032
- Table 41: Global Bus Seat Market Revenue Million Forecast, by Bus Type 2019 & 2032
- Table 42: Global Bus Seat Market Revenue Million Forecast, by Country 2019 & 2032
- Table 43: India Bus Seat Market Revenue (Million) Forecast, by Application 2019 & 2032
- Table 44: China Bus Seat Market Revenue (Million) Forecast, by Application 2019 & 2032
- Table 45: Japan Bus Seat Market Revenue (Million) Forecast, by Application 2019 & 2032
- Table 46: South Korea Bus Seat Market Revenue (Million) Forecast, by Application 2019 & 2032
- Table 47: Rest of Asia Pacific Bus Seat Market Revenue (Million) Forecast, by Application 2019 & 2032
- Table 48: Global Bus Seat Market Revenue Million Forecast, by Seat Type 2019 & 2032
- Table 49: Global Bus Seat Market Revenue Million Forecast, by Component Type 2019 & 2032
- Table 50: Global Bus Seat Market Revenue Million Forecast, by Bus Type 2019 & 2032
- Table 51: Global Bus Seat Market Revenue Million Forecast, by Country 2019 & 2032
- Table 52: South America Bus Seat Market Revenue (Million) Forecast, by Application 2019 & 2032
- Table 53: Middle East and Africa Bus Seat Market Revenue (Million) Forecast, by Application 2019 & 2032
Frequently Asked Questions
1. What is the projected Compound Annual Growth Rate (CAGR) of the Bus Seat Market?
The projected CAGR is approximately > 5.00%.
2. Which companies are prominent players in the Bus Seat Market?
Key companies in the market include Toyota Boshoku Corporation, Magna International Inc, TACHI-S Co Ltd, Freedman seating company, Franz Kiel GmbH, Commercial Vehicle Group Inc, Harita Seating Company, Prakash Seating Private Ltd, Lazzerini SRL*List Not Exhaustive, Grammer AG.
3. What are the main segments of the Bus Seat Market?
The market segments include Seat Type, Component Type, Bus Type.
4. Can you provide details about the market size?
The market size is estimated to be USD XX Million as of 2022.
5. What are some drivers contributing to market growth?
Increase in Passenger Car Sales Propelling Market Growth.
6. What are the notable trends driving market growth?
Recliner Seats Segment of Market to Play key role in the Market.
7. Are there any restraints impacting market growth?
Fluctuation in Raw Material Prices.
8. Can you provide examples of recent developments in the market?
In August 2022, Volvo Buses India, a division of VE Commercial Vehicles Limited, launched the next-gen Volvo 9600 platform. The first offerings on this platform are factory-built sleeper and seater coaches in 15m 6x2; and 13.5m 4x2 configurations. The 15m seater coach has a passenger capacity of 55, whereas the sleeper coach has 40 berths. The 13.5m coach seats up to 47 passengers, while the sleeper variant hosts 36 berths.
9. What pricing options are available for accessing the report?
Pricing options include single-user, multi-user, and enterprise licenses priced at USD 4750, USD 5250, and USD 8750 respectively.
10. Is the market size provided in terms of value or volume?
The market size is provided in terms of value, measured in Million.
11. Are there any specific market keywords associated with the report?
Yes, the market keyword associated with the report is "Bus Seat Market," which aids in identifying and referencing the specific market segment covered.
12. How do I determine which pricing option suits my needs best?
The pricing options vary based on user requirements and access needs. Individual users may opt for single-user licenses, while businesses requiring broader access may choose multi-user or enterprise licenses for cost-effective access to the report.
13. Are there any additional resources or data provided in the Bus Seat Market report?
While the report offers comprehensive insights, it's advisable to review the specific contents or supplementary materials provided to ascertain if additional resources or data are available.
14. How can I stay updated on further developments or reports in the Bus Seat Market?
To stay informed about further developments, trends, and reports in the Bus Seat Market, consider subscribing to industry newsletters, following relevant companies and organizations, or regularly checking reputable industry news sources and publications.
Methodology
Step 1 - Identification of Relevant Samples Size from Population Database


Step 2 - Approaches for Defining Global Market Size (Value, Volume* & Price*)

Note*: In applicable scenarios
Step 3 - Data Sources
Primary Research
- Web Analytics
- Survey Reports
- Research Institute
- Latest Research Reports
- Opinion Leaders
Secondary Research
- Annual Reports
- White Paper
- Latest Press Release
- Industry Association
- Paid Database
- Investor Presentations

Step 4 - Data Triangulation
Involves using different sources of information in order to increase the validity of a study
These sources are likely to be stakeholders in a program - participants, other researchers, program staff, other community members, and so on.
Then we put all data in single framework & apply various statistical tools to find out the dynamic on the market.
During the analysis stage, feedback from the stakeholder groups would be compared to determine areas of agreement as well as areas of divergence
