

Key Insights
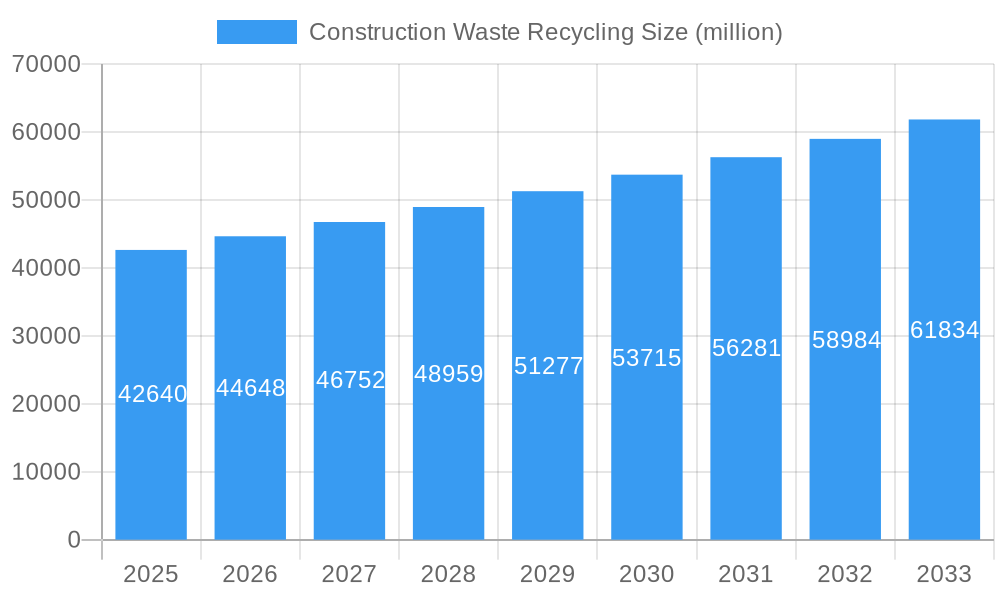
The global Construction Waste Recycling market is poised for robust growth, with an estimated market size of $42,640 million in 2025, projecting a Compound Annual Growth Rate (CAGR) of 4.8% through 2033. This expansion is largely fueled by increasingly stringent environmental regulations and a growing global emphasis on sustainable construction practices. Governments worldwide are implementing policies that mandate waste reduction and encourage the reuse and recycling of construction and demolition (C&D) debris, driving demand for innovative recycling technologies and services. Furthermore, the rising cost of virgin raw materials makes recycled construction materials a more economically viable alternative, incentivizing widespread adoption across the industry. The burgeoning urbanization and infrastructure development, particularly in emerging economies, are significantly contributing to the volume of construction waste generated, thereby creating a continuous demand for recycling solutions.
Construction Waste Recycling Market Size (In Billion)
Key drivers for this market's upward trajectory include the increasing adoption of circular economy principles within the construction sector and advancements in recycling technologies that enhance the efficiency and quality of recycled materials. Prominent applications for recycled construction waste include building and construction, automotive manufacturing, equipment manufacturing, and shipbuilding, where recycled materials can be used in aggregates, insulation, concrete, and other essential components. The market is also witnessing a notable trend towards the development of advanced sorting and processing technologies that allow for higher recovery rates of valuable materials like steel, aluminum, and glass. While the market benefits from these tailwinds, challenges such as the cost of transporting and processing C&D waste, as well as the need for greater awareness and education among construction stakeholders regarding the benefits and availability of recycled materials, will need to be addressed to fully unlock the market's potential.
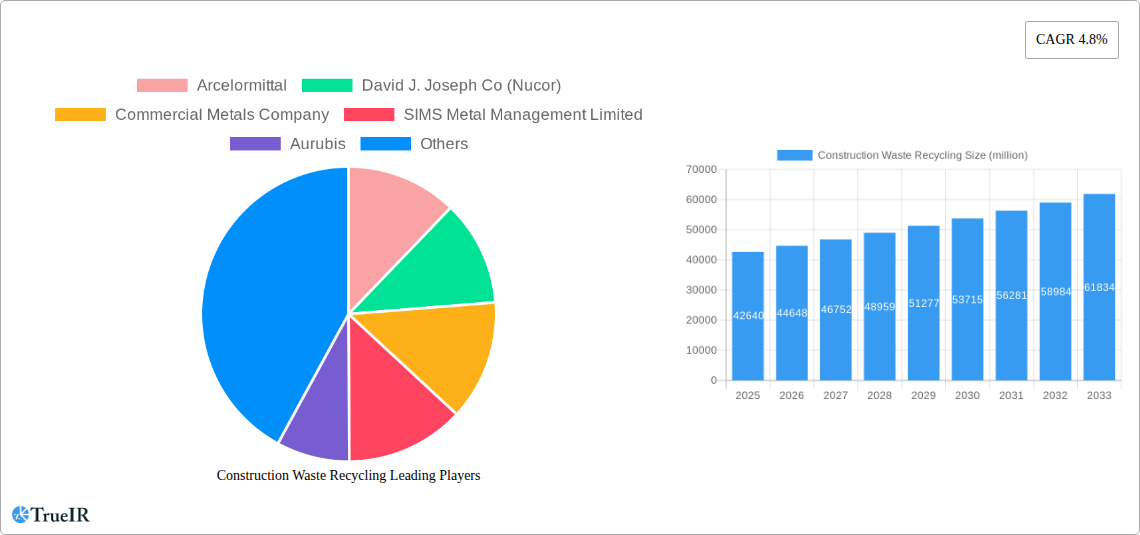
Construction Waste Recycling Company Market Share
Construction Waste Recycling Market: Strategic Insights and Future Outlook (2019-2033)
This comprehensive report delivers deep-dive analysis into the global Construction Waste Recycling market, a rapidly expanding sector driven by environmental regulations and the circular economy imperative. Leveraging extensive historical data from 2019-2024 and robust forecasting up to 2033, with a base and estimated year of 2025, this study provides critical insights for stakeholders aiming to navigate and capitalize on this dynamic industry. The report meticulously examines market structures, competitive landscapes, emerging trends, dominant segments, and future growth catalysts.
Construction Waste Recycling Market Structure & Competitive Landscape
The global construction waste recycling market exhibits a moderately concentrated structure, with key players like Arcelormittal, David J. Joseph Co (Nucor), Commercial Metals Company, SIMS Metal Management Limited, Aurubis, European Metal Recycling Limited, DOWA ECO-SYSTEM (Dowa Holdings), and Chiho Environmental Group holding significant market shares. Innovation drivers include the development of advanced sorting technologies and the creation of higher-value recycled materials. Regulatory impacts are substantial, with governments worldwide implementing stricter waste management policies and incentivizing recycling. Product substitutes, while present in some lower-value applications, are increasingly being displaced by the economic and environmental benefits of recycled materials. End-user segmentation reveals the Building & Construction sector as the dominant application, followed by Automotive and Equipment Manufacturing. Merger and acquisition (M&A) activity is a notable trend, with an estimated volume of over 500 million USD in the past five years, as larger entities seek to consolidate market presence and expand their service offerings. The market is characterized by a growing emphasis on specialized recycling techniques and the valorization of waste streams.
Construction Waste Recycling Market Trends & Opportunities
The construction waste recycling market is poised for substantial growth, projected to expand at a Compound Annual Growth Rate (CAGR) of approximately 7.5% from 2025 to 2033. This upward trajectory is fueled by a confluence of factors, including escalating global construction activity, a heightened awareness of environmental sustainability, and increasingly stringent governmental regulations mandating the diversion of construction and demolition waste from landfills. The market size is estimated to reach over 1.2 million million USD by 2033. Technological shifts are a significant trend, with advancements in automated sorting technologies, AI-powered material identification, and the development of novel processing techniques enabling the efficient recovery of a wider range of materials, including metals, concrete, plastics, and glass. Consumer preferences are also evolving, with a growing demand for sustainably sourced building materials and a willingness to invest in projects that minimize their environmental footprint. This has translated into increased adoption of recycled content in new construction projects. Competitive dynamics are intensifying, with both established players and new entrants vying for market share through strategic partnerships, technological innovation, and expanded service offerings. The circular economy model is gaining traction, encouraging businesses to view construction waste not as refuse but as a valuable resource, thereby creating new business models centered around material reuse and remanufacturing. The penetration rate of recycled materials in key applications is steadily increasing, driven by cost-effectiveness and performance parity with virgin materials. Opportunities abound for companies that can offer integrated waste management solutions, develop proprietary recycling technologies, and contribute to the development of green building standards. The growing emphasis on the valorization of waste streams, transforming them into higher-value products, presents a significant area for future market expansion and profitability.
Dominant Markets & Segments in Construction Waste Recycling
The Building & Construction application segment stands as the undisputed leader in the global construction waste recycling market, accounting for an estimated 60% of the total market value in 2025. This dominance is attributed to the sheer volume of waste generated by demolition and renovation projects, coupled with robust government initiatives promoting sustainable building practices. Infrastructure development, particularly in emerging economies, acts as a significant growth driver, necessitating the recycling of vast quantities of concrete, steel, and asphalt. Policies mandating landfill diversion and the use of recycled content in public works further bolster this segment.
Within the Types of recycled materials, Steel holds a substantial market share due to its high recyclability and widespread use in construction. The growing demand for recycled aluminum in lightweight construction and automotive applications is also noteworthy, positioning it as a key growth area. Glass recycling is gaining momentum, with advancements in processing enabling its use in various construction materials like aggregates and insulation. The "Others" category encompasses a diverse range of materials such as plastics, wood, and gypsum, with specialized recycling solutions emerging for each.
Regionally, Asia-Pacific is emerging as a dominant market, driven by rapid urbanization, significant infrastructure investments, and supportive government policies for waste management and recycling. North America and Europe remain mature markets with well-established recycling infrastructures and stringent environmental regulations, contributing to consistent demand.
Key growth drivers across these dominant segments include:
- Building & Construction:
- Increased global infrastructure spending.
- Government mandates for deconstruction and material reuse.
- Growth in green building certifications and sustainable construction practices.
- Urban regeneration projects and demolition of aging structures.
- Steel:
- High recyclability and energy savings compared to virgin steel production.
- Consistent demand from the construction and automotive sectors.
- Technological advancements in scrap processing and quality enhancement.
- Aluminum:
- Growing adoption in lightweight construction and prefabricated elements.
- Increasing demand from the automotive industry for fuel efficiency.
- Energy-intensive nature of primary aluminum production makes recycling highly attractive.
- Asia-Pacific:
- Rapid urbanization and extensive construction projects.
- Government initiatives promoting circular economy principles.
- Growing environmental awareness and stringent waste management regulations.
Construction Waste Recycling Product Analysis
Construction waste recycling products are characterized by their increasing quality and diverse applications. Innovations in sorting and processing technologies are enabling the transformation of traditional waste materials into high-value commodities. For instance, crushed concrete and asphalt are being effectively utilized as aggregates in new road construction and backfill, reducing the need for virgin quarried materials. Recycled steel and aluminum, processed to meet stringent industry standards, are directly reintegrated into new manufacturing processes, offering significant environmental and economic advantages. Furthermore, advancements in glass recycling are leading to its incorporation into insulation materials, decorative finishes, and even as a component in concrete mixtures. The competitive advantage for recycling companies lies in their ability to consistently produce materials that meet performance specifications, offer cost savings over virgin alternatives, and adhere to environmental certifications.
Key Drivers, Barriers & Challenges in Construction Waste Recycling
Key Drivers: The construction waste recycling market is propelled by a trifecta of powerful forces. Technological advancements in automated sorting, material identification, and processing technologies are making it more efficient and cost-effective to recover valuable materials. Economic incentives, including rising landfill costs and the increasing market demand for recycled materials, are creating a compelling business case for recycling. Policy and regulatory drivers, such as government mandates for waste diversion, landfill taxes, and the promotion of the circular economy, are creating a favorable operating environment and pushing industries towards sustainable practices. For example, the European Union's Circular Economy Action Plan provides a clear roadmap and encourages member states to implement robust recycling frameworks.
Barriers & Challenges: Despite the positive momentum, significant challenges impede broader market adoption. Supply chain complexities in collecting, transporting, and processing fragmented construction waste can lead to increased operational costs. Regulatory hurdles, including varying standards across different regions and the lack of a universal classification system for recycled materials, can create confusion and market fragmentation. Competitive pressures from established waste management companies and the perceived initial investment in recycling infrastructure can also act as restraints. For instance, the cost of establishing state-of-the-art recycling facilities can be substantial, requiring significant capital outlay.
Growth Drivers in the Construction Waste Recycling Market
The construction waste recycling market's growth is intrinsically linked to several key factors. Technological innovation is paramount, with advancements in AI-powered sorting, robotic processing, and enhanced material recovery techniques making it more feasible and profitable to recycle diverse waste streams. The economic imperative of the circular economy, driven by the increasing cost of virgin resources and the financial benefits of material reuse, is a significant catalyst. Furthermore, supportive government policies and regulations, such as extended producer responsibility schemes and mandates for recycled content in construction projects, are creating a stable and predictable market environment. For example, the increasing global adoption of green building standards incentivizes the use of recycled materials, thereby fostering market expansion.
Challenges Impacting Construction Waste Recycling Growth
Several factors present ongoing challenges to the seamless growth of the construction waste recycling market. Regulatory inconsistencies across jurisdictions can create operational complexities and hinder scalability. Supply chain inefficiencies, including the logistical challenges of collecting and transporting diverse construction waste streams, can drive up costs and reduce profitability. Perception and market acceptance of recycled materials, particularly regarding their quality and performance compared to virgin alternatives, can also act as a restraint, though this is rapidly diminishing. Intense competitive pressures from traditional waste disposal methods and the capital investment required for advanced recycling infrastructure can also impact the pace of growth. The estimated impact of these challenges on market penetration is a potential reduction of up to 15% in the projected growth rate if not effectively addressed.
Key Players Shaping the Construction Waste Recycling Market
- Arcelormittal
- David J. Joseph Co (Nucor)
- Commercial Metals Company
- SIMS Metal Management Limited
- Aurubis
- European Metal Recycling Limited
- DOWA ECO-SYSTEM (Dowa Holdings)
- Chiho Environmental Group
Significant Construction Waste Recycling Industry Milestones
- 2019: Increased adoption of advanced sorting technologies like AI and sensor-based sorting.
- 2020: Growth in demand for recycled aggregates due to infrastructure projects.
- 2021: Key companies began investing in advanced processing to produce higher-value recycled materials.
- 2022: European Union strengthened its Circular Economy Action Plan, encouraging member states to improve construction waste management.
- 2023: Development of new applications for recycled plastics from construction waste.
- 2024: Enhanced focus on the digitalization of waste tracking and management systems.
Future Outlook for Construction Waste Recycling Market
The future outlook for the construction waste recycling market is exceptionally promising, driven by the global imperative for sustainability and the economic advantages of a circular economy. Strategic opportunities lie in the continued development and deployment of cutting-edge recycling technologies, enabling the recovery of a wider array of materials with higher purity. The increasing adoption of recycled content in new construction, spurred by regulatory mandates and corporate sustainability goals, will further fuel demand. The market potential is significant, with an estimated market size reaching over 1.2 million million USD by 2033, offering substantial growth prospects for innovative and agile players in this essential industry.
Construction Waste Recycling Segmentation
-
1. Application
- 1.1. Building & Construction
- 1.2. Automotive
- 1.3. Equipment Manufacturing
- 1.4. Shipbuilding
- 1.5. Consumer Appliances
- 1.6. Battery
- 1.7. Packaging
- 1.8. Others
-
2. Types
- 2.1. Steel
- 2.2. Aluminum
- 2.3. Glass
- 2.4. Others
Construction Waste Recycling Segmentation By Geography
-
1. North America
- 1.1. United States
- 1.2. Canada
- 1.3. Mexico
-
2. South America
- 2.1. Brazil
- 2.2. Argentina
- 2.3. Rest of South America
-
3. Europe
- 3.1. United Kingdom
- 3.2. Germany
- 3.3. France
- 3.4. Italy
- 3.5. Spain
- 3.6. Russia
- 3.7. Benelux
- 3.8. Nordics
- 3.9. Rest of Europe
-
4. Middle East & Africa
- 4.1. Turkey
- 4.2. Israel
- 4.3. GCC
- 4.4. North Africa
- 4.5. South Africa
- 4.6. Rest of Middle East & Africa
-
5. Asia Pacific
- 5.1. China
- 5.2. India
- 5.3. Japan
- 5.4. South Korea
- 5.5. ASEAN
- 5.6. Oceania
- 5.7. Rest of Asia Pacific
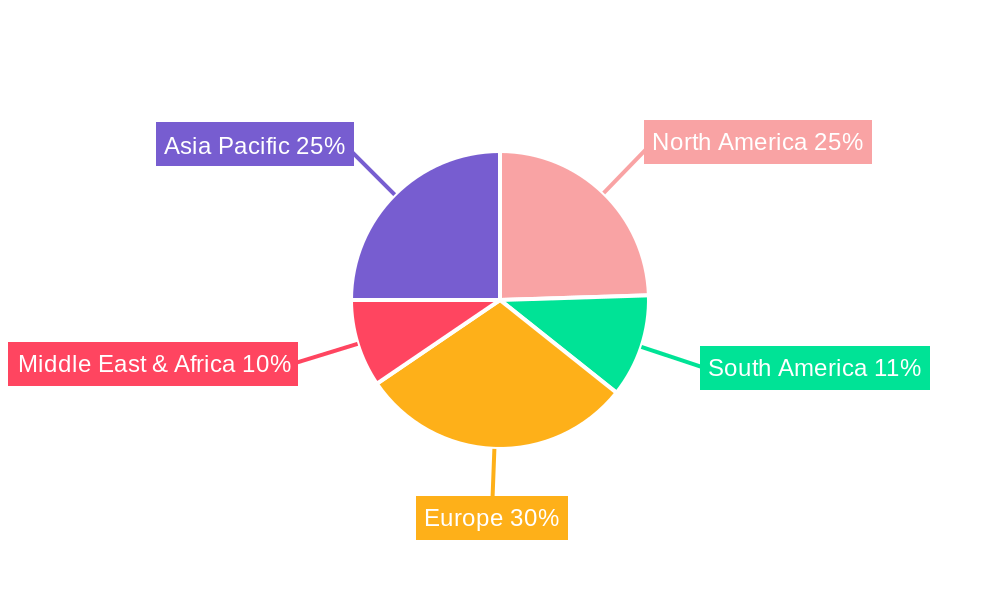
Construction Waste Recycling Regional Market Share
Geographic Coverage of Construction Waste Recycling
Construction Waste Recycling REPORT HIGHLIGHTS
| Aspects | Details |
|---|---|
| Study Period | 2020-2034 |
| Base Year | 2025 |
| Estimated Year | 2026 |
| Forecast Period | 2026-2034 |
| Historical Period | 2020-2025 |
| Growth Rate | CAGR of 4.8% from 2020-2034 |
| Segmentation |
|
Table of Contents
- 1. Introduction
- 1.1. Research Scope
- 1.2. Market Segmentation
- 1.3. Research Methodology
- 1.4. Definitions and Assumptions
- 2. Executive Summary
- 2.1. Introduction
- 3. Market Dynamics
- 3.1. Introduction
- 3.2. Market Drivers
- 3.3. Market Restrains
- 3.4. Market Trends
- 4. Market Factor Analysis
- 4.1. Porters Five Forces
- 4.2. Supply/Value Chain
- 4.3. PESTEL analysis
- 4.4. Market Entropy
- 4.5. Patent/Trademark Analysis
- 5. Global Construction Waste Recycling Analysis, Insights and Forecast, 2020-2032
- 5.1. Market Analysis, Insights and Forecast - by Application
- 5.1.1. Building & Construction
- 5.1.2. Automotive
- 5.1.3. Equipment Manufacturing
- 5.1.4. Shipbuilding
- 5.1.5. Consumer Appliances
- 5.1.6. Battery
- 5.1.7. Packaging
- 5.1.8. Others
- 5.2. Market Analysis, Insights and Forecast - by Types
- 5.2.1. Steel
- 5.2.2. Aluminum
- 5.2.3. Glass
- 5.2.4. Others
- 5.3. Market Analysis, Insights and Forecast - by Region
- 5.3.1. North America
- 5.3.2. South America
- 5.3.3. Europe
- 5.3.4. Middle East & Africa
- 5.3.5. Asia Pacific
- 5.1. Market Analysis, Insights and Forecast - by Application
- 6. North America Construction Waste Recycling Analysis, Insights and Forecast, 2020-2032
- 6.1. Market Analysis, Insights and Forecast - by Application
- 6.1.1. Building & Construction
- 6.1.2. Automotive
- 6.1.3. Equipment Manufacturing
- 6.1.4. Shipbuilding
- 6.1.5. Consumer Appliances
- 6.1.6. Battery
- 6.1.7. Packaging
- 6.1.8. Others
- 6.2. Market Analysis, Insights and Forecast - by Types
- 6.2.1. Steel
- 6.2.2. Aluminum
- 6.2.3. Glass
- 6.2.4. Others
- 6.1. Market Analysis, Insights and Forecast - by Application
- 7. South America Construction Waste Recycling Analysis, Insights and Forecast, 2020-2032
- 7.1. Market Analysis, Insights and Forecast - by Application
- 7.1.1. Building & Construction
- 7.1.2. Automotive
- 7.1.3. Equipment Manufacturing
- 7.1.4. Shipbuilding
- 7.1.5. Consumer Appliances
- 7.1.6. Battery
- 7.1.7. Packaging
- 7.1.8. Others
- 7.2. Market Analysis, Insights and Forecast - by Types
- 7.2.1. Steel
- 7.2.2. Aluminum
- 7.2.3. Glass
- 7.2.4. Others
- 7.1. Market Analysis, Insights and Forecast - by Application
- 8. Europe Construction Waste Recycling Analysis, Insights and Forecast, 2020-2032
- 8.1. Market Analysis, Insights and Forecast - by Application
- 8.1.1. Building & Construction
- 8.1.2. Automotive
- 8.1.3. Equipment Manufacturing
- 8.1.4. Shipbuilding
- 8.1.5. Consumer Appliances
- 8.1.6. Battery
- 8.1.7. Packaging
- 8.1.8. Others
- 8.2. Market Analysis, Insights and Forecast - by Types
- 8.2.1. Steel
- 8.2.2. Aluminum
- 8.2.3. Glass
- 8.2.4. Others
- 8.1. Market Analysis, Insights and Forecast - by Application
- 9. Middle East & Africa Construction Waste Recycling Analysis, Insights and Forecast, 2020-2032
- 9.1. Market Analysis, Insights and Forecast - by Application
- 9.1.1. Building & Construction
- 9.1.2. Automotive
- 9.1.3. Equipment Manufacturing
- 9.1.4. Shipbuilding
- 9.1.5. Consumer Appliances
- 9.1.6. Battery
- 9.1.7. Packaging
- 9.1.8. Others
- 9.2. Market Analysis, Insights and Forecast - by Types
- 9.2.1. Steel
- 9.2.2. Aluminum
- 9.2.3. Glass
- 9.2.4. Others
- 9.1. Market Analysis, Insights and Forecast - by Application
- 10. Asia Pacific Construction Waste Recycling Analysis, Insights and Forecast, 2020-2032
- 10.1. Market Analysis, Insights and Forecast - by Application
- 10.1.1. Building & Construction
- 10.1.2. Automotive
- 10.1.3. Equipment Manufacturing
- 10.1.4. Shipbuilding
- 10.1.5. Consumer Appliances
- 10.1.6. Battery
- 10.1.7. Packaging
- 10.1.8. Others
- 10.2. Market Analysis, Insights and Forecast - by Types
- 10.2.1. Steel
- 10.2.2. Aluminum
- 10.2.3. Glass
- 10.2.4. Others
- 10.1. Market Analysis, Insights and Forecast - by Application
- 11. Competitive Analysis
- 11.1. Global Market Share Analysis 2025
- 11.2. Company Profiles
- 11.2.1 Arcelormittal
- 11.2.1.1. Overview
- 11.2.1.2. Products
- 11.2.1.3. SWOT Analysis
- 11.2.1.4. Recent Developments
- 11.2.1.5. Financials (Based on Availability)
- 11.2.2 David J. Joseph Co (Nucor)
- 11.2.2.1. Overview
- 11.2.2.2. Products
- 11.2.2.3. SWOT Analysis
- 11.2.2.4. Recent Developments
- 11.2.2.5. Financials (Based on Availability)
- 11.2.3 Commercial Metals Company
- 11.2.3.1. Overview
- 11.2.3.2. Products
- 11.2.3.3. SWOT Analysis
- 11.2.3.4. Recent Developments
- 11.2.3.5. Financials (Based on Availability)
- 11.2.4 SIMS Metal Management Limited
- 11.2.4.1. Overview
- 11.2.4.2. Products
- 11.2.4.3. SWOT Analysis
- 11.2.4.4. Recent Developments
- 11.2.4.5. Financials (Based on Availability)
- 11.2.5 Aurubis
- 11.2.5.1. Overview
- 11.2.5.2. Products
- 11.2.5.3. SWOT Analysis
- 11.2.5.4. Recent Developments
- 11.2.5.5. Financials (Based on Availability)
- 11.2.6 European Metal Recycling Limited
- 11.2.6.1. Overview
- 11.2.6.2. Products
- 11.2.6.3. SWOT Analysis
- 11.2.6.4. Recent Developments
- 11.2.6.5. Financials (Based on Availability)
- 11.2.7 DOWA ECO-SYSTEM (Dowa Holdings)
- 11.2.7.1. Overview
- 11.2.7.2. Products
- 11.2.7.3. SWOT Analysis
- 11.2.7.4. Recent Developments
- 11.2.7.5. Financials (Based on Availability)
- 11.2.8 Chiho Environmental Group
- 11.2.8.1. Overview
- 11.2.8.2. Products
- 11.2.8.3. SWOT Analysis
- 11.2.8.4. Recent Developments
- 11.2.8.5. Financials (Based on Availability)
- 11.2.1 Arcelormittal
List of Figures
- Figure 1: Global Construction Waste Recycling Revenue Breakdown (million, %) by Region 2025 & 2033
- Figure 2: North America Construction Waste Recycling Revenue (million), by Application 2025 & 2033
- Figure 3: North America Construction Waste Recycling Revenue Share (%), by Application 2025 & 2033
- Figure 4: North America Construction Waste Recycling Revenue (million), by Types 2025 & 2033
- Figure 5: North America Construction Waste Recycling Revenue Share (%), by Types 2025 & 2033
- Figure 6: North America Construction Waste Recycling Revenue (million), by Country 2025 & 2033
- Figure 7: North America Construction Waste Recycling Revenue Share (%), by Country 2025 & 2033
- Figure 8: South America Construction Waste Recycling Revenue (million), by Application 2025 & 2033
- Figure 9: South America Construction Waste Recycling Revenue Share (%), by Application 2025 & 2033
- Figure 10: South America Construction Waste Recycling Revenue (million), by Types 2025 & 2033
- Figure 11: South America Construction Waste Recycling Revenue Share (%), by Types 2025 & 2033
- Figure 12: South America Construction Waste Recycling Revenue (million), by Country 2025 & 2033
- Figure 13: South America Construction Waste Recycling Revenue Share (%), by Country 2025 & 2033
- Figure 14: Europe Construction Waste Recycling Revenue (million), by Application 2025 & 2033
- Figure 15: Europe Construction Waste Recycling Revenue Share (%), by Application 2025 & 2033
- Figure 16: Europe Construction Waste Recycling Revenue (million), by Types 2025 & 2033
- Figure 17: Europe Construction Waste Recycling Revenue Share (%), by Types 2025 & 2033
- Figure 18: Europe Construction Waste Recycling Revenue (million), by Country 2025 & 2033
- Figure 19: Europe Construction Waste Recycling Revenue Share (%), by Country 2025 & 2033
- Figure 20: Middle East & Africa Construction Waste Recycling Revenue (million), by Application 2025 & 2033
- Figure 21: Middle East & Africa Construction Waste Recycling Revenue Share (%), by Application 2025 & 2033
- Figure 22: Middle East & Africa Construction Waste Recycling Revenue (million), by Types 2025 & 2033
- Figure 23: Middle East & Africa Construction Waste Recycling Revenue Share (%), by Types 2025 & 2033
- Figure 24: Middle East & Africa Construction Waste Recycling Revenue (million), by Country 2025 & 2033
- Figure 25: Middle East & Africa Construction Waste Recycling Revenue Share (%), by Country 2025 & 2033
- Figure 26: Asia Pacific Construction Waste Recycling Revenue (million), by Application 2025 & 2033
- Figure 27: Asia Pacific Construction Waste Recycling Revenue Share (%), by Application 2025 & 2033
- Figure 28: Asia Pacific Construction Waste Recycling Revenue (million), by Types 2025 & 2033
- Figure 29: Asia Pacific Construction Waste Recycling Revenue Share (%), by Types 2025 & 2033
- Figure 30: Asia Pacific Construction Waste Recycling Revenue (million), by Country 2025 & 2033
- Figure 31: Asia Pacific Construction Waste Recycling Revenue Share (%), by Country 2025 & 2033
List of Tables
- Table 1: Global Construction Waste Recycling Revenue million Forecast, by Application 2020 & 2033
- Table 2: Global Construction Waste Recycling Revenue million Forecast, by Types 2020 & 2033
- Table 3: Global Construction Waste Recycling Revenue million Forecast, by Region 2020 & 2033
- Table 4: Global Construction Waste Recycling Revenue million Forecast, by Application 2020 & 2033
- Table 5: Global Construction Waste Recycling Revenue million Forecast, by Types 2020 & 2033
- Table 6: Global Construction Waste Recycling Revenue million Forecast, by Country 2020 & 2033
- Table 7: United States Construction Waste Recycling Revenue (million) Forecast, by Application 2020 & 2033
- Table 8: Canada Construction Waste Recycling Revenue (million) Forecast, by Application 2020 & 2033
- Table 9: Mexico Construction Waste Recycling Revenue (million) Forecast, by Application 2020 & 2033
- Table 10: Global Construction Waste Recycling Revenue million Forecast, by Application 2020 & 2033
- Table 11: Global Construction Waste Recycling Revenue million Forecast, by Types 2020 & 2033
- Table 12: Global Construction Waste Recycling Revenue million Forecast, by Country 2020 & 2033
- Table 13: Brazil Construction Waste Recycling Revenue (million) Forecast, by Application 2020 & 2033
- Table 14: Argentina Construction Waste Recycling Revenue (million) Forecast, by Application 2020 & 2033
- Table 15: Rest of South America Construction Waste Recycling Revenue (million) Forecast, by Application 2020 & 2033
- Table 16: Global Construction Waste Recycling Revenue million Forecast, by Application 2020 & 2033
- Table 17: Global Construction Waste Recycling Revenue million Forecast, by Types 2020 & 2033
- Table 18: Global Construction Waste Recycling Revenue million Forecast, by Country 2020 & 2033
- Table 19: United Kingdom Construction Waste Recycling Revenue (million) Forecast, by Application 2020 & 2033
- Table 20: Germany Construction Waste Recycling Revenue (million) Forecast, by Application 2020 & 2033
- Table 21: France Construction Waste Recycling Revenue (million) Forecast, by Application 2020 & 2033
- Table 22: Italy Construction Waste Recycling Revenue (million) Forecast, by Application 2020 & 2033
- Table 23: Spain Construction Waste Recycling Revenue (million) Forecast, by Application 2020 & 2033
- Table 24: Russia Construction Waste Recycling Revenue (million) Forecast, by Application 2020 & 2033
- Table 25: Benelux Construction Waste Recycling Revenue (million) Forecast, by Application 2020 & 2033
- Table 26: Nordics Construction Waste Recycling Revenue (million) Forecast, by Application 2020 & 2033
- Table 27: Rest of Europe Construction Waste Recycling Revenue (million) Forecast, by Application 2020 & 2033
- Table 28: Global Construction Waste Recycling Revenue million Forecast, by Application 2020 & 2033
- Table 29: Global Construction Waste Recycling Revenue million Forecast, by Types 2020 & 2033
- Table 30: Global Construction Waste Recycling Revenue million Forecast, by Country 2020 & 2033
- Table 31: Turkey Construction Waste Recycling Revenue (million) Forecast, by Application 2020 & 2033
- Table 32: Israel Construction Waste Recycling Revenue (million) Forecast, by Application 2020 & 2033
- Table 33: GCC Construction Waste Recycling Revenue (million) Forecast, by Application 2020 & 2033
- Table 34: North Africa Construction Waste Recycling Revenue (million) Forecast, by Application 2020 & 2033
- Table 35: South Africa Construction Waste Recycling Revenue (million) Forecast, by Application 2020 & 2033
- Table 36: Rest of Middle East & Africa Construction Waste Recycling Revenue (million) Forecast, by Application 2020 & 2033
- Table 37: Global Construction Waste Recycling Revenue million Forecast, by Application 2020 & 2033
- Table 38: Global Construction Waste Recycling Revenue million Forecast, by Types 2020 & 2033
- Table 39: Global Construction Waste Recycling Revenue million Forecast, by Country 2020 & 2033
- Table 40: China Construction Waste Recycling Revenue (million) Forecast, by Application 2020 & 2033
- Table 41: India Construction Waste Recycling Revenue (million) Forecast, by Application 2020 & 2033
- Table 42: Japan Construction Waste Recycling Revenue (million) Forecast, by Application 2020 & 2033
- Table 43: South Korea Construction Waste Recycling Revenue (million) Forecast, by Application 2020 & 2033
- Table 44: ASEAN Construction Waste Recycling Revenue (million) Forecast, by Application 2020 & 2033
- Table 45: Oceania Construction Waste Recycling Revenue (million) Forecast, by Application 2020 & 2033
- Table 46: Rest of Asia Pacific Construction Waste Recycling Revenue (million) Forecast, by Application 2020 & 2033
Frequently Asked Questions
1. What is the projected Compound Annual Growth Rate (CAGR) of the Construction Waste Recycling?
The projected CAGR is approximately 4.8%.
2. Which companies are prominent players in the Construction Waste Recycling?
Key companies in the market include Arcelormittal, David J. Joseph Co (Nucor), Commercial Metals Company, SIMS Metal Management Limited, Aurubis, European Metal Recycling Limited, DOWA ECO-SYSTEM (Dowa Holdings), Chiho Environmental Group.
3. What are the main segments of the Construction Waste Recycling?
The market segments include Application, Types.
4. Can you provide details about the market size?
The market size is estimated to be USD 42640 million as of 2022.
5. What are some drivers contributing to market growth?
N/A
6. What are the notable trends driving market growth?
N/A
7. Are there any restraints impacting market growth?
N/A
8. Can you provide examples of recent developments in the market?
N/A
9. What pricing options are available for accessing the report?
Pricing options include single-user, multi-user, and enterprise licenses priced at USD 2900.00, USD 4350.00, and USD 5800.00 respectively.
10. Is the market size provided in terms of value or volume?
The market size is provided in terms of value, measured in million.
11. Are there any specific market keywords associated with the report?
Yes, the market keyword associated with the report is "Construction Waste Recycling," which aids in identifying and referencing the specific market segment covered.
12. How do I determine which pricing option suits my needs best?
The pricing options vary based on user requirements and access needs. Individual users may opt for single-user licenses, while businesses requiring broader access may choose multi-user or enterprise licenses for cost-effective access to the report.
13. Are there any additional resources or data provided in the Construction Waste Recycling report?
While the report offers comprehensive insights, it's advisable to review the specific contents or supplementary materials provided to ascertain if additional resources or data are available.
14. How can I stay updated on further developments or reports in the Construction Waste Recycling?
To stay informed about further developments, trends, and reports in the Construction Waste Recycling, consider subscribing to industry newsletters, following relevant companies and organizations, or regularly checking reputable industry news sources and publications.
Methodology
Step 1 - Identification of Relevant Samples Size from Population Database


Step 2 - Approaches for Defining Global Market Size (Value, Volume* & Price*)

Note*: In applicable scenarios
Step 3 - Data Sources
Primary Research
- Web Analytics
- Survey Reports
- Research Institute
- Latest Research Reports
- Opinion Leaders
Secondary Research
- Annual Reports
- White Paper
- Latest Press Release
- Industry Association
- Paid Database
- Investor Presentations

Step 4 - Data Triangulation
Involves using different sources of information in order to increase the validity of a study
These sources are likely to be stakeholders in a program - participants, other researchers, program staff, other community members, and so on.
Then we put all data in single framework & apply various statistical tools to find out the dynamic on the market.
During the analysis stage, feedback from the stakeholder groups would be compared to determine areas of agreement as well as areas of divergence