

Key Insights
The electric bus battery pack market is experiencing robust growth, driven by increasing environmental concerns, stringent emission regulations globally, and government incentives promoting electric vehicle adoption. The market's Compound Annual Growth Rate (CAGR) of 24.50% from 2019 to 2024 indicates significant expansion, projected to continue throughout the forecast period (2025-2033). Several factors contribute to this growth. The technological advancements in battery chemistry, particularly the development of higher energy density and longer-lasting Lithium Iron Phosphate (LFP) and Nickel Manganese Cobalt (NMC) batteries, are lowering costs and improving performance. Furthermore, the expanding charging infrastructure and increasing range of electric buses are boosting consumer confidence and market demand. Segmentation analysis reveals that high-capacity battery packs (above 80 kWh) are witnessing rapid growth, aligned with the increasing demand for longer operational ranges in electric buses. The cylindrical and prismatic battery form factors dominate the market due to their suitability for various bus designs and energy requirements. Major players like CATL, BYD, LG Energy Solution, and Samsung SDI are investing heavily in R&D and manufacturing capacity to meet the escalating demand. However, challenges remain, including the high initial cost of electric bus battery packs and the need for robust battery management systems to ensure safety and longevity. Nevertheless, the long-term outlook for the market remains extremely positive, with continued growth projected well into the future.
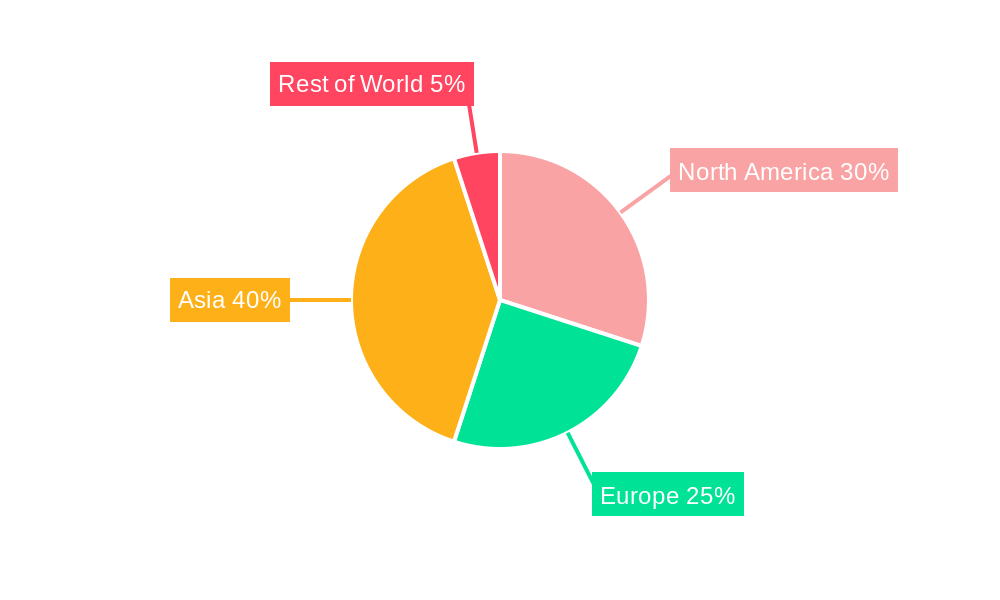
The diverse segments within the electric bus battery pack market offer both opportunities and challenges. The choice of battery chemistry (LFP, NCA, NMC) significantly impacts cost, performance, and lifecycle. Similarly, the battery form factor (cylindrical, pouch, prismatic) influences design flexibility and integration within the bus. Regional variations in market penetration are also expected, with developed nations in North America and Europe leading the adoption initially, followed by rapid growth in developing economies in Asia and other regions as infrastructure and affordability improve. The competition amongst major players is intense, driving innovation and cost reductions. Focusing on sustainable sourcing of raw materials, improving battery recycling infrastructure, and addressing the concerns regarding battery safety will be crucial for long-term market sustainability.
Electric Bus Battery Pack Market: A Comprehensive Market Report (2019-2033)
This comprehensive report provides an in-depth analysis of the Electric Bus Battery Pack market, offering valuable insights for stakeholders across the value chain. Covering the period from 2019 to 2033, with a focus on 2025 as the base and estimated year, this report meticulously examines market dynamics, competitive landscapes, and future growth prospects. The market is segmented by battery form (Cylindrical, Pouch, Prismatic), method (Laser, Wire), component (Anode, Cathode, Electrolyte, Separator), material type (Cobalt, Lithium, Manganese, Natural Graphite, Nickel, Other Materials), propulsion type (BEV, PHEV), battery chemistry (LFP, NCA, NCM, NMC, Others), and capacity (Less than 15 kWh, 15 kWh to 40 kWh, 40 kWh to 80 kWh, Above 80 kWh). Key players like CATL, BYD, Samsung SDI, and LG Energy Solution are analyzed for their market share and strategic initiatives. The report projects a robust CAGR of xx% during the forecast period (2025-2033), driven by factors such as increasing adoption of electric buses and supportive government policies.
Electric Bus Battery Pack Market Structure & Competitive Landscape
The electric bus battery pack market exhibits a moderately concentrated structure, with a few dominant players holding significant market share. The Herfindahl-Hirschman Index (HHI) is estimated at xx, indicating a moderately concentrated market. This concentration is primarily influenced by the high capital expenditure required for battery production, leading to barriers for new entrants. However, the market also displays high innovation, with continuous advancements in battery chemistry, cell design, and thermal management systems driving product differentiation. Stringent environmental regulations aimed at reducing carbon emissions are acting as a significant driver, pushing the adoption of electric buses and, consequently, the demand for high-performance battery packs. Product substitution is limited due to the specialized nature of the product, although competition is intense amongst established players.
The market shows a notable trend of mergers and acquisitions (M&A), as larger companies consolidate their positions and expand their production capacity. The total M&A volume in the past five years is estimated at xx Million USD. End-user segmentation is primarily driven by public transportation authorities and private bus operators, with urban areas exhibiting higher adoption rates.
- High Capital Expenditure: Creates significant barriers to entry.
- Technological Innovation: Continuous improvement in battery technology and performance.
- Stringent Environmental Regulations: Drive demand for electric buses globally.
- M&A Activity: Consolidation within the market.
- End-User Segmentation: Focus on public and private transportation sectors.
Electric Bus Battery Pack Market Market Trends & Opportunities
The global electric bus battery pack market is experiencing significant growth, driven by a confluence of factors. The market size is estimated to reach xx Million USD in 2025, and it is projected to expand at a Compound Annual Growth Rate (CAGR) of xx% from 2025 to 2033, reaching xx Million USD by 2033. This growth is fueled by the rising adoption of electric vehicles globally, particularly in the public transportation sector. Governments worldwide are increasingly implementing policies to promote the use of electric buses, including subsidies, tax incentives, and stricter emission regulations. These policies are instrumental in reducing the total cost of ownership for electric buses, making them a more attractive alternative to diesel-powered vehicles. Technological advancements, such as improvements in battery energy density, lifespan, and charging infrastructure, are also crucial factors driving market expansion.
Consumer preference is shifting towards environmentally friendly transportation solutions, further accelerating the demand for electric buses. The market penetration rate of electric buses is expected to increase from xx% in 2025 to xx% by 2033. Competitive dynamics are characterized by intense competition among established battery manufacturers and a surge of new entrants aiming to capitalize on the market's rapid growth.
Dominant Markets & Segments in Electric Bus Battery Pack Market
The Asia-Pacific region currently dominates the electric bus battery pack market, driven by significant government support for electric mobility and a large-scale deployment of electric bus fleets in countries like China. Within this region, China holds the largest market share, fueled by massive investments in electric vehicle infrastructure and favorable government policies.
Key Growth Drivers:
- Government Support: Subsidies, tax incentives, and emission regulations promoting electric bus adoption.
- Rapid Urbanization: Increased demand for efficient public transportation systems in densely populated areas.
- Improved Battery Technology: Enhanced energy density, lifespan, and charging capabilities.
- Expanding Charging Infrastructure: Facilitating widespread adoption of electric buses.
Dominant Segments:
- Battery Form: Prismatic battery packs currently hold the largest market share due to their high energy density and suitability for large-scale applications.
- Battery Chemistry: LFP (Lithium Iron Phosphate) chemistry is currently dominant due to its cost-effectiveness and safety features. However, NMC (Nickel Manganese Cobalt) chemistry is gaining traction due to its higher energy density.
- Capacity: The 40 kWh to 80 kWh capacity segment holds a significant market share due to its suitability for a variety of electric bus models and operational needs.
The European and North American markets are also showing substantial growth, albeit at a slower pace compared to Asia-Pacific. These regions are witnessing increased adoption of electric buses in major cities and urban centers.
Electric Bus Battery Pack Market Product Analysis
The electric bus battery pack market is characterized by continuous product innovation, focused on enhancing energy density, cycle life, safety, and cost-effectiveness. Recent advancements include the use of advanced battery chemistries like NMC and solid-state batteries, improving energy storage capacity and reducing charging times. These innovations are tailored to the specific requirements of electric buses, emphasizing factors such as weight reduction, thermal management, and durability under various operating conditions. The competitive advantage lies in offering high-performance battery packs with superior safety features, longer lifespans, and competitive pricing.
Key Drivers, Barriers & Challenges in Electric Bus Battery Pack Market
Key Drivers:
The electric bus battery pack market is driven by several factors, including the increasing demand for sustainable transportation solutions, stringent emission regulations, and substantial government investments in public transportation infrastructure. The continuous improvement in battery technology, leading to higher energy density and longer lifespans, is further accelerating market growth. Moreover, decreasing battery costs are making electric buses a more financially viable option for public transport operators.
Challenges:
Despite significant growth, the market faces several challenges. Supply chain disruptions can lead to production delays and increased costs, particularly concerning raw materials like lithium and cobalt. Furthermore, the high upfront cost of electric buses remains a barrier to adoption for some operators. Safety concerns regarding battery fires and the environmental impact of battery disposal are also critical challenges that need careful consideration. The xx% increase in raw material prices in the past year has further exacerbated the cost issue.
Growth Drivers in the Electric Bus Battery Pack Market Market
The growth of the Electric Bus Battery Pack market is propelled by the rising adoption of electric buses in public transportation systems worldwide. Stricter emission regulations, coupled with government incentives such as subsidies and tax breaks for electric bus operators, are key catalysts. Technological advancements leading to improved battery performance, reduced costs, and enhanced safety features also contribute significantly. The development of better charging infrastructure is making electric bus operations more practical and convenient.
Challenges Impacting Electric Bus Battery Pack Market Growth
Several challenges hinder the growth of the Electric Bus Battery Pack market. The high initial investment cost of electric buses is a considerable barrier for many transportation authorities with limited budgets. The availability and cost of raw materials used in battery production are also significant concerns, alongside potential supply chain disruptions. Furthermore, safety concerns related to battery fires and the environmental impact of battery disposal require further research and effective mitigation strategies.
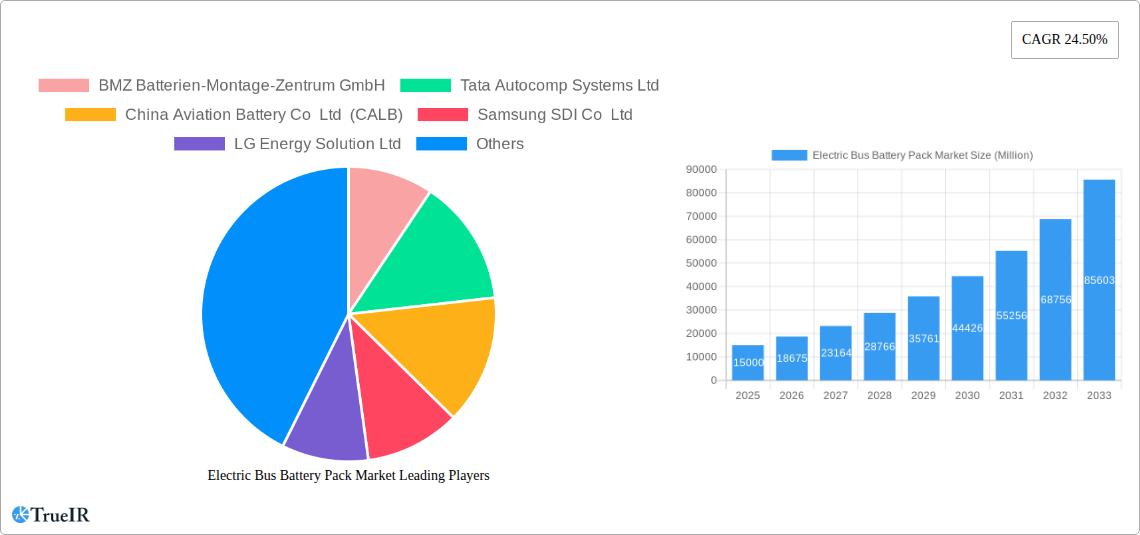
Key Players Shaping the Electric Bus Battery Pack Market Market
- BMZ Batterien-Montage-Zentrum GmbH
- Tata Autocomp Systems Ltd
- China Aviation Battery Co Ltd (CALB)
- Samsung SDI Co Ltd
- LG Energy Solution Ltd
- Guoxuan High-tech Co Ltd
- Farasis Energy (Ganzhou) Co Ltd
- Gotion High-Tech Co Ltd
- TOSHIBA Corp
- Contemporary Amperex Technology Co Ltd (CATL)
- NFI Group Inc
- Leclanché SA
- BYD Company Ltd
- Sunwoda Electric Vehicle Battery Co Ltd (Sunwoda)
- Proterra Operating Company Inc
- Panasonic Holdings Corporation
Significant Electric Bus Battery Pack Market Industry Milestones
- November 2022: Samsung SDI partnered with Sungkyunkwan University to develop battery technology expertise.
- January 2023: Samsung SDI reported record profits in 2022, driven by strong electric vehicle battery demand.
- February 2023: Samsung SDI expanded its Hungary plant to meet growing demand for mid-to-large size batteries.
Future Outlook for Electric Bus Battery Pack Market Market
The future of the electric bus battery pack market appears promising, driven by continuous technological advancements, supportive government policies, and increasing environmental awareness. Strategic partnerships and collaborations between battery manufacturers, bus manufacturers, and charging infrastructure providers will play a pivotal role in accelerating market growth. The development of more sustainable battery technologies and recycling programs will further enhance the market's long-term prospects. The market is poised for significant expansion, offering substantial opportunities for players willing to adapt and innovate.
Electric Bus Battery Pack Market Segmentation
-
1. Propulsion Type
- 1.1. BEV
- 1.2. PHEV
-
2. Battery Chemistry
- 2.1. LFP
- 2.2. NCA
- 2.3. NCM
- 2.4. NMC
- 2.5. Others
-
3. Capacity
- 3.1. 15 kWh to 40 kWh
- 3.2. 40 kWh to 80 kWh
- 3.3. Above 80 kWh
- 3.4. Less than 15 kWh
-
4. Battery Form
- 4.1. Cylindrical
- 4.2. Pouch
- 4.3. Prismatic
-
5. Method
- 5.1. Laser
- 5.2. Wire
-
6. Component
- 6.1. Anode
- 6.2. Cathode
- 6.3. Electrolyte
- 6.4. Separator
-
7. Material Type
- 7.1. Cobalt
- 7.2. Lithium
- 7.3. Manganese
- 7.4. Natural Graphite
- 7.5. Nickel
- 7.6. Other Materials
Electric Bus Battery Pack Market Segmentation By Geography
-
1. North America
- 1.1. United States
- 1.2. Canada
- 1.3. Mexico
-
2. South America
- 2.1. Brazil
- 2.2. Argentina
- 2.3. Rest of South America
-
3. Europe
- 3.1. United Kingdom
- 3.2. Germany
- 3.3. France
- 3.4. Italy
- 3.5. Spain
- 3.6. Russia
- 3.7. Benelux
- 3.8. Nordics
- 3.9. Rest of Europe
-
4. Middle East & Africa
- 4.1. Turkey
- 4.2. Israel
- 4.3. GCC
- 4.4. North Africa
- 4.5. South Africa
- 4.6. Rest of Middle East & Africa
-
5. Asia Pacific
- 5.1. China
- 5.2. India
- 5.3. Japan
- 5.4. South Korea
- 5.5. ASEAN
- 5.6. Oceania
- 5.7. Rest of Asia Pacific
Electric Bus Battery Pack Market REPORT HIGHLIGHTS
| Aspects | Details |
|---|---|
| Study Period | 2019-2033 |
| Base Year | 2024 |
| Estimated Year | 2025 |
| Forecast Period | 2025-2033 |
| Historical Period | 2019-2024 |
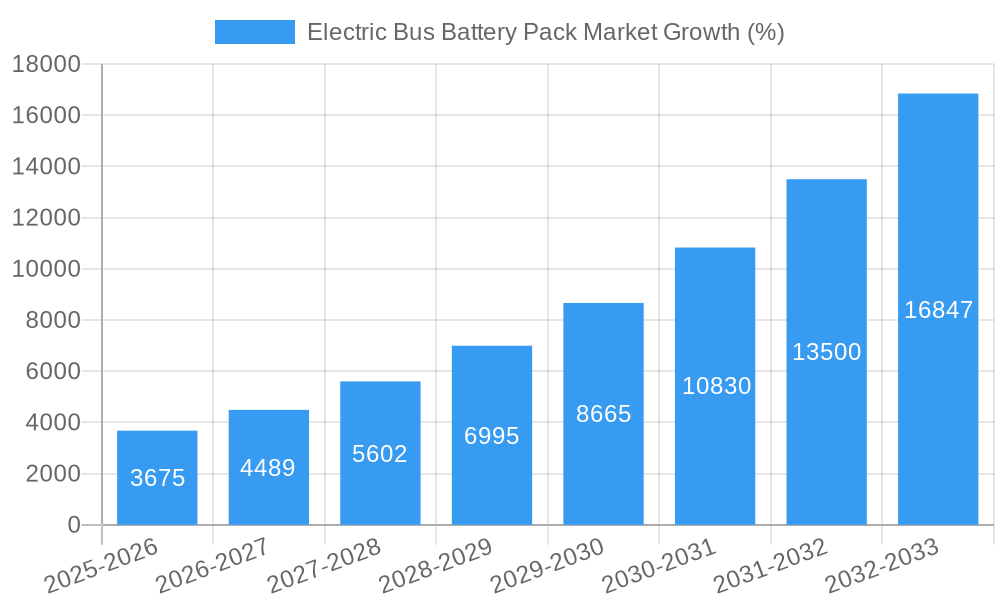
| Growth Rate | CAGR of 24.50% from 2019-2033 |
| Segmentation |
|
Table of Contents
- 1. Introduction
- 1.1. Research Scope
- 1.2. Market Segmentation
- 1.3. Research Methodology
- 1.4. Definitions and Assumptions
- 2. Executive Summary
- 2.1. Introduction
- 3. Market Dynamics
- 3.1. Introduction
- 3.2. Market Drivers
- 3.2.1. Exponential Increase in Automotive Sector
- 3.3. Market Restrains
- 3.3.1. Digitization of R&D Operations in Automotive Sector
- 3.4. Market Trends
- 3.4.1. OTHER KEY INDUSTRY TRENDS COVERED IN THE REPORT
- 4. Market Factor Analysis
- 4.1. Porters Five Forces
- 4.2. Supply/Value Chain
- 4.3. PESTEL analysis
- 4.4. Market Entropy
- 4.5. Patent/Trademark Analysis
- 5. Global Electric Bus Battery Pack Market Analysis, Insights and Forecast, 2019-2031
- 5.1. Market Analysis, Insights and Forecast - by Propulsion Type
- 5.1.1. BEV
- 5.1.2. PHEV
- 5.2. Market Analysis, Insights and Forecast - by Battery Chemistry
- 5.2.1. LFP
- 5.2.2. NCA
- 5.2.3. NCM
- 5.2.4. NMC
- 5.2.5. Others
- 5.3. Market Analysis, Insights and Forecast - by Capacity
- 5.3.1. 15 kWh to 40 kWh
- 5.3.2. 40 kWh to 80 kWh
- 5.3.3. Above 80 kWh
- 5.3.4. Less than 15 kWh
- 5.4. Market Analysis, Insights and Forecast - by Battery Form
- 5.4.1. Cylindrical
- 5.4.2. Pouch
- 5.4.3. Prismatic
- 5.5. Market Analysis, Insights and Forecast - by Method
- 5.5.1. Laser
- 5.5.2. Wire
- 5.6. Market Analysis, Insights and Forecast - by Component
- 5.6.1. Anode
- 5.6.2. Cathode
- 5.6.3. Electrolyte
- 5.6.4. Separator
- 5.7. Market Analysis, Insights and Forecast - by Material Type
- 5.7.1. Cobalt
- 5.7.2. Lithium
- 5.7.3. Manganese
- 5.7.4. Natural Graphite
- 5.7.5. Nickel
- 5.7.6. Other Materials
- 5.8. Market Analysis, Insights and Forecast - by Region
- 5.8.1. North America
- 5.8.2. South America
- 5.8.3. Europe
- 5.8.4. Middle East & Africa
- 5.8.5. Asia Pacific
- 5.1. Market Analysis, Insights and Forecast - by Propulsion Type
- 6. North America Electric Bus Battery Pack Market Analysis, Insights and Forecast, 2019-2031
- 6.1. Market Analysis, Insights and Forecast - by Propulsion Type
- 6.1.1. BEV
- 6.1.2. PHEV
- 6.2. Market Analysis, Insights and Forecast - by Battery Chemistry
- 6.2.1. LFP
- 6.2.2. NCA
- 6.2.3. NCM
- 6.2.4. NMC
- 6.2.5. Others
- 6.3. Market Analysis, Insights and Forecast - by Capacity
- 6.3.1. 15 kWh to 40 kWh
- 6.3.2. 40 kWh to 80 kWh
- 6.3.3. Above 80 kWh
- 6.3.4. Less than 15 kWh
- 6.4. Market Analysis, Insights and Forecast - by Battery Form
- 6.4.1. Cylindrical
- 6.4.2. Pouch
- 6.4.3. Prismatic
- 6.5. Market Analysis, Insights and Forecast - by Method
- 6.5.1. Laser
- 6.5.2. Wire
- 6.6. Market Analysis, Insights and Forecast - by Component
- 6.6.1. Anode
- 6.6.2. Cathode
- 6.6.3. Electrolyte
- 6.6.4. Separator
- 6.7. Market Analysis, Insights and Forecast - by Material Type
- 6.7.1. Cobalt
- 6.7.2. Lithium
- 6.7.3. Manganese
- 6.7.4. Natural Graphite
- 6.7.5. Nickel
- 6.7.6. Other Materials
- 6.1. Market Analysis, Insights and Forecast - by Propulsion Type
- 7. South America Electric Bus Battery Pack Market Analysis, Insights and Forecast, 2019-2031
- 7.1. Market Analysis, Insights and Forecast - by Propulsion Type
- 7.1.1. BEV
- 7.1.2. PHEV
- 7.2. Market Analysis, Insights and Forecast - by Battery Chemistry
- 7.2.1. LFP
- 7.2.2. NCA
- 7.2.3. NCM
- 7.2.4. NMC
- 7.2.5. Others
- 7.3. Market Analysis, Insights and Forecast - by Capacity
- 7.3.1. 15 kWh to 40 kWh
- 7.3.2. 40 kWh to 80 kWh
- 7.3.3. Above 80 kWh
- 7.3.4. Less than 15 kWh
- 7.4. Market Analysis, Insights and Forecast - by Battery Form
- 7.4.1. Cylindrical
- 7.4.2. Pouch
- 7.4.3. Prismatic
- 7.5. Market Analysis, Insights and Forecast - by Method
- 7.5.1. Laser
- 7.5.2. Wire
- 7.6. Market Analysis, Insights and Forecast - by Component
- 7.6.1. Anode
- 7.6.2. Cathode
- 7.6.3. Electrolyte
- 7.6.4. Separator
- 7.7. Market Analysis, Insights and Forecast - by Material Type
- 7.7.1. Cobalt
- 7.7.2. Lithium
- 7.7.3. Manganese
- 7.7.4. Natural Graphite
- 7.7.5. Nickel
- 7.7.6. Other Materials
- 7.1. Market Analysis, Insights and Forecast - by Propulsion Type
- 8. Europe Electric Bus Battery Pack Market Analysis, Insights and Forecast, 2019-2031
- 8.1. Market Analysis, Insights and Forecast - by Propulsion Type
- 8.1.1. BEV
- 8.1.2. PHEV
- 8.2. Market Analysis, Insights and Forecast - by Battery Chemistry
- 8.2.1. LFP
- 8.2.2. NCA
- 8.2.3. NCM
- 8.2.4. NMC
- 8.2.5. Others
- 8.3. Market Analysis, Insights and Forecast - by Capacity
- 8.3.1. 15 kWh to 40 kWh
- 8.3.2. 40 kWh to 80 kWh
- 8.3.3. Above 80 kWh
- 8.3.4. Less than 15 kWh
- 8.4. Market Analysis, Insights and Forecast - by Battery Form
- 8.4.1. Cylindrical
- 8.4.2. Pouch
- 8.4.3. Prismatic
- 8.5. Market Analysis, Insights and Forecast - by Method
- 8.5.1. Laser
- 8.5.2. Wire
- 8.6. Market Analysis, Insights and Forecast - by Component
- 8.6.1. Anode
- 8.6.2. Cathode
- 8.6.3. Electrolyte
- 8.6.4. Separator
- 8.7. Market Analysis, Insights and Forecast - by Material Type
- 8.7.1. Cobalt
- 8.7.2. Lithium
- 8.7.3. Manganese
- 8.7.4. Natural Graphite
- 8.7.5. Nickel
- 8.7.6. Other Materials
- 8.1. Market Analysis, Insights and Forecast - by Propulsion Type
- 9. Middle East & Africa Electric Bus Battery Pack Market Analysis, Insights and Forecast, 2019-2031
- 9.1. Market Analysis, Insights and Forecast - by Propulsion Type
- 9.1.1. BEV
- 9.1.2. PHEV
- 9.2. Market Analysis, Insights and Forecast - by Battery Chemistry
- 9.2.1. LFP
- 9.2.2. NCA
- 9.2.3. NCM
- 9.2.4. NMC
- 9.2.5. Others
- 9.3. Market Analysis, Insights and Forecast - by Capacity
- 9.3.1. 15 kWh to 40 kWh
- 9.3.2. 40 kWh to 80 kWh
- 9.3.3. Above 80 kWh
- 9.3.4. Less than 15 kWh
- 9.4. Market Analysis, Insights and Forecast - by Battery Form
- 9.4.1. Cylindrical
- 9.4.2. Pouch
- 9.4.3. Prismatic
- 9.5. Market Analysis, Insights and Forecast - by Method
- 9.5.1. Laser
- 9.5.2. Wire
- 9.6. Market Analysis, Insights and Forecast - by Component
- 9.6.1. Anode
- 9.6.2. Cathode
- 9.6.3. Electrolyte
- 9.6.4. Separator
- 9.7. Market Analysis, Insights and Forecast - by Material Type
- 9.7.1. Cobalt
- 9.7.2. Lithium
- 9.7.3. Manganese
- 9.7.4. Natural Graphite
- 9.7.5. Nickel
- 9.7.6. Other Materials
- 9.1. Market Analysis, Insights and Forecast - by Propulsion Type
- 10. Asia Pacific Electric Bus Battery Pack Market Analysis, Insights and Forecast, 2019-2031
- 10.1. Market Analysis, Insights and Forecast - by Propulsion Type
- 10.1.1. BEV
- 10.1.2. PHEV
- 10.2. Market Analysis, Insights and Forecast - by Battery Chemistry
- 10.2.1. LFP
- 10.2.2. NCA
- 10.2.3. NCM
- 10.2.4. NMC
- 10.2.5. Others
- 10.3. Market Analysis, Insights and Forecast - by Capacity
- 10.3.1. 15 kWh to 40 kWh
- 10.3.2. 40 kWh to 80 kWh
- 10.3.3. Above 80 kWh
- 10.3.4. Less than 15 kWh
- 10.4. Market Analysis, Insights and Forecast - by Battery Form
- 10.4.1. Cylindrical
- 10.4.2. Pouch
- 10.4.3. Prismatic
- 10.5. Market Analysis, Insights and Forecast - by Method
- 10.5.1. Laser
- 10.5.2. Wire
- 10.6. Market Analysis, Insights and Forecast - by Component
- 10.6.1. Anode
- 10.6.2. Cathode
- 10.6.3. Electrolyte
- 10.6.4. Separator
- 10.7. Market Analysis, Insights and Forecast - by Material Type
- 10.7.1. Cobalt
- 10.7.2. Lithium
- 10.7.3. Manganese
- 10.7.4. Natural Graphite
- 10.7.5. Nickel
- 10.7.6. Other Materials
- 10.1. Market Analysis, Insights and Forecast - by Propulsion Type
- 11. Competitive Analysis
- 11.1. Global Market Share Analysis 2024
- 11.2. Company Profiles
- 11.2.1 BMZ Batterien-Montage-Zentrum GmbH
- 11.2.1.1. Overview
- 11.2.1.2. Products
- 11.2.1.3. SWOT Analysis
- 11.2.1.4. Recent Developments
- 11.2.1.5. Financials (Based on Availability)
- 11.2.2 Tata Autocomp Systems Ltd
- 11.2.2.1. Overview
- 11.2.2.2. Products
- 11.2.2.3. SWOT Analysis
- 11.2.2.4. Recent Developments
- 11.2.2.5. Financials (Based on Availability)
- 11.2.3 China Aviation Battery Co Ltd (CALB)
- 11.2.3.1. Overview
- 11.2.3.2. Products
- 11.2.3.3. SWOT Analysis
- 11.2.3.4. Recent Developments
- 11.2.3.5. Financials (Based on Availability)
- 11.2.4 Samsung SDI Co Ltd
- 11.2.4.1. Overview
- 11.2.4.2. Products
- 11.2.4.3. SWOT Analysis
- 11.2.4.4. Recent Developments
- 11.2.4.5. Financials (Based on Availability)
- 11.2.5 LG Energy Solution Ltd
- 11.2.5.1. Overview
- 11.2.5.2. Products
- 11.2.5.3. SWOT Analysis
- 11.2.5.4. Recent Developments
- 11.2.5.5. Financials (Based on Availability)
- 11.2.6 Guoxuan High-tech Co Ltd
- 11.2.6.1. Overview
- 11.2.6.2. Products
- 11.2.6.3. SWOT Analysis
- 11.2.6.4. Recent Developments
- 11.2.6.5. Financials (Based on Availability)
- 11.2.7 Farasis Energy (Ganzhou) Co Ltd
- 11.2.7.1. Overview
- 11.2.7.2. Products
- 11.2.7.3. SWOT Analysis
- 11.2.7.4. Recent Developments
- 11.2.7.5. Financials (Based on Availability)
- 11.2.8 Gotion High-Tech Co Ltd
- 11.2.8.1. Overview
- 11.2.8.2. Products
- 11.2.8.3. SWOT Analysis
- 11.2.8.4. Recent Developments
- 11.2.8.5. Financials (Based on Availability)
- 11.2.9 TOSHIBA Corp
- 11.2.9.1. Overview
- 11.2.9.2. Products
- 11.2.9.3. SWOT Analysis
- 11.2.9.4. Recent Developments
- 11.2.9.5. Financials (Based on Availability)
- 11.2.10 Contemporary Amperex Technology Co Ltd (CATL)
- 11.2.10.1. Overview
- 11.2.10.2. Products
- 11.2.10.3. SWOT Analysis
- 11.2.10.4. Recent Developments
- 11.2.10.5. Financials (Based on Availability)
- 11.2.11 NFI Group Inc
- 11.2.11.1. Overview
- 11.2.11.2. Products
- 11.2.11.3. SWOT Analysis
- 11.2.11.4. Recent Developments
- 11.2.11.5. Financials (Based on Availability)
- 11.2.12 Leclanché SA
- 11.2.12.1. Overview
- 11.2.12.2. Products
- 11.2.12.3. SWOT Analysis
- 11.2.12.4. Recent Developments
- 11.2.12.5. Financials (Based on Availability)
- 11.2.13 BYD Company Ltd
- 11.2.13.1. Overview
- 11.2.13.2. Products
- 11.2.13.3. SWOT Analysis
- 11.2.13.4. Recent Developments
- 11.2.13.5. Financials (Based on Availability)
- 11.2.14 Sunwoda Electric Vehicle Battery Co Ltd (Sunwoda)
- 11.2.14.1. Overview
- 11.2.14.2. Products
- 11.2.14.3. SWOT Analysis
- 11.2.14.4. Recent Developments
- 11.2.14.5. Financials (Based on Availability)
- 11.2.15 Proterra Operating Company Inc
- 11.2.15.1. Overview
- 11.2.15.2. Products
- 11.2.15.3. SWOT Analysis
- 11.2.15.4. Recent Developments
- 11.2.15.5. Financials (Based on Availability)
- 11.2.16 Panasonic Holdings Corporation
- 11.2.16.1. Overview
- 11.2.16.2. Products
- 11.2.16.3. SWOT Analysis
- 11.2.16.4. Recent Developments
- 11.2.16.5. Financials (Based on Availability)
- 11.2.1 BMZ Batterien-Montage-Zentrum GmbH
List of Figures
- Figure 1: Global Electric Bus Battery Pack Market Revenue Breakdown (Million, %) by Region 2024 & 2032
- Figure 2: North America Electric Bus Battery Pack Market Revenue (Million), by Propulsion Type 2024 & 2032
- Figure 3: North America Electric Bus Battery Pack Market Revenue Share (%), by Propulsion Type 2024 & 2032
- Figure 4: North America Electric Bus Battery Pack Market Revenue (Million), by Battery Chemistry 2024 & 2032
- Figure 5: North America Electric Bus Battery Pack Market Revenue Share (%), by Battery Chemistry 2024 & 2032
- Figure 6: North America Electric Bus Battery Pack Market Revenue (Million), by Capacity 2024 & 2032
- Figure 7: North America Electric Bus Battery Pack Market Revenue Share (%), by Capacity 2024 & 2032
- Figure 8: North America Electric Bus Battery Pack Market Revenue (Million), by Battery Form 2024 & 2032
- Figure 9: North America Electric Bus Battery Pack Market Revenue Share (%), by Battery Form 2024 & 2032
- Figure 10: North America Electric Bus Battery Pack Market Revenue (Million), by Method 2024 & 2032
- Figure 11: North America Electric Bus Battery Pack Market Revenue Share (%), by Method 2024 & 2032
- Figure 12: North America Electric Bus Battery Pack Market Revenue (Million), by Component 2024 & 2032
- Figure 13: North America Electric Bus Battery Pack Market Revenue Share (%), by Component 2024 & 2032
- Figure 14: North America Electric Bus Battery Pack Market Revenue (Million), by Material Type 2024 & 2032
- Figure 15: North America Electric Bus Battery Pack Market Revenue Share (%), by Material Type 2024 & 2032
- Figure 16: North America Electric Bus Battery Pack Market Revenue (Million), by Country 2024 & 2032
- Figure 17: North America Electric Bus Battery Pack Market Revenue Share (%), by Country 2024 & 2032
- Figure 18: South America Electric Bus Battery Pack Market Revenue (Million), by Propulsion Type 2024 & 2032
- Figure 19: South America Electric Bus Battery Pack Market Revenue Share (%), by Propulsion Type 2024 & 2032
- Figure 20: South America Electric Bus Battery Pack Market Revenue (Million), by Battery Chemistry 2024 & 2032
- Figure 21: South America Electric Bus Battery Pack Market Revenue Share (%), by Battery Chemistry 2024 & 2032
- Figure 22: South America Electric Bus Battery Pack Market Revenue (Million), by Capacity 2024 & 2032
- Figure 23: South America Electric Bus Battery Pack Market Revenue Share (%), by Capacity 2024 & 2032
- Figure 24: South America Electric Bus Battery Pack Market Revenue (Million), by Battery Form 2024 & 2032
- Figure 25: South America Electric Bus Battery Pack Market Revenue Share (%), by Battery Form 2024 & 2032
- Figure 26: South America Electric Bus Battery Pack Market Revenue (Million), by Method 2024 & 2032
- Figure 27: South America Electric Bus Battery Pack Market Revenue Share (%), by Method 2024 & 2032
- Figure 28: South America Electric Bus Battery Pack Market Revenue (Million), by Component 2024 & 2032
- Figure 29: South America Electric Bus Battery Pack Market Revenue Share (%), by Component 2024 & 2032
- Figure 30: South America Electric Bus Battery Pack Market Revenue (Million), by Material Type 2024 & 2032
- Figure 31: South America Electric Bus Battery Pack Market Revenue Share (%), by Material Type 2024 & 2032
- Figure 32: South America Electric Bus Battery Pack Market Revenue (Million), by Country 2024 & 2032
- Figure 33: South America Electric Bus Battery Pack Market Revenue Share (%), by Country 2024 & 2032
- Figure 34: Europe Electric Bus Battery Pack Market Revenue (Million), by Propulsion Type 2024 & 2032
- Figure 35: Europe Electric Bus Battery Pack Market Revenue Share (%), by Propulsion Type 2024 & 2032
- Figure 36: Europe Electric Bus Battery Pack Market Revenue (Million), by Battery Chemistry 2024 & 2032
- Figure 37: Europe Electric Bus Battery Pack Market Revenue Share (%), by Battery Chemistry 2024 & 2032
- Figure 38: Europe Electric Bus Battery Pack Market Revenue (Million), by Capacity 2024 & 2032
- Figure 39: Europe Electric Bus Battery Pack Market Revenue Share (%), by Capacity 2024 & 2032
- Figure 40: Europe Electric Bus Battery Pack Market Revenue (Million), by Battery Form 2024 & 2032
- Figure 41: Europe Electric Bus Battery Pack Market Revenue Share (%), by Battery Form 2024 & 2032
- Figure 42: Europe Electric Bus Battery Pack Market Revenue (Million), by Method 2024 & 2032
- Figure 43: Europe Electric Bus Battery Pack Market Revenue Share (%), by Method 2024 & 2032
- Figure 44: Europe Electric Bus Battery Pack Market Revenue (Million), by Component 2024 & 2032
- Figure 45: Europe Electric Bus Battery Pack Market Revenue Share (%), by Component 2024 & 2032
- Figure 46: Europe Electric Bus Battery Pack Market Revenue (Million), by Material Type 2024 & 2032
- Figure 47: Europe Electric Bus Battery Pack Market Revenue Share (%), by Material Type 2024 & 2032
- Figure 48: Europe Electric Bus Battery Pack Market Revenue (Million), by Country 2024 & 2032
- Figure 49: Europe Electric Bus Battery Pack Market Revenue Share (%), by Country 2024 & 2032
- Figure 50: Middle East & Africa Electric Bus Battery Pack Market Revenue (Million), by Propulsion Type 2024 & 2032
- Figure 51: Middle East & Africa Electric Bus Battery Pack Market Revenue Share (%), by Propulsion Type 2024 & 2032
- Figure 52: Middle East & Africa Electric Bus Battery Pack Market Revenue (Million), by Battery Chemistry 2024 & 2032
- Figure 53: Middle East & Africa Electric Bus Battery Pack Market Revenue Share (%), by Battery Chemistry 2024 & 2032
- Figure 54: Middle East & Africa Electric Bus Battery Pack Market Revenue (Million), by Capacity 2024 & 2032
- Figure 55: Middle East & Africa Electric Bus Battery Pack Market Revenue Share (%), by Capacity 2024 & 2032
- Figure 56: Middle East & Africa Electric Bus Battery Pack Market Revenue (Million), by Battery Form 2024 & 2032
- Figure 57: Middle East & Africa Electric Bus Battery Pack Market Revenue Share (%), by Battery Form 2024 & 2032
- Figure 58: Middle East & Africa Electric Bus Battery Pack Market Revenue (Million), by Method 2024 & 2032
- Figure 59: Middle East & Africa Electric Bus Battery Pack Market Revenue Share (%), by Method 2024 & 2032
- Figure 60: Middle East & Africa Electric Bus Battery Pack Market Revenue (Million), by Component 2024 & 2032
- Figure 61: Middle East & Africa Electric Bus Battery Pack Market Revenue Share (%), by Component 2024 & 2032
- Figure 62: Middle East & Africa Electric Bus Battery Pack Market Revenue (Million), by Material Type 2024 & 2032
- Figure 63: Middle East & Africa Electric Bus Battery Pack Market Revenue Share (%), by Material Type 2024 & 2032
- Figure 64: Middle East & Africa Electric Bus Battery Pack Market Revenue (Million), by Country 2024 & 2032
- Figure 65: Middle East & Africa Electric Bus Battery Pack Market Revenue Share (%), by Country 2024 & 2032
- Figure 66: Asia Pacific Electric Bus Battery Pack Market Revenue (Million), by Propulsion Type 2024 & 2032
- Figure 67: Asia Pacific Electric Bus Battery Pack Market Revenue Share (%), by Propulsion Type 2024 & 2032
- Figure 68: Asia Pacific Electric Bus Battery Pack Market Revenue (Million), by Battery Chemistry 2024 & 2032
- Figure 69: Asia Pacific Electric Bus Battery Pack Market Revenue Share (%), by Battery Chemistry 2024 & 2032
- Figure 70: Asia Pacific Electric Bus Battery Pack Market Revenue (Million), by Capacity 2024 & 2032
- Figure 71: Asia Pacific Electric Bus Battery Pack Market Revenue Share (%), by Capacity 2024 & 2032
- Figure 72: Asia Pacific Electric Bus Battery Pack Market Revenue (Million), by Battery Form 2024 & 2032
- Figure 73: Asia Pacific Electric Bus Battery Pack Market Revenue Share (%), by Battery Form 2024 & 2032
- Figure 74: Asia Pacific Electric Bus Battery Pack Market Revenue (Million), by Method 2024 & 2032
- Figure 75: Asia Pacific Electric Bus Battery Pack Market Revenue Share (%), by Method 2024 & 2032
- Figure 76: Asia Pacific Electric Bus Battery Pack Market Revenue (Million), by Component 2024 & 2032
- Figure 77: Asia Pacific Electric Bus Battery Pack Market Revenue Share (%), by Component 2024 & 2032
- Figure 78: Asia Pacific Electric Bus Battery Pack Market Revenue (Million), by Material Type 2024 & 2032
- Figure 79: Asia Pacific Electric Bus Battery Pack Market Revenue Share (%), by Material Type 2024 & 2032
- Figure 80: Asia Pacific Electric Bus Battery Pack Market Revenue (Million), by Country 2024 & 2032
- Figure 81: Asia Pacific Electric Bus Battery Pack Market Revenue Share (%), by Country 2024 & 2032
List of Tables
- Table 1: Global Electric Bus Battery Pack Market Revenue Million Forecast, by Region 2019 & 2032
- Table 2: Global Electric Bus Battery Pack Market Revenue Million Forecast, by Propulsion Type 2019 & 2032
- Table 3: Global Electric Bus Battery Pack Market Revenue Million Forecast, by Battery Chemistry 2019 & 2032
- Table 4: Global Electric Bus Battery Pack Market Revenue Million Forecast, by Capacity 2019 & 2032
- Table 5: Global Electric Bus Battery Pack Market Revenue Million Forecast, by Battery Form 2019 & 2032
- Table 6: Global Electric Bus Battery Pack Market Revenue Million Forecast, by Method 2019 & 2032
- Table 7: Global Electric Bus Battery Pack Market Revenue Million Forecast, by Component 2019 & 2032
- Table 8: Global Electric Bus Battery Pack Market Revenue Million Forecast, by Material Type 2019 & 2032
- Table 9: Global Electric Bus Battery Pack Market Revenue Million Forecast, by Region 2019 & 2032
- Table 10: Global Electric Bus Battery Pack Market Revenue Million Forecast, by Propulsion Type 2019 & 2032
- Table 11: Global Electric Bus Battery Pack Market Revenue Million Forecast, by Battery Chemistry 2019 & 2032
- Table 12: Global Electric Bus Battery Pack Market Revenue Million Forecast, by Capacity 2019 & 2032
- Table 13: Global Electric Bus Battery Pack Market Revenue Million Forecast, by Battery Form 2019 & 2032
- Table 14: Global Electric Bus Battery Pack Market Revenue Million Forecast, by Method 2019 & 2032
- Table 15: Global Electric Bus Battery Pack Market Revenue Million Forecast, by Component 2019 & 2032
- Table 16: Global Electric Bus Battery Pack Market Revenue Million Forecast, by Material Type 2019 & 2032
- Table 17: Global Electric Bus Battery Pack Market Revenue Million Forecast, by Country 2019 & 2032
- Table 18: United States Electric Bus Battery Pack Market Revenue (Million) Forecast, by Application 2019 & 2032
- Table 19: Canada Electric Bus Battery Pack Market Revenue (Million) Forecast, by Application 2019 & 2032
- Table 20: Mexico Electric Bus Battery Pack Market Revenue (Million) Forecast, by Application 2019 & 2032
- Table 21: Global Electric Bus Battery Pack Market Revenue Million Forecast, by Propulsion Type 2019 & 2032
- Table 22: Global Electric Bus Battery Pack Market Revenue Million Forecast, by Battery Chemistry 2019 & 2032
- Table 23: Global Electric Bus Battery Pack Market Revenue Million Forecast, by Capacity 2019 & 2032
- Table 24: Global Electric Bus Battery Pack Market Revenue Million Forecast, by Battery Form 2019 & 2032
- Table 25: Global Electric Bus Battery Pack Market Revenue Million Forecast, by Method 2019 & 2032
- Table 26: Global Electric Bus Battery Pack Market Revenue Million Forecast, by Component 2019 & 2032
- Table 27: Global Electric Bus Battery Pack Market Revenue Million Forecast, by Material Type 2019 & 2032
- Table 28: Global Electric Bus Battery Pack Market Revenue Million Forecast, by Country 2019 & 2032
- Table 29: Brazil Electric Bus Battery Pack Market Revenue (Million) Forecast, by Application 2019 & 2032
- Table 30: Argentina Electric Bus Battery Pack Market Revenue (Million) Forecast, by Application 2019 & 2032
- Table 31: Rest of South America Electric Bus Battery Pack Market Revenue (Million) Forecast, by Application 2019 & 2032
- Table 32: Global Electric Bus Battery Pack Market Revenue Million Forecast, by Propulsion Type 2019 & 2032
- Table 33: Global Electric Bus Battery Pack Market Revenue Million Forecast, by Battery Chemistry 2019 & 2032
- Table 34: Global Electric Bus Battery Pack Market Revenue Million Forecast, by Capacity 2019 & 2032
- Table 35: Global Electric Bus Battery Pack Market Revenue Million Forecast, by Battery Form 2019 & 2032
- Table 36: Global Electric Bus Battery Pack Market Revenue Million Forecast, by Method 2019 & 2032
- Table 37: Global Electric Bus Battery Pack Market Revenue Million Forecast, by Component 2019 & 2032
- Table 38: Global Electric Bus Battery Pack Market Revenue Million Forecast, by Material Type 2019 & 2032
- Table 39: Global Electric Bus Battery Pack Market Revenue Million Forecast, by Country 2019 & 2032
- Table 40: United Kingdom Electric Bus Battery Pack Market Revenue (Million) Forecast, by Application 2019 & 2032
- Table 41: Germany Electric Bus Battery Pack Market Revenue (Million) Forecast, by Application 2019 & 2032
- Table 42: France Electric Bus Battery Pack Market Revenue (Million) Forecast, by Application 2019 & 2032
- Table 43: Italy Electric Bus Battery Pack Market Revenue (Million) Forecast, by Application 2019 & 2032
- Table 44: Spain Electric Bus Battery Pack Market Revenue (Million) Forecast, by Application 2019 & 2032
- Table 45: Russia Electric Bus Battery Pack Market Revenue (Million) Forecast, by Application 2019 & 2032
- Table 46: Benelux Electric Bus Battery Pack Market Revenue (Million) Forecast, by Application 2019 & 2032
- Table 47: Nordics Electric Bus Battery Pack Market Revenue (Million) Forecast, by Application 2019 & 2032
- Table 48: Rest of Europe Electric Bus Battery Pack Market Revenue (Million) Forecast, by Application 2019 & 2032
- Table 49: Global Electric Bus Battery Pack Market Revenue Million Forecast, by Propulsion Type 2019 & 2032
- Table 50: Global Electric Bus Battery Pack Market Revenue Million Forecast, by Battery Chemistry 2019 & 2032
- Table 51: Global Electric Bus Battery Pack Market Revenue Million Forecast, by Capacity 2019 & 2032
- Table 52: Global Electric Bus Battery Pack Market Revenue Million Forecast, by Battery Form 2019 & 2032
- Table 53: Global Electric Bus Battery Pack Market Revenue Million Forecast, by Method 2019 & 2032
- Table 54: Global Electric Bus Battery Pack Market Revenue Million Forecast, by Component 2019 & 2032
- Table 55: Global Electric Bus Battery Pack Market Revenue Million Forecast, by Material Type 2019 & 2032
- Table 56: Global Electric Bus Battery Pack Market Revenue Million Forecast, by Country 2019 & 2032
- Table 57: Turkey Electric Bus Battery Pack Market Revenue (Million) Forecast, by Application 2019 & 2032
- Table 58: Israel Electric Bus Battery Pack Market Revenue (Million) Forecast, by Application 2019 & 2032
- Table 59: GCC Electric Bus Battery Pack Market Revenue (Million) Forecast, by Application 2019 & 2032
- Table 60: North Africa Electric Bus Battery Pack Market Revenue (Million) Forecast, by Application 2019 & 2032
- Table 61: South Africa Electric Bus Battery Pack Market Revenue (Million) Forecast, by Application 2019 & 2032
- Table 62: Rest of Middle East & Africa Electric Bus Battery Pack Market Revenue (Million) Forecast, by Application 2019 & 2032
- Table 63: Global Electric Bus Battery Pack Market Revenue Million Forecast, by Propulsion Type 2019 & 2032
- Table 64: Global Electric Bus Battery Pack Market Revenue Million Forecast, by Battery Chemistry 2019 & 2032
- Table 65: Global Electric Bus Battery Pack Market Revenue Million Forecast, by Capacity 2019 & 2032
- Table 66: Global Electric Bus Battery Pack Market Revenue Million Forecast, by Battery Form 2019 & 2032
- Table 67: Global Electric Bus Battery Pack Market Revenue Million Forecast, by Method 2019 & 2032
- Table 68: Global Electric Bus Battery Pack Market Revenue Million Forecast, by Component 2019 & 2032
- Table 69: Global Electric Bus Battery Pack Market Revenue Million Forecast, by Material Type 2019 & 2032
- Table 70: Global Electric Bus Battery Pack Market Revenue Million Forecast, by Country 2019 & 2032
- Table 71: China Electric Bus Battery Pack Market Revenue (Million) Forecast, by Application 2019 & 2032
- Table 72: India Electric Bus Battery Pack Market Revenue (Million) Forecast, by Application 2019 & 2032
- Table 73: Japan Electric Bus Battery Pack Market Revenue (Million) Forecast, by Application 2019 & 2032
- Table 74: South Korea Electric Bus Battery Pack Market Revenue (Million) Forecast, by Application 2019 & 2032
- Table 75: ASEAN Electric Bus Battery Pack Market Revenue (Million) Forecast, by Application 2019 & 2032
- Table 76: Oceania Electric Bus Battery Pack Market Revenue (Million) Forecast, by Application 2019 & 2032
- Table 77: Rest of Asia Pacific Electric Bus Battery Pack Market Revenue (Million) Forecast, by Application 2019 & 2032
Frequently Asked Questions
1. What is the projected Compound Annual Growth Rate (CAGR) of the Electric Bus Battery Pack Market?
The projected CAGR is approximately 24.50%.
2. Which companies are prominent players in the Electric Bus Battery Pack Market?
Key companies in the market include BMZ Batterien-Montage-Zentrum GmbH, Tata Autocomp Systems Ltd, China Aviation Battery Co Ltd (CALB), Samsung SDI Co Ltd, LG Energy Solution Ltd, Guoxuan High-tech Co Ltd, Farasis Energy (Ganzhou) Co Ltd, Gotion High-Tech Co Ltd, TOSHIBA Corp, Contemporary Amperex Technology Co Ltd (CATL), NFI Group Inc, Leclanché SA, BYD Company Ltd, Sunwoda Electric Vehicle Battery Co Ltd (Sunwoda), Proterra Operating Company Inc, Panasonic Holdings Corporation.
3. What are the main segments of the Electric Bus Battery Pack Market?
The market segments include Propulsion Type, Battery Chemistry, Capacity, Battery Form, Method, Component, Material Type.
4. Can you provide details about the market size?
The market size is estimated to be USD XX Million as of 2022.
5. What are some drivers contributing to market growth?
Exponential Increase in Automotive Sector.
6. What are the notable trends driving market growth?
OTHER KEY INDUSTRY TRENDS COVERED IN THE REPORT.
7. Are there any restraints impacting market growth?
Digitization of R&D Operations in Automotive Sector.
8. Can you provide examples of recent developments in the market?
February 2023: Samsung SDI is expanding investment in its Hungary plant, which has the largest production capacity to respond to the fast-increasing demand for mid- to large-size batteries.January 2023: Korean battery maker Samsung SDI posted record-high profit in 2022, driven by solid demand for electric vehicle batteries and energy storage systems.November 2022: Samsung SDI has signed an agreement with Sungkyunkwan University to establish a course for battery technologies to raise battery experts.
9. What pricing options are available for accessing the report?
Pricing options include single-user, multi-user, and enterprise licenses priced at USD 3800, USD 4500, and USD 5800 respectively.
10. Is the market size provided in terms of value or volume?
The market size is provided in terms of value, measured in Million.
11. Are there any specific market keywords associated with the report?
Yes, the market keyword associated with the report is "Electric Bus Battery Pack Market," which aids in identifying and referencing the specific market segment covered.
12. How do I determine which pricing option suits my needs best?
The pricing options vary based on user requirements and access needs. Individual users may opt for single-user licenses, while businesses requiring broader access may choose multi-user or enterprise licenses for cost-effective access to the report.
13. Are there any additional resources or data provided in the Electric Bus Battery Pack Market report?
While the report offers comprehensive insights, it's advisable to review the specific contents or supplementary materials provided to ascertain if additional resources or data are available.
14. How can I stay updated on further developments or reports in the Electric Bus Battery Pack Market?
To stay informed about further developments, trends, and reports in the Electric Bus Battery Pack Market, consider subscribing to industry newsletters, following relevant companies and organizations, or regularly checking reputable industry news sources and publications.
Methodology
Step 1 - Identification of Relevant Samples Size from Population Database


Step 2 - Approaches for Defining Global Market Size (Value, Volume* & Price*)

Note*: In applicable scenarios
Step 3 - Data Sources
Primary Research
- Web Analytics
- Survey Reports
- Research Institute
- Latest Research Reports
- Opinion Leaders
Secondary Research
- Annual Reports
- White Paper
- Latest Press Release
- Industry Association
- Paid Database
- Investor Presentations

Step 4 - Data Triangulation
Involves using different sources of information in order to increase the validity of a study
These sources are likely to be stakeholders in a program - participants, other researchers, program staff, other community members, and so on.
Then we put all data in single framework & apply various statistical tools to find out the dynamic on the market.
During the analysis stage, feedback from the stakeholder groups would be compared to determine areas of agreement as well as areas of divergence
