

Key Insights
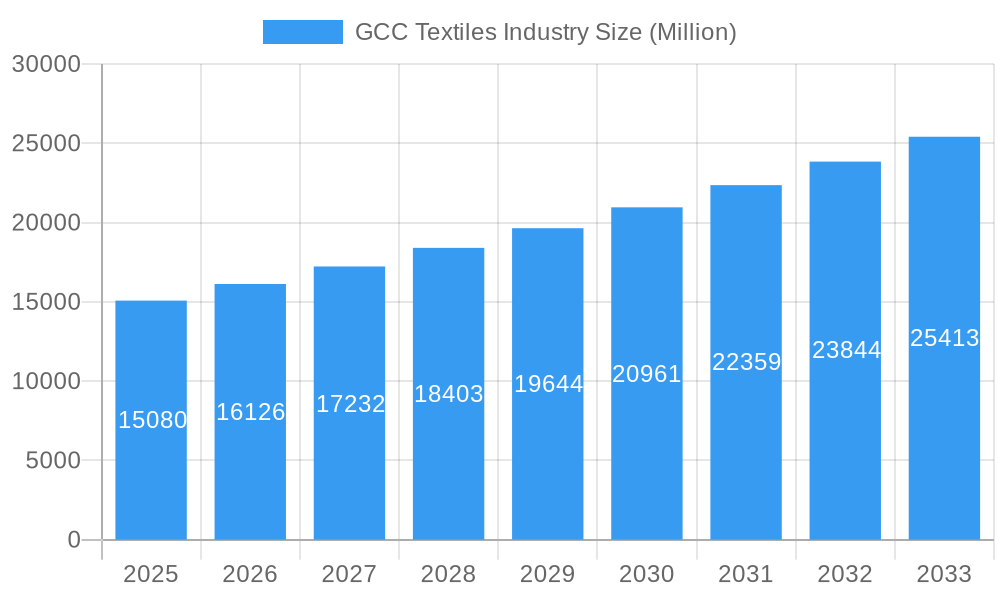
The GCC textiles industry, valued at $15.08 billion in 2025, is projected to experience robust growth, driven by a Compound Annual Growth Rate (CAGR) of 6.78% from 2025 to 2033. This expansion is fueled by several key factors. Firstly, the region's burgeoning tourism sector and growing population are creating significant demand for apparel and home textiles. Secondly, government initiatives promoting diversification away from oil and investment in local manufacturing are fostering the growth of domestic textile production. This includes support for sustainable and technologically advanced textile manufacturing processes. Finally, the increasing adoption of e-commerce platforms is providing new avenues for textile businesses to reach a wider customer base across the GCC. However, challenges remain. Competition from low-cost textile producers in other regions presents a significant hurdle. Fluctuations in global cotton prices and supply chain disruptions also pose risks to the industry's stability.
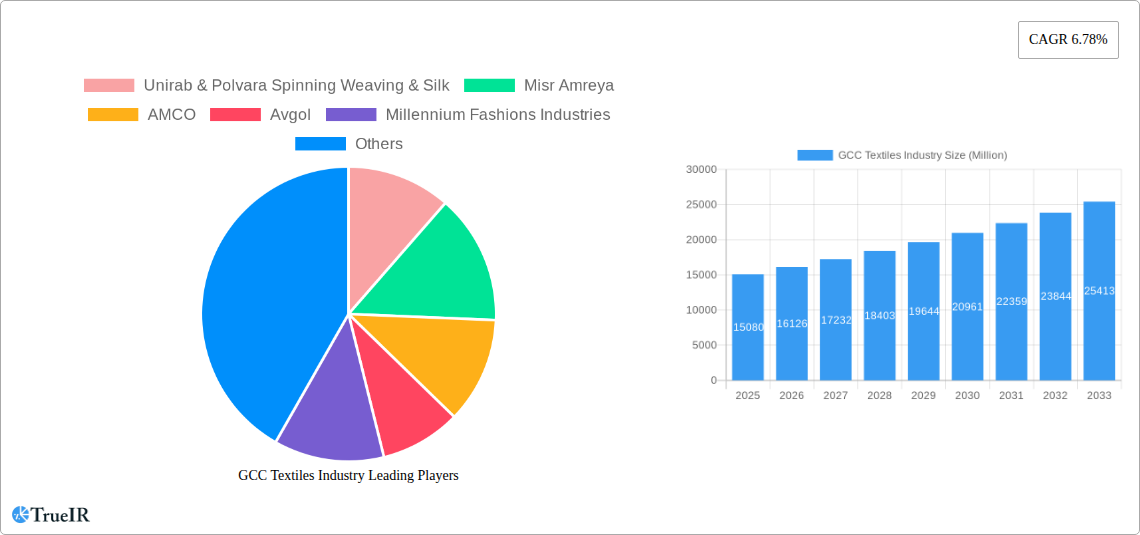
GCC Textiles Industry Market Size (In Billion)
Despite these challenges, the long-term outlook for the GCC textiles industry remains positive. Strategic partnerships between local manufacturers and international brands are anticipated to increase. Furthermore, a focus on high-value-added textile products, such as specialized technical textiles and luxury fabrics, could significantly boost profitability and market share. This requires investment in research and development, as well as skilled labor training. The industry’s segmentation, encompassing apparel, home textiles, technical textiles, and others, offers opportunities for specialized growth and targeted marketing strategies. Key players like Unirab & Polvara Spinning Weaving & Silk, Misr Amreya, and AMCO are well-positioned to capitalize on these emerging trends, though consistent innovation and adaptation to global market changes remain critical for sustained success.
GCC Textiles Industry Company Market Share
GCC Textiles Industry Market Report: 2019-2033
This comprehensive report provides a detailed analysis of the GCC textiles industry, encompassing market size, trends, competitive landscape, and future outlook from 2019 to 2033. With a focus on key players like Unirab & Polvara Spinning Weaving & Silk, Misr Amreya, AMCO, Avgol, Millennium Fashions Industries, Embee Group, Kabale, FPC Coated Technical Textiles, Alyaf Industrial Company Ltd, Aratex Group, Lomar Selection, and Valleystar Uniforms (list not exhaustive), this report is an essential resource for businesses, investors, and policymakers seeking to understand this dynamic market. The report leverages extensive data analysis and industry expertise to provide actionable insights and forecasts, empowering informed decision-making in this rapidly evolving sector. Base year is 2025 and estimated/forecast period is 2025-2033.
GCC Textiles Industry Market Structure & Competitive Landscape
The GCC textiles industry exhibits a moderately concentrated market structure, with a Herfindahl-Hirschman Index (HHI) estimated at xx in 2024. Several large players dominate specific segments, while a substantial number of smaller companies cater to niche markets. Innovation is driven by technological advancements in fiber production, weaving techniques, and finishing processes. Government regulations, particularly concerning labor practices and environmental sustainability, significantly impact industry operations. Product substitutes, such as synthetic fabrics and alternative materials, pose a moderate competitive threat. End-user segmentation includes apparel, home textiles, technical textiles, and industrial fabrics. The M&A activity in the industry has been moderate in recent years, with approximately xx Million USD worth of transactions recorded between 2019 and 2024. This signifies a strategic shift towards consolidation and expansion within the sector.
- Market Concentration: HHI of xx (2024) indicating a moderately concentrated market.
- Innovation Drivers: Technological advancements in fiber production and finishing processes.
- Regulatory Impacts: Stringent labor and environmental regulations.
- Product Substitutes: Growing competition from synthetic fabrics and alternative materials.
- End-User Segmentation: Apparel, home textiles, technical textiles, and industrial fabrics.
- M&A Trends: Moderate M&A activity with approximately xx Million USD in transactions (2019-2024).
GCC Textiles Industry Market Trends & Opportunities
The GCC textiles market is projected to experience robust growth, with a Compound Annual Growth Rate (CAGR) of xx% from 2025 to 2033. This growth is fueled by increasing disposable incomes, a burgeoning population, and rising demand for fashion apparel and home textiles. Technological advancements, particularly in automation and digitalization, are reshaping the industry, leading to increased efficiency and improved product quality. Consumer preferences are shifting towards sustainable and ethically sourced products, creating opportunities for companies that prioritize these values. Competitive dynamics are influenced by both local and international players, with a growing emphasis on branding and value-added services. Market penetration rates for specific segments vary considerably, with higher penetration observed in traditional textile categories and significant growth potential in specialty textiles. The overall market size is projected to reach xx Million USD by 2033.
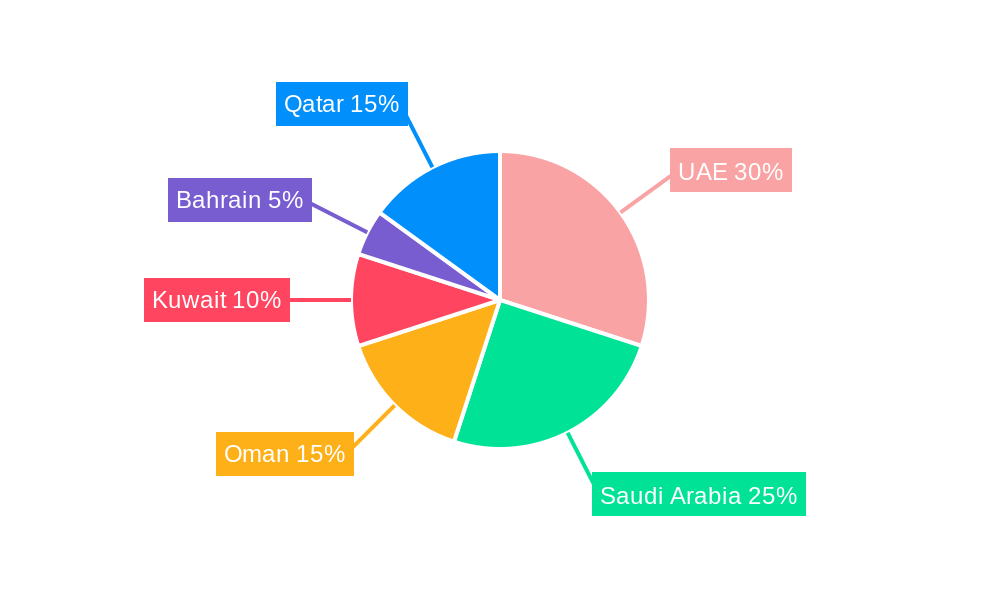
Dominant Markets & Segments in GCC Textiles Industry
The UAE and Saudi Arabia are currently the dominant markets within the GCC textiles industry. This dominance is attributed to several key factors:
- Robust Infrastructure: Well-developed infrastructure, including port facilities and logistics networks, facilitates efficient trade and distribution.
- Government Support: Supportive government policies, including investment incentives and industry-specific regulations, foster growth and development.
- Consumer Demand: High consumer demand for textiles and apparel drives market expansion.
- Strategic Location: Geographic location facilitates trade with other regional and international markets.
The apparel segment is the largest segment within the GCC textiles market, accounting for approximately xx% of the overall market value. Significant growth opportunities exist in the technical textiles and home textiles segments.
GCC Textiles Industry Product Analysis
The GCC textiles industry showcases a diverse product portfolio ranging from traditional fabrics to advanced technical textiles. Recent innovations encompass sustainable and eco-friendly materials, high-performance fabrics with enhanced durability and functionality, and intelligent textiles integrated with sensors and technology. These innovations cater to the growing demand for functional, sustainable, and technologically advanced products across various applications. This trend is further driven by increasing consumer awareness and adoption of technologically advanced textiles across diverse market segments.
Key Drivers, Barriers & Challenges in GCC Textiles Industry
Key Drivers:
- Rising Disposable Incomes: Increased purchasing power drives demand for textiles.
- Population Growth: Expanding population fuels the need for clothing and home textiles.
- Government Initiatives: Investment incentives and supportive policies promote industry growth.
- Technological Advancements: Automation and innovation enhance efficiency and product quality.
Challenges:
- Competition from Low-Cost Producers: Imports from countries with lower labor costs present a significant challenge. This impacts profitability for local businesses. This is estimated to cause a reduction in profit margin by xx%.
- Supply Chain Disruptions: Global supply chain disruptions create uncertainty and volatility.
- Regulatory Hurdles: Complex regulations and bureaucratic processes can hinder business operations.
Growth Drivers in the GCC Textiles Industry Market
Growth in the GCC textiles industry is fueled by rising disposable incomes, population growth, favorable government policies, and technological innovation. Investment incentives, infrastructure development, and strategic partnerships are key catalysts for expanding the market. The focus on sustainable practices and the adoption of advanced technologies also significantly contribute to the market's growth trajectory.
Challenges Impacting GCC Textiles Industry Growth
Challenges include competition from low-cost producers, supply chain disruptions, regulatory complexities, and the need for skilled labor. These factors can impede market growth and profitability. Addressing these challenges requires collaborative efforts between government, industry, and educational institutions.
Key Players Shaping the GCC Textiles Industry Market
- Unirab & Polvara Spinning Weaving & Silk
- Misr Amreya
- AMCO
- Avgol
- Millennium Fashions Industries
- Embee Group
- Kabale
- FPC Coated Technical Textiles
- Alyaf Industrial Company Ltd
- Aratex Group
- Lomar Selection
- Valleystar Uniforms
Significant GCC Textiles Industry Industry Milestones
- February 2023: Saudi Arabia's MODON announces USD 1.1 Billion in textile investments, covering 125 industrial contracts across 19 cities and over one million square meters. This signals significant expansion within the industry.
- October 2022: Nykaa partners with Apparel Group for GCC expansion, indicating growing interest from international players in this market. This strategic alliance marks a significant entry point for international brands into the region.
Future Outlook for GCC Textiles Industry Market
The GCC textiles industry is poised for continued growth, driven by increasing demand, supportive government policies, and technological advancements. Strategic investments in sustainable practices, automation, and innovation will be crucial for companies to maintain a competitive edge. The market offers significant opportunities for both local and international players seeking to capitalize on the region's economic growth and evolving consumer preferences. The focus on high-value-added products and diversification into niche segments will be essential for long-term success.
GCC Textiles Industry Segmentation
-
1. Application
- 1.1. Clothing
- 1.2. Industrial/Technical Applications
- 1.3. Household Applications
-
2. Material Type
- 2.1. Cotton
- 2.2. Jute
- 2.3. Silk
- 2.4. Synthetics
- 2.5. Wool
-
3. Process
- 3.1. Woven
- 3.2. Non-woven
GCC Textiles Industry Segmentation By Geography
-
1. North America
- 1.1. United States
- 1.2. Canada
- 1.3. Mexico
-
2. South America
- 2.1. Brazil
- 2.2. Argentina
- 2.3. Rest of South America
-
3. Europe
- 3.1. United Kingdom
- 3.2. Germany
- 3.3. France
- 3.4. Italy
- 3.5. Spain
- 3.6. Russia
- 3.7. Benelux
- 3.8. Nordics
- 3.9. Rest of Europe
-
4. Middle East & Africa
- 4.1. Turkey
- 4.2. Israel
- 4.3. GCC
- 4.4. North Africa
- 4.5. South Africa
- 4.6. Rest of Middle East & Africa
-
5. Asia Pacific
- 5.1. China
- 5.2. India
- 5.3. Japan
- 5.4. South Korea
- 5.5. ASEAN
- 5.6. Oceania
- 5.7. Rest of Asia Pacific
GCC Textiles Industry Regional Market Share
Geographic Coverage of GCC Textiles Industry
GCC Textiles Industry REPORT HIGHLIGHTS
| Aspects | Details |
|---|---|
| Study Period | 2020-2034 |
| Base Year | 2025 |
| Estimated Year | 2026 |
| Forecast Period | 2026-2034 |
| Historical Period | 2020-2025 |
| Growth Rate | CAGR of 6.78% from 2020-2034 |
| Segmentation |
|
Table of Contents
- 1. Introduction
- 1.1. Research Scope
- 1.2. Market Segmentation
- 1.3. Research Objective
- 1.4. Definitions and Assumptions
- 2. Executive Summary
- 2.1. Market Snapshot
- 3. Market Dynamics
- 3.1. Market Drivers
- 3.2. Market Restrains
- 3.3. Market Trends
- 3.4. Market Opportunities
- 4. Market Factor Analysis
- 4.1. Porters Five Forces
- 4.1.1. Bargaining Power of Suppliers
- 4.1.2. Bargaining Power of Buyers
- 4.1.3. Threat of New Entrants
- 4.1.4. Threat of Substitutes
- 4.1.5. Competitive Rivalry
- 4.2. PESTEL analysis
- 4.3. BCG Analysis
- 4.3.1. Stars (High Growth, High Market Share)
- 4.3.2. Cash Cows (Low Growth, High Market Share)
- 4.3.3. Question Mark (High Growth, Low Market Share)
- 4.3.4. Dogs (Low Growth, Low Market Share)
- 4.4. Ansoff Matrix Analysis
- 4.5. Supply Chain Analysis
- 4.6. Regulatory Landscape
- 4.7. Current Market Potential and Opportunity Assessment (TAM–SAM–SOM Framework)
- 4.8. TIR Analyst Note
- 4.1. Porters Five Forces
- 5. Market Analysis, Insights and Forecast 2021-2033
- 5.1. Market Analysis, Insights and Forecast - by Application
- 5.1.1. Clothing
- 5.1.2. Industrial/Technical Applications
- 5.1.3. Household Applications
- 5.2. Market Analysis, Insights and Forecast - by Material Type
- 5.2.1. Cotton
- 5.2.2. Jute
- 5.2.3. Silk
- 5.2.4. Synthetics
- 5.2.5. Wool
- 5.3. Market Analysis, Insights and Forecast - by Process
- 5.3.1. Woven
- 5.3.2. Non-woven
- 5.4. Market Analysis, Insights and Forecast - by Region
- 5.4.1. North America
- 5.4.2. South America
- 5.4.3. Europe
- 5.4.4. Middle East & Africa
- 5.4.5. Asia Pacific
- 5.1. Market Analysis, Insights and Forecast - by Application
- 6. Global GCC Textiles Industry Analysis, Insights and Forecast, 2021-2033
- 6.1. Market Analysis, Insights and Forecast - by Application
- 6.1.1. Clothing
- 6.1.2. Industrial/Technical Applications
- 6.1.3. Household Applications
- 6.2. Market Analysis, Insights and Forecast - by Material Type
- 6.2.1. Cotton
- 6.2.2. Jute
- 6.2.3. Silk
- 6.2.4. Synthetics
- 6.2.5. Wool
- 6.3. Market Analysis, Insights and Forecast - by Process
- 6.3.1. Woven
- 6.3.2. Non-woven
- 6.1. Market Analysis, Insights and Forecast - by Application
- 7. North America GCC Textiles Industry Analysis, Insights and Forecast, 2020-2032
- 7.1. Market Analysis, Insights and Forecast - by Application
- 7.1.1. Clothing
- 7.1.2. Industrial/Technical Applications
- 7.1.3. Household Applications
- 7.2. Market Analysis, Insights and Forecast - by Material Type
- 7.2.1. Cotton
- 7.2.2. Jute
- 7.2.3. Silk
- 7.2.4. Synthetics
- 7.2.5. Wool
- 7.3. Market Analysis, Insights and Forecast - by Process
- 7.3.1. Woven
- 7.3.2. Non-woven
- 7.1. Market Analysis, Insights and Forecast - by Application
- 8. South America GCC Textiles Industry Analysis, Insights and Forecast, 2020-2032
- 8.1. Market Analysis, Insights and Forecast - by Application
- 8.1.1. Clothing
- 8.1.2. Industrial/Technical Applications
- 8.1.3. Household Applications
- 8.2. Market Analysis, Insights and Forecast - by Material Type
- 8.2.1. Cotton
- 8.2.2. Jute
- 8.2.3. Silk
- 8.2.4. Synthetics
- 8.2.5. Wool
- 8.3. Market Analysis, Insights and Forecast - by Process
- 8.3.1. Woven
- 8.3.2. Non-woven
- 8.1. Market Analysis, Insights and Forecast - by Application
- 9. Europe GCC Textiles Industry Analysis, Insights and Forecast, 2020-2032
- 9.1. Market Analysis, Insights and Forecast - by Application
- 9.1.1. Clothing
- 9.1.2. Industrial/Technical Applications
- 9.1.3. Household Applications
- 9.2. Market Analysis, Insights and Forecast - by Material Type
- 9.2.1. Cotton
- 9.2.2. Jute
- 9.2.3. Silk
- 9.2.4. Synthetics
- 9.2.5. Wool
- 9.3. Market Analysis, Insights and Forecast - by Process
- 9.3.1. Woven
- 9.3.2. Non-woven
- 9.1. Market Analysis, Insights and Forecast - by Application
- 10. Middle East & Africa GCC Textiles Industry Analysis, Insights and Forecast, 2020-2032
- 10.1. Market Analysis, Insights and Forecast - by Application
- 10.1.1. Clothing
- 10.1.2. Industrial/Technical Applications
- 10.1.3. Household Applications
- 10.2. Market Analysis, Insights and Forecast - by Material Type
- 10.2.1. Cotton
- 10.2.2. Jute
- 10.2.3. Silk
- 10.2.4. Synthetics
- 10.2.5. Wool
- 10.3. Market Analysis, Insights and Forecast - by Process
- 10.3.1. Woven
- 10.3.2. Non-woven
- 10.1. Market Analysis, Insights and Forecast - by Application
- 11. Asia Pacific GCC Textiles Industry Analysis, Insights and Forecast, 2020-2032
- 11.1. Market Analysis, Insights and Forecast - by Application
- 11.1.1. Clothing
- 11.1.2. Industrial/Technical Applications
- 11.1.3. Household Applications
- 11.2. Market Analysis, Insights and Forecast - by Material Type
- 11.2.1. Cotton
- 11.2.2. Jute
- 11.2.3. Silk
- 11.2.4. Synthetics
- 11.2.5. Wool
- 11.3. Market Analysis, Insights and Forecast - by Process
- 11.3.1. Woven
- 11.3.2. Non-woven
- 11.1. Market Analysis, Insights and Forecast - by Application
- 12. Competitive Analysis
- 12.1. Company Profiles
- 12.1.1 Unirab & Polvara Spinning Weaving & Silk
- 12.1.1.1. Company Overview
- 12.1.1.2. Products
- 12.1.1.3. Company Financials
- 12.1.1.4. SWOT Analysis
- 12.1.2 Misr Amreya
- 12.1.2.1. Company Overview
- 12.1.2.2. Products
- 12.1.2.3. Company Financials
- 12.1.2.4. SWOT Analysis
- 12.1.3 AMCO
- 12.1.3.1. Company Overview
- 12.1.3.2. Products
- 12.1.3.3. Company Financials
- 12.1.3.4. SWOT Analysis
- 12.1.4 Avgol
- 12.1.4.1. Company Overview
- 12.1.4.2. Products
- 12.1.4.3. Company Financials
- 12.1.4.4. SWOT Analysis
- 12.1.5 Millennium Fashions Industries
- 12.1.5.1. Company Overview
- 12.1.5.2. Products
- 12.1.5.3. Company Financials
- 12.1.5.4. SWOT Analysis
- 12.1.6 Embee Group
- 12.1.6.1. Company Overview
- 12.1.6.2. Products
- 12.1.6.3. Company Financials
- 12.1.6.4. SWOT Analysis
- 12.1.7 Kabale
- 12.1.7.1. Company Overview
- 12.1.7.2. Products
- 12.1.7.3. Company Financials
- 12.1.7.4. SWOT Analysis
- 12.1.8 FPC Coated Technical Textiles
- 12.1.8.1. Company Overview
- 12.1.8.2. Products
- 12.1.8.3. Company Financials
- 12.1.8.4. SWOT Analysis
- 12.1.9 Alyaf Industrial Company Ltd
- 12.1.9.1. Company Overview
- 12.1.9.2. Products
- 12.1.9.3. Company Financials
- 12.1.9.4. SWOT Analysis
- 12.1.10 Aratex Group
- 12.1.10.1. Company Overview
- 12.1.10.2. Products
- 12.1.10.3. Company Financials
- 12.1.10.4. SWOT Analysis
- 12.1.11 Lomar Selection
- 12.1.11.1. Company Overview
- 12.1.11.2. Products
- 12.1.11.3. Company Financials
- 12.1.11.4. SWOT Analysis
- 12.1.12 Valleystar Uniforms**List Not Exhaustive
- 12.1.12.1. Company Overview
- 12.1.12.2. Products
- 12.1.12.3. Company Financials
- 12.1.12.4. SWOT Analysis
- 12.1.1 Unirab & Polvara Spinning Weaving & Silk
- 12.2. Market Entropy
- 12.2.1 Company's Key Areas Served
- 12.2.2 Recent Developments
- 12.3. Company Market Share Analysis 2025
- 12.3.1 Top 5 Companies Market Share Analysis
- 12.3.2 Top 3 Companies Market Share Analysis
- 12.4. List of Potential Customers
- 13. Research Methodology
List of Figures
- Figure 1: Global GCC Textiles Industry Revenue Breakdown (Million, %) by Region 2025 & 2033
- Figure 2: Global GCC Textiles Industry Volume Breakdown (Billion, %) by Region 2025 & 2033
- Figure 3: North America GCC Textiles Industry Revenue (Million), by Application 2025 & 2033
- Figure 4: North America GCC Textiles Industry Volume (Billion), by Application 2025 & 2033
- Figure 5: North America GCC Textiles Industry Revenue Share (%), by Application 2025 & 2033
- Figure 6: North America GCC Textiles Industry Volume Share (%), by Application 2025 & 2033
- Figure 7: North America GCC Textiles Industry Revenue (Million), by Material Type 2025 & 2033
- Figure 8: North America GCC Textiles Industry Volume (Billion), by Material Type 2025 & 2033
- Figure 9: North America GCC Textiles Industry Revenue Share (%), by Material Type 2025 & 2033
- Figure 10: North America GCC Textiles Industry Volume Share (%), by Material Type 2025 & 2033
- Figure 11: North America GCC Textiles Industry Revenue (Million), by Process 2025 & 2033
- Figure 12: North America GCC Textiles Industry Volume (Billion), by Process 2025 & 2033
- Figure 13: North America GCC Textiles Industry Revenue Share (%), by Process 2025 & 2033
- Figure 14: North America GCC Textiles Industry Volume Share (%), by Process 2025 & 2033
- Figure 15: North America GCC Textiles Industry Revenue (Million), by Country 2025 & 2033
- Figure 16: North America GCC Textiles Industry Volume (Billion), by Country 2025 & 2033
- Figure 17: North America GCC Textiles Industry Revenue Share (%), by Country 2025 & 2033
- Figure 18: North America GCC Textiles Industry Volume Share (%), by Country 2025 & 2033
- Figure 19: South America GCC Textiles Industry Revenue (Million), by Application 2025 & 2033
- Figure 20: South America GCC Textiles Industry Volume (Billion), by Application 2025 & 2033
- Figure 21: South America GCC Textiles Industry Revenue Share (%), by Application 2025 & 2033
- Figure 22: South America GCC Textiles Industry Volume Share (%), by Application 2025 & 2033
- Figure 23: South America GCC Textiles Industry Revenue (Million), by Material Type 2025 & 2033
- Figure 24: South America GCC Textiles Industry Volume (Billion), by Material Type 2025 & 2033
- Figure 25: South America GCC Textiles Industry Revenue Share (%), by Material Type 2025 & 2033
- Figure 26: South America GCC Textiles Industry Volume Share (%), by Material Type 2025 & 2033
- Figure 27: South America GCC Textiles Industry Revenue (Million), by Process 2025 & 2033
- Figure 28: South America GCC Textiles Industry Volume (Billion), by Process 2025 & 2033
- Figure 29: South America GCC Textiles Industry Revenue Share (%), by Process 2025 & 2033
- Figure 30: South America GCC Textiles Industry Volume Share (%), by Process 2025 & 2033
- Figure 31: South America GCC Textiles Industry Revenue (Million), by Country 2025 & 2033
- Figure 32: South America GCC Textiles Industry Volume (Billion), by Country 2025 & 2033
- Figure 33: South America GCC Textiles Industry Revenue Share (%), by Country 2025 & 2033
- Figure 34: South America GCC Textiles Industry Volume Share (%), by Country 2025 & 2033
- Figure 35: Europe GCC Textiles Industry Revenue (Million), by Application 2025 & 2033
- Figure 36: Europe GCC Textiles Industry Volume (Billion), by Application 2025 & 2033
- Figure 37: Europe GCC Textiles Industry Revenue Share (%), by Application 2025 & 2033
- Figure 38: Europe GCC Textiles Industry Volume Share (%), by Application 2025 & 2033
- Figure 39: Europe GCC Textiles Industry Revenue (Million), by Material Type 2025 & 2033
- Figure 40: Europe GCC Textiles Industry Volume (Billion), by Material Type 2025 & 2033
- Figure 41: Europe GCC Textiles Industry Revenue Share (%), by Material Type 2025 & 2033
- Figure 42: Europe GCC Textiles Industry Volume Share (%), by Material Type 2025 & 2033
- Figure 43: Europe GCC Textiles Industry Revenue (Million), by Process 2025 & 2033
- Figure 44: Europe GCC Textiles Industry Volume (Billion), by Process 2025 & 2033
- Figure 45: Europe GCC Textiles Industry Revenue Share (%), by Process 2025 & 2033
- Figure 46: Europe GCC Textiles Industry Volume Share (%), by Process 2025 & 2033
- Figure 47: Europe GCC Textiles Industry Revenue (Million), by Country 2025 & 2033
- Figure 48: Europe GCC Textiles Industry Volume (Billion), by Country 2025 & 2033
- Figure 49: Europe GCC Textiles Industry Revenue Share (%), by Country 2025 & 2033
- Figure 50: Europe GCC Textiles Industry Volume Share (%), by Country 2025 & 2033
- Figure 51: Middle East & Africa GCC Textiles Industry Revenue (Million), by Application 2025 & 2033
- Figure 52: Middle East & Africa GCC Textiles Industry Volume (Billion), by Application 2025 & 2033
- Figure 53: Middle East & Africa GCC Textiles Industry Revenue Share (%), by Application 2025 & 2033
- Figure 54: Middle East & Africa GCC Textiles Industry Volume Share (%), by Application 2025 & 2033
- Figure 55: Middle East & Africa GCC Textiles Industry Revenue (Million), by Material Type 2025 & 2033
- Figure 56: Middle East & Africa GCC Textiles Industry Volume (Billion), by Material Type 2025 & 2033
- Figure 57: Middle East & Africa GCC Textiles Industry Revenue Share (%), by Material Type 2025 & 2033
- Figure 58: Middle East & Africa GCC Textiles Industry Volume Share (%), by Material Type 2025 & 2033
- Figure 59: Middle East & Africa GCC Textiles Industry Revenue (Million), by Process 2025 & 2033
- Figure 60: Middle East & Africa GCC Textiles Industry Volume (Billion), by Process 2025 & 2033
- Figure 61: Middle East & Africa GCC Textiles Industry Revenue Share (%), by Process 2025 & 2033
- Figure 62: Middle East & Africa GCC Textiles Industry Volume Share (%), by Process 2025 & 2033
- Figure 63: Middle East & Africa GCC Textiles Industry Revenue (Million), by Country 2025 & 2033
- Figure 64: Middle East & Africa GCC Textiles Industry Volume (Billion), by Country 2025 & 2033
- Figure 65: Middle East & Africa GCC Textiles Industry Revenue Share (%), by Country 2025 & 2033
- Figure 66: Middle East & Africa GCC Textiles Industry Volume Share (%), by Country 2025 & 2033
- Figure 67: Asia Pacific GCC Textiles Industry Revenue (Million), by Application 2025 & 2033
- Figure 68: Asia Pacific GCC Textiles Industry Volume (Billion), by Application 2025 & 2033
- Figure 69: Asia Pacific GCC Textiles Industry Revenue Share (%), by Application 2025 & 2033
- Figure 70: Asia Pacific GCC Textiles Industry Volume Share (%), by Application 2025 & 2033
- Figure 71: Asia Pacific GCC Textiles Industry Revenue (Million), by Material Type 2025 & 2033
- Figure 72: Asia Pacific GCC Textiles Industry Volume (Billion), by Material Type 2025 & 2033
- Figure 73: Asia Pacific GCC Textiles Industry Revenue Share (%), by Material Type 2025 & 2033
- Figure 74: Asia Pacific GCC Textiles Industry Volume Share (%), by Material Type 2025 & 2033
- Figure 75: Asia Pacific GCC Textiles Industry Revenue (Million), by Process 2025 & 2033
- Figure 76: Asia Pacific GCC Textiles Industry Volume (Billion), by Process 2025 & 2033
- Figure 77: Asia Pacific GCC Textiles Industry Revenue Share (%), by Process 2025 & 2033
- Figure 78: Asia Pacific GCC Textiles Industry Volume Share (%), by Process 2025 & 2033
- Figure 79: Asia Pacific GCC Textiles Industry Revenue (Million), by Country 2025 & 2033
- Figure 80: Asia Pacific GCC Textiles Industry Volume (Billion), by Country 2025 & 2033
- Figure 81: Asia Pacific GCC Textiles Industry Revenue Share (%), by Country 2025 & 2033
- Figure 82: Asia Pacific GCC Textiles Industry Volume Share (%), by Country 2025 & 2033
List of Tables
- Table 1: Global GCC Textiles Industry Revenue Million Forecast, by Application 2020 & 2033
- Table 2: Global GCC Textiles Industry Volume Billion Forecast, by Application 2020 & 2033
- Table 3: Global GCC Textiles Industry Revenue Million Forecast, by Material Type 2020 & 2033
- Table 4: Global GCC Textiles Industry Volume Billion Forecast, by Material Type 2020 & 2033
- Table 5: Global GCC Textiles Industry Revenue Million Forecast, by Process 2020 & 2033
- Table 6: Global GCC Textiles Industry Volume Billion Forecast, by Process 2020 & 2033
- Table 7: Global GCC Textiles Industry Revenue Million Forecast, by Region 2020 & 2033
- Table 8: Global GCC Textiles Industry Volume Billion Forecast, by Region 2020 & 2033
- Table 9: Global GCC Textiles Industry Revenue Million Forecast, by Application 2020 & 2033
- Table 10: Global GCC Textiles Industry Volume Billion Forecast, by Application 2020 & 2033
- Table 11: Global GCC Textiles Industry Revenue Million Forecast, by Material Type 2020 & 2033
- Table 12: Global GCC Textiles Industry Volume Billion Forecast, by Material Type 2020 & 2033
- Table 13: Global GCC Textiles Industry Revenue Million Forecast, by Process 2020 & 2033
- Table 14: Global GCC Textiles Industry Volume Billion Forecast, by Process 2020 & 2033
- Table 15: Global GCC Textiles Industry Revenue Million Forecast, by Country 2020 & 2033
- Table 16: Global GCC Textiles Industry Volume Billion Forecast, by Country 2020 & 2033
- Table 17: United States GCC Textiles Industry Revenue (Million) Forecast, by Application 2020 & 2033
- Table 18: United States GCC Textiles Industry Volume (Billion) Forecast, by Application 2020 & 2033
- Table 19: Canada GCC Textiles Industry Revenue (Million) Forecast, by Application 2020 & 2033
- Table 20: Canada GCC Textiles Industry Volume (Billion) Forecast, by Application 2020 & 2033
- Table 21: Mexico GCC Textiles Industry Revenue (Million) Forecast, by Application 2020 & 2033
- Table 22: Mexico GCC Textiles Industry Volume (Billion) Forecast, by Application 2020 & 2033
- Table 23: Global GCC Textiles Industry Revenue Million Forecast, by Application 2020 & 2033
- Table 24: Global GCC Textiles Industry Volume Billion Forecast, by Application 2020 & 2033
- Table 25: Global GCC Textiles Industry Revenue Million Forecast, by Material Type 2020 & 2033
- Table 26: Global GCC Textiles Industry Volume Billion Forecast, by Material Type 2020 & 2033
- Table 27: Global GCC Textiles Industry Revenue Million Forecast, by Process 2020 & 2033
- Table 28: Global GCC Textiles Industry Volume Billion Forecast, by Process 2020 & 2033
- Table 29: Global GCC Textiles Industry Revenue Million Forecast, by Country 2020 & 2033
- Table 30: Global GCC Textiles Industry Volume Billion Forecast, by Country 2020 & 2033
- Table 31: Brazil GCC Textiles Industry Revenue (Million) Forecast, by Application 2020 & 2033
- Table 32: Brazil GCC Textiles Industry Volume (Billion) Forecast, by Application 2020 & 2033
- Table 33: Argentina GCC Textiles Industry Revenue (Million) Forecast, by Application 2020 & 2033
- Table 34: Argentina GCC Textiles Industry Volume (Billion) Forecast, by Application 2020 & 2033
- Table 35: Rest of South America GCC Textiles Industry Revenue (Million) Forecast, by Application 2020 & 2033
- Table 36: Rest of South America GCC Textiles Industry Volume (Billion) Forecast, by Application 2020 & 2033
- Table 37: Global GCC Textiles Industry Revenue Million Forecast, by Application 2020 & 2033
- Table 38: Global GCC Textiles Industry Volume Billion Forecast, by Application 2020 & 2033
- Table 39: Global GCC Textiles Industry Revenue Million Forecast, by Material Type 2020 & 2033
- Table 40: Global GCC Textiles Industry Volume Billion Forecast, by Material Type 2020 & 2033
- Table 41: Global GCC Textiles Industry Revenue Million Forecast, by Process 2020 & 2033
- Table 42: Global GCC Textiles Industry Volume Billion Forecast, by Process 2020 & 2033
- Table 43: Global GCC Textiles Industry Revenue Million Forecast, by Country 2020 & 2033
- Table 44: Global GCC Textiles Industry Volume Billion Forecast, by Country 2020 & 2033
- Table 45: United Kingdom GCC Textiles Industry Revenue (Million) Forecast, by Application 2020 & 2033
- Table 46: United Kingdom GCC Textiles Industry Volume (Billion) Forecast, by Application 2020 & 2033
- Table 47: Germany GCC Textiles Industry Revenue (Million) Forecast, by Application 2020 & 2033
- Table 48: Germany GCC Textiles Industry Volume (Billion) Forecast, by Application 2020 & 2033
- Table 49: France GCC Textiles Industry Revenue (Million) Forecast, by Application 2020 & 2033
- Table 50: France GCC Textiles Industry Volume (Billion) Forecast, by Application 2020 & 2033
- Table 51: Italy GCC Textiles Industry Revenue (Million) Forecast, by Application 2020 & 2033
- Table 52: Italy GCC Textiles Industry Volume (Billion) Forecast, by Application 2020 & 2033
- Table 53: Spain GCC Textiles Industry Revenue (Million) Forecast, by Application 2020 & 2033
- Table 54: Spain GCC Textiles Industry Volume (Billion) Forecast, by Application 2020 & 2033
- Table 55: Russia GCC Textiles Industry Revenue (Million) Forecast, by Application 2020 & 2033
- Table 56: Russia GCC Textiles Industry Volume (Billion) Forecast, by Application 2020 & 2033
- Table 57: Benelux GCC Textiles Industry Revenue (Million) Forecast, by Application 2020 & 2033
- Table 58: Benelux GCC Textiles Industry Volume (Billion) Forecast, by Application 2020 & 2033
- Table 59: Nordics GCC Textiles Industry Revenue (Million) Forecast, by Application 2020 & 2033
- Table 60: Nordics GCC Textiles Industry Volume (Billion) Forecast, by Application 2020 & 2033
- Table 61: Rest of Europe GCC Textiles Industry Revenue (Million) Forecast, by Application 2020 & 2033
- Table 62: Rest of Europe GCC Textiles Industry Volume (Billion) Forecast, by Application 2020 & 2033
- Table 63: Global GCC Textiles Industry Revenue Million Forecast, by Application 2020 & 2033
- Table 64: Global GCC Textiles Industry Volume Billion Forecast, by Application 2020 & 2033
- Table 65: Global GCC Textiles Industry Revenue Million Forecast, by Material Type 2020 & 2033
- Table 66: Global GCC Textiles Industry Volume Billion Forecast, by Material Type 2020 & 2033
- Table 67: Global GCC Textiles Industry Revenue Million Forecast, by Process 2020 & 2033
- Table 68: Global GCC Textiles Industry Volume Billion Forecast, by Process 2020 & 2033
- Table 69: Global GCC Textiles Industry Revenue Million Forecast, by Country 2020 & 2033
- Table 70: Global GCC Textiles Industry Volume Billion Forecast, by Country 2020 & 2033
- Table 71: Turkey GCC Textiles Industry Revenue (Million) Forecast, by Application 2020 & 2033
- Table 72: Turkey GCC Textiles Industry Volume (Billion) Forecast, by Application 2020 & 2033
- Table 73: Israel GCC Textiles Industry Revenue (Million) Forecast, by Application 2020 & 2033
- Table 74: Israel GCC Textiles Industry Volume (Billion) Forecast, by Application 2020 & 2033
- Table 75: GCC GCC Textiles Industry Revenue (Million) Forecast, by Application 2020 & 2033
- Table 76: GCC GCC Textiles Industry Volume (Billion) Forecast, by Application 2020 & 2033
- Table 77: North Africa GCC Textiles Industry Revenue (Million) Forecast, by Application 2020 & 2033
- Table 78: North Africa GCC Textiles Industry Volume (Billion) Forecast, by Application 2020 & 2033
- Table 79: South Africa GCC Textiles Industry Revenue (Million) Forecast, by Application 2020 & 2033
- Table 80: South Africa GCC Textiles Industry Volume (Billion) Forecast, by Application 2020 & 2033
- Table 81: Rest of Middle East & Africa GCC Textiles Industry Revenue (Million) Forecast, by Application 2020 & 2033
- Table 82: Rest of Middle East & Africa GCC Textiles Industry Volume (Billion) Forecast, by Application 2020 & 2033
- Table 83: Global GCC Textiles Industry Revenue Million Forecast, by Application 2020 & 2033
- Table 84: Global GCC Textiles Industry Volume Billion Forecast, by Application 2020 & 2033
- Table 85: Global GCC Textiles Industry Revenue Million Forecast, by Material Type 2020 & 2033
- Table 86: Global GCC Textiles Industry Volume Billion Forecast, by Material Type 2020 & 2033
- Table 87: Global GCC Textiles Industry Revenue Million Forecast, by Process 2020 & 2033
- Table 88: Global GCC Textiles Industry Volume Billion Forecast, by Process 2020 & 2033
- Table 89: Global GCC Textiles Industry Revenue Million Forecast, by Country 2020 & 2033
- Table 90: Global GCC Textiles Industry Volume Billion Forecast, by Country 2020 & 2033
- Table 91: China GCC Textiles Industry Revenue (Million) Forecast, by Application 2020 & 2033
- Table 92: China GCC Textiles Industry Volume (Billion) Forecast, by Application 2020 & 2033
- Table 93: India GCC Textiles Industry Revenue (Million) Forecast, by Application 2020 & 2033
- Table 94: India GCC Textiles Industry Volume (Billion) Forecast, by Application 2020 & 2033
- Table 95: Japan GCC Textiles Industry Revenue (Million) Forecast, by Application 2020 & 2033
- Table 96: Japan GCC Textiles Industry Volume (Billion) Forecast, by Application 2020 & 2033
- Table 97: South Korea GCC Textiles Industry Revenue (Million) Forecast, by Application 2020 & 2033
- Table 98: South Korea GCC Textiles Industry Volume (Billion) Forecast, by Application 2020 & 2033
- Table 99: ASEAN GCC Textiles Industry Revenue (Million) Forecast, by Application 2020 & 2033
- Table 100: ASEAN GCC Textiles Industry Volume (Billion) Forecast, by Application 2020 & 2033
- Table 101: Oceania GCC Textiles Industry Revenue (Million) Forecast, by Application 2020 & 2033
- Table 102: Oceania GCC Textiles Industry Volume (Billion) Forecast, by Application 2020 & 2033
- Table 103: Rest of Asia Pacific GCC Textiles Industry Revenue (Million) Forecast, by Application 2020 & 2033
- Table 104: Rest of Asia Pacific GCC Textiles Industry Volume (Billion) Forecast, by Application 2020 & 2033
Frequently Asked Questions
1. What is the projected Compound Annual Growth Rate (CAGR) of the GCC Textiles Industry?
The projected CAGR is approximately 6.78%.
2. Which companies are prominent players in the GCC Textiles Industry?
Key companies in the market include Unirab & Polvara Spinning Weaving & Silk, Misr Amreya, AMCO, Avgol, Millennium Fashions Industries, Embee Group, Kabale, FPC Coated Technical Textiles, Alyaf Industrial Company Ltd, Aratex Group, Lomar Selection, Valleystar Uniforms**List Not Exhaustive.
3. What are the main segments of the GCC Textiles Industry?
The market segments include Application, Material Type, Process.
4. Can you provide details about the market size?
The market size is estimated to be USD 15.08 Million as of 2022.
5. What are some drivers contributing to market growth?
3.; Growing fashion consciousness3.; Export Opportunities.
6. What are the notable trends driving market growth?
Rising Textile and Apparels Demand in UAE.
7. Are there any restraints impacting market growth?
3.; Growing fashion consciousness3.; Export Opportunities.
8. Can you provide examples of recent developments in the market?
Febuary 2023, Saudi’s MODON announces USD 1.1bn textile investments. These investments are distributed over 125 industrial contracts in 19 industrial cities, covering a total area of more than one million square meters. According to Al-Argoubi, the textiles and men’s supplies sector is experiencing high growth in the Kingdom.
9. What pricing options are available for accessing the report?
Pricing options include single-user, multi-user, and enterprise licenses priced at USD 3800, USD 4500, and USD 5800 respectively.
10. Is the market size provided in terms of value or volume?
The market size is provided in terms of value, measured in Million and volume, measured in Billion.
11. Are there any specific market keywords associated with the report?
Yes, the market keyword associated with the report is "GCC Textiles Industry," which aids in identifying and referencing the specific market segment covered.
12. How do I determine which pricing option suits my needs best?
The pricing options vary based on user requirements and access needs. Individual users may opt for single-user licenses, while businesses requiring broader access may choose multi-user or enterprise licenses for cost-effective access to the report.
13. Are there any additional resources or data provided in the GCC Textiles Industry report?
While the report offers comprehensive insights, it's advisable to review the specific contents or supplementary materials provided to ascertain if additional resources or data are available.
14. How can I stay updated on further developments or reports in the GCC Textiles Industry?
To stay informed about further developments, trends, and reports in the GCC Textiles Industry, consider subscribing to industry newsletters, following relevant companies and organizations, or regularly checking reputable industry news sources and publications.
Methodology
Step 1 - Identification of Relevant Samples Size from Population Database


Step 2 - Approaches for Defining Global Market Size (Value, Volume* & Price*)

Note*: In applicable scenarios
Step 3 - Data Sources
Primary Research
- Web Analytics
- Survey Reports
- Research Institute
- Latest Research Reports
- Opinion Leaders
Secondary Research
- Annual Reports
- White Paper
- Latest Press Release
- Industry Association
- Paid Database
- Investor Presentations

Step 4 - Data Triangulation
Involves using different sources of information in order to increase the validity of a study
These sources are likely to be stakeholders in a program - participants, other researchers, program staff, other community members, and so on.
Then we put all data in single framework & apply various statistical tools to find out the dynamic on the market.
During the analysis stage, feedback from the stakeholder groups would be compared to determine areas of agreement as well as areas of divergence