

Key Insights
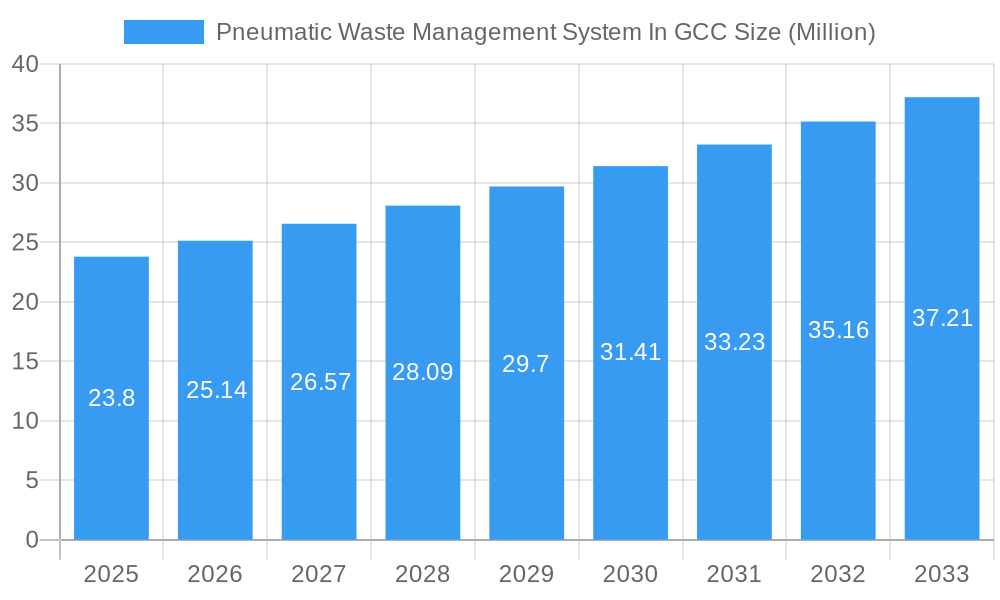
The Pneumatic Waste Management System (PWMS) market in the Gulf Cooperation Council (GCC) is experiencing robust growth, projected to reach $23.80 million in 2025 and maintain a Compound Annual Growth Rate (CAGR) of 5.47% from 2025 to 2033. This expansion is driven by several factors. Increasing urbanization across the GCC nations leads to higher waste generation, demanding efficient and hygienic waste collection solutions. Furthermore, government initiatives promoting smart city development and sustainable waste management practices are creating a favorable environment for PWMS adoption. The inherent advantages of PWMS, such as reduced labor costs, improved hygiene, and minimized environmental impact compared to traditional methods, are key drivers. While challenges remain, such as the high initial investment cost for infrastructure and potential technical complexities, the long-term benefits are proving increasingly attractive to municipalities and private sector operators. Key players like Marimatic, ENVAC, and URD are actively shaping the market through innovation and expansion strategies, catering to the growing demand for advanced waste management solutions. The segmentation of the market likely includes system types (e.g., central vs. decentralized), application (residential, commercial, industrial), and service models (e.g., public-private partnerships).
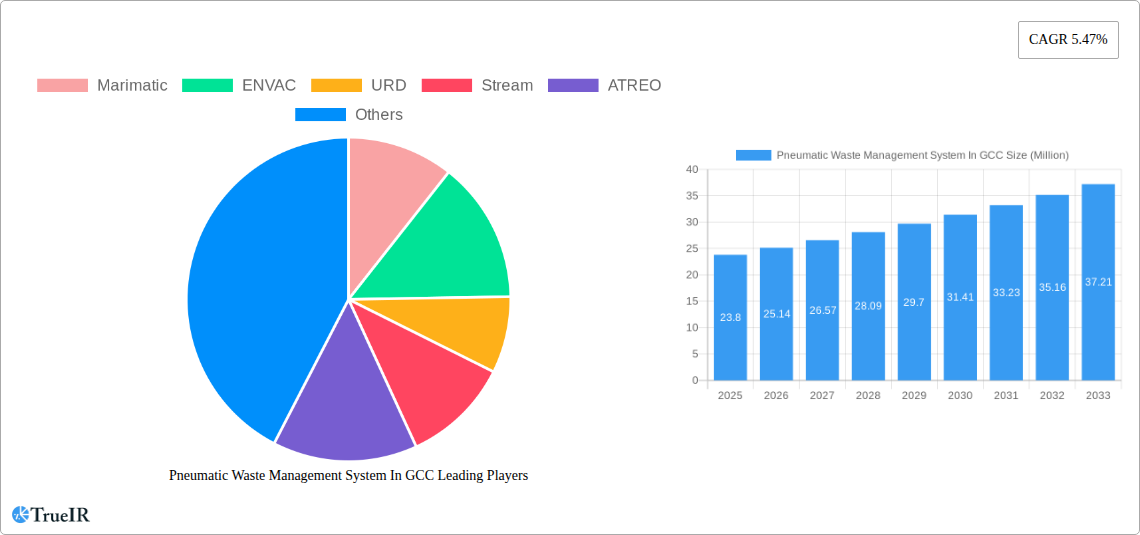
Pneumatic Waste Management System In GCC Market Size (In Million)
The market's future growth trajectory hinges on continued investment in infrastructure projects and sustained government support for green initiatives. Technological advancements leading to improved system efficiency and reduced operating costs will also play a significant role. Competition among established players and new entrants is likely to intensify, driving innovation and potentially leading to more affordable and accessible solutions for a wider range of applications. While specific regional data is unavailable, a reasonable assumption given the overall GCC development would suggest a higher concentration of PWMS installations in densely populated urban centers such as Dubai, Riyadh, and Doha. The market is anticipated to witness a further expansion in the coming years, driven by factors previously mentioned and a gradual shift toward sustainable solutions across all sectors within the GCC region.
Pneumatic Waste Management System In GCC Company Market Share
Pneumatic Waste Management System in GCC: A Comprehensive Market Report (2019-2033)
This dynamic report provides a comprehensive analysis of the Pneumatic Waste Management System market in the Gulf Cooperation Council (GCC) region, offering invaluable insights for businesses, investors, and policymakers. The study period spans from 2019 to 2033, with 2025 serving as both the base and estimated year. The forecast period is 2025-2033, while the historical period covers 2019-2024. This report leverages extensive data analysis to uncover key trends, opportunities, and challenges within this rapidly evolving market, valued at $XX Million in 2025 and projected to reach $XX Million by 2033.
Pneumatic Waste Management System In GCC Market Structure & Competitive Landscape
The GCC pneumatic waste management system market exhibits a moderately concentrated structure, with several key players vying for market share. The Herfindahl-Hirschman Index (HHI) for 2025 is estimated at xx, indicating a moderately competitive landscape. Innovation is a significant driver, with companies continually developing more efficient and sustainable pneumatic waste collection and disposal systems. Stringent environmental regulations within the GCC are pushing the adoption of eco-friendly solutions, while the increasing urbanization and rising waste generation rates fuel market growth. Product substitutes, such as traditional waste collection methods, face increasing pressure due to the efficiency and hygiene advantages of pneumatic systems.
End-user segmentation is primarily driven by municipal corporations, commercial establishments, and industrial facilities. The market has witnessed a moderate level of mergers and acquisitions (M&A) activity in recent years, with approximately xx M&A deals recorded between 2019 and 2024, totaling an estimated value of $xx Million. This consolidation trend is expected to continue as larger players seek to expand their market reach and consolidate their technological advantages.
- Market Concentration: Moderately concentrated, HHI estimated at xx in 2025.
- Innovation Drivers: Development of efficient, sustainable systems, technological advancements in waste sorting and processing.
- Regulatory Impacts: Stringent environmental regulations driving adoption of eco-friendly solutions.
- Product Substitutes: Traditional waste collection methods facing increasing competition.
- End-User Segmentation: Municipal corporations, commercial, and industrial facilities.
- M&A Trends: Moderate activity, xx deals between 2019-2024, totaling $xx Million.
Pneumatic Waste Management System In GCC Market Trends & Opportunities
The GCC pneumatic waste management system market is experiencing robust growth, driven by several factors. The market size is projected to witness a Compound Annual Growth Rate (CAGR) of xx% from 2025 to 2033, exceeding $XX Million by the end of the forecast period. Technological advancements are leading to more sophisticated systems with improved efficiency, reduced energy consumption, and enhanced waste sorting capabilities. Growing consumer awareness of environmental sustainability and hygiene is also a major factor. Competitive dynamics are shaping the market, with leading players investing heavily in R&D and strategic partnerships to gain a competitive edge. Market penetration rates are expected to increase significantly, particularly in rapidly urbanizing areas. The increasing adoption of smart city initiatives and the growing emphasis on waste-to-energy projects present significant opportunities for market expansion.
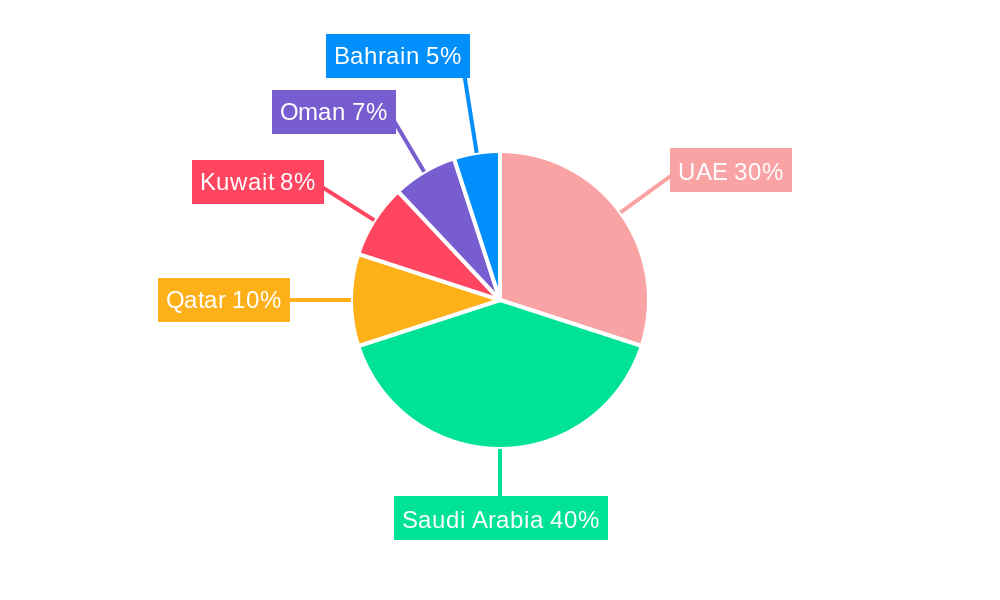
Dominant Markets & Segments in Pneumatic Waste Management System In GCC
The UAE and Saudi Arabia currently dominate the GCC pneumatic waste management system market, driven by high population density, robust infrastructure development, and supportive government policies. These countries have implemented ambitious waste management strategies, including investments in advanced technologies to improve efficiency and reduce environmental impact. Other GCC countries are witnessing increasing adoption rates.
Key Growth Drivers in the UAE and Saudi Arabia:
- Significant investments in infrastructure projects
- Stringent environmental regulations and waste management policies
- High population density and growing waste generation rates
- Government initiatives promoting sustainable waste management practices.
Market Dominance Analysis: The UAE and Saudi Arabia lead due to their substantial investments in infrastructure and progressive environmental policies. This has created a favorable environment for the adoption of advanced waste management systems, including pneumatic systems. The other GCC countries are experiencing gradually increasing adoption rates, though at a slower pace compared to the leading markets.
Pneumatic Waste Management System In GCC Product Analysis
The GCC market showcases a range of pneumatic waste management systems, from small-scale residential units to large-scale industrial solutions. Technological advancements focus on improving efficiency, automation, and integration with smart city initiatives. The key competitive advantages lie in system reliability, operational efficiency, reduced environmental impact, and ease of integration with existing infrastructure. Many systems are now equipped with advanced monitoring and control capabilities for enhanced performance and reduced operational costs.
Key Drivers, Barriers & Challenges in Pneumatic Waste Management System In GCC
Key Drivers:
- Government regulations: Stringent environmental regulations are pushing adoption of eco-friendly systems.
- Infrastructure development: Growing urbanization and infrastructural projects create demand for efficient waste management solutions.
- Technological advancements: Improved system efficiency, automation, and smart city integration drive adoption.
Challenges:
- High initial investment costs: Implementation of pneumatic systems requires significant upfront capital expenditure.
- Maintenance and operational costs: Ongoing maintenance and operational costs can be substantial.
- Integration with existing infrastructure: Integrating pneumatic systems into existing waste management infrastructure can be complex and challenging. This can often lead to unforeseen delays and increased project costs. The estimate for integration-related delays averages at around xx% of project timelines.
Growth Drivers in the Pneumatic Waste Management System In GCC Market
The GCC pneumatic waste management market's growth is driven by government initiatives promoting sustainable waste management practices, increasing urbanization leading to higher waste generation, technological advancements leading to more efficient and cost-effective systems, and rising environmental awareness among consumers and businesses.
Challenges Impacting Pneumatic Waste Management System In GCC Growth
High initial investment costs, complex integration with existing infrastructure, the need for skilled labor for operation and maintenance, and potential disruptions from unexpected maintenance requirements all present challenges to the market's growth. The high reliance on imported components can also increase vulnerability to supply chain disruptions.
Key Players Shaping the Pneumatic Waste Management System In GCC Market
- Marimatic
- ENVAC
- URD
- Stream
- ATREO
- Ros Roca envirotec
- Peakway Environmental Sci & Tech Co Ltd
- Aerbin ApS
- Urban Refuse Development
- Logiwaste AB
- 73 Other Companies
Significant Pneumatic Waste Management System In GCC Industry Milestones
- August 2023: Akam (SIRC Group subsidiary) partnered with Alawalya Qatar to improve demolition and construction waste sorting, focusing on recycled materials for fertilization and road paving, impacting Qatari standards.
- May 2023: EnviroServe opened a new facility in Richmond, Virginia, expanding its North American operations. While not directly in the GCC, this signifies the growing global interest in efficient waste management solutions, indirectly impacting the competitive landscape in the GCC.
Future Outlook for Pneumatic Waste Management System In GCC Market
The GCC pneumatic waste management system market is poised for continued growth, driven by sustained urbanization, supportive government policies, and technological innovations. Strategic partnerships, investments in R&D, and expansion into new segments will play key roles in shaping the market's future. The market presents significant opportunities for companies to capitalize on the growing demand for efficient and sustainable waste management solutions in the region.
Pneumatic Waste Management System In GCC Segmentation
-
1. End User
- 1.1. Residential
- 1.2. Commercial
- 1.3. Industrial
- 1.4. Other End Users
Pneumatic Waste Management System In GCC Segmentation By Geography
-
1. North America
- 1.1. United States
- 1.2. Canada
- 1.3. Mexico
-
2. South America
- 2.1. Brazil
- 2.2. Argentina
- 2.3. Rest of South America
-
3. Europe
- 3.1. United Kingdom
- 3.2. Germany
- 3.3. France
- 3.4. Italy
- 3.5. Spain
- 3.6. Russia
- 3.7. Benelux
- 3.8. Nordics
- 3.9. Rest of Europe
-
4. Middle East & Africa
- 4.1. Turkey
- 4.2. Israel
- 4.3. GCC
- 4.4. North Africa
- 4.5. South Africa
- 4.6. Rest of Middle East & Africa
-
5. Asia Pacific
- 5.1. China
- 5.2. India
- 5.3. Japan
- 5.4. South Korea
- 5.5. ASEAN
- 5.6. Oceania
- 5.7. Rest of Asia Pacific
Pneumatic Waste Management System In GCC Regional Market Share
Geographic Coverage of Pneumatic Waste Management System In GCC
Pneumatic Waste Management System In GCC REPORT HIGHLIGHTS
| Aspects | Details |
|---|---|
| Study Period | 2020-2034 |
| Base Year | 2025 |
| Estimated Year | 2026 |
| Forecast Period | 2026-2034 |
| Historical Period | 2020-2025 |
| Growth Rate | CAGR of 5.47% from 2020-2034 |
| Segmentation |
|
Table of Contents
- 1. Introduction
- 1.1. Research Scope
- 1.2. Market Segmentation
- 1.3. Research Objective
- 1.4. Definitions and Assumptions
- 2. Executive Summary
- 2.1. Market Snapshot
- 3. Market Dynamics
- 3.1. Market Drivers
- 3.2. Market Restrains
- 3.3. Market Trends
- 3.4. Market Opportunities
- 4. Market Factor Analysis
- 4.1. Porters Five Forces
- 4.1.1. Bargaining Power of Suppliers
- 4.1.2. Bargaining Power of Buyers
- 4.1.3. Threat of New Entrants
- 4.1.4. Threat of Substitutes
- 4.1.5. Competitive Rivalry
- 4.2. PESTEL analysis
- 4.3. BCG Analysis
- 4.3.1. Stars (High Growth, High Market Share)
- 4.3.2. Cash Cows (Low Growth, High Market Share)
- 4.3.3. Question Mark (High Growth, Low Market Share)
- 4.3.4. Dogs (Low Growth, Low Market Share)
- 4.4. Ansoff Matrix Analysis
- 4.5. Supply Chain Analysis
- 4.6. Regulatory Landscape
- 4.7. Current Market Potential and Opportunity Assessment (TAM–SAM–SOM Framework)
- 4.8. TIR Analyst Note
- 4.1. Porters Five Forces
- 5. Market Analysis, Insights and Forecast 2021-2033
- 5.1. Market Analysis, Insights and Forecast - by End User
- 5.1.1. Residential
- 5.1.2. Commercial
- 5.1.3. Industrial
- 5.1.4. Other End Users
- 5.2. Market Analysis, Insights and Forecast - by Region
- 5.2.1. North America
- 5.2.2. South America
- 5.2.3. Europe
- 5.2.4. Middle East & Africa
- 5.2.5. Asia Pacific
- 5.1. Market Analysis, Insights and Forecast - by End User
- 6. Global Pneumatic Waste Management System In GCC Analysis, Insights and Forecast, 2021-2033
- 6.1. Market Analysis, Insights and Forecast - by End User
- 6.1.1. Residential
- 6.1.2. Commercial
- 6.1.3. Industrial
- 6.1.4. Other End Users
- 6.1. Market Analysis, Insights and Forecast - by End User
- 7. North America Pneumatic Waste Management System In GCC Analysis, Insights and Forecast, 2020-2032
- 7.1. Market Analysis, Insights and Forecast - by End User
- 7.1.1. Residential
- 7.1.2. Commercial
- 7.1.3. Industrial
- 7.1.4. Other End Users
- 7.1. Market Analysis, Insights and Forecast - by End User
- 8. South America Pneumatic Waste Management System In GCC Analysis, Insights and Forecast, 2020-2032
- 8.1. Market Analysis, Insights and Forecast - by End User
- 8.1.1. Residential
- 8.1.2. Commercial
- 8.1.3. Industrial
- 8.1.4. Other End Users
- 8.1. Market Analysis, Insights and Forecast - by End User
- 9. Europe Pneumatic Waste Management System In GCC Analysis, Insights and Forecast, 2020-2032
- 9.1. Market Analysis, Insights and Forecast - by End User
- 9.1.1. Residential
- 9.1.2. Commercial
- 9.1.3. Industrial
- 9.1.4. Other End Users
- 9.1. Market Analysis, Insights and Forecast - by End User
- 10. Middle East & Africa Pneumatic Waste Management System In GCC Analysis, Insights and Forecast, 2020-2032
- 10.1. Market Analysis, Insights and Forecast - by End User
- 10.1.1. Residential
- 10.1.2. Commercial
- 10.1.3. Industrial
- 10.1.4. Other End Users
- 10.1. Market Analysis, Insights and Forecast - by End User
- 11. Asia Pacific Pneumatic Waste Management System In GCC Analysis, Insights and Forecast, 2020-2032
- 11.1. Market Analysis, Insights and Forecast - by End User
- 11.1.1. Residential
- 11.1.2. Commercial
- 11.1.3. Industrial
- 11.1.4. Other End Users
- 11.1. Market Analysis, Insights and Forecast - by End User
- 12. Competitive Analysis
- 12.1. Company Profiles
- 12.1.1 Marimatic
- 12.1.1.1. Company Overview
- 12.1.1.2. Products
- 12.1.1.3. Company Financials
- 12.1.1.4. SWOT Analysis
- 12.1.2 ENVAC
- 12.1.2.1. Company Overview
- 12.1.2.2. Products
- 12.1.2.3. Company Financials
- 12.1.2.4. SWOT Analysis
- 12.1.3 URD
- 12.1.3.1. Company Overview
- 12.1.3.2. Products
- 12.1.3.3. Company Financials
- 12.1.3.4. SWOT Analysis
- 12.1.4 Stream
- 12.1.4.1. Company Overview
- 12.1.4.2. Products
- 12.1.4.3. Company Financials
- 12.1.4.4. SWOT Analysis
- 12.1.5 ATREO
- 12.1.5.1. Company Overview
- 12.1.5.2. Products
- 12.1.5.3. Company Financials
- 12.1.5.4. SWOT Analysis
- 12.1.6 Ros Roca envirotec
- 12.1.6.1. Company Overview
- 12.1.6.2. Products
- 12.1.6.3. Company Financials
- 12.1.6.4. SWOT Analysis
- 12.1.7 Peakway Environmental Sci & Tech Co Ltd
- 12.1.7.1. Company Overview
- 12.1.7.2. Products
- 12.1.7.3. Company Financials
- 12.1.7.4. SWOT Analysis
- 12.1.8 Aerbin ApS
- 12.1.8.1. Company Overview
- 12.1.8.2. Products
- 12.1.8.3. Company Financials
- 12.1.8.4. SWOT Analysis
- 12.1.9 Urban Refuse Development
- 12.1.9.1. Company Overview
- 12.1.9.2. Products
- 12.1.9.3. Company Financials
- 12.1.9.4. SWOT Analysis
- 12.1.10 Logiwaste AB**List Not Exhaustive 7 3 Other Companie
- 12.1.10.1. Company Overview
- 12.1.10.2. Products
- 12.1.10.3. Company Financials
- 12.1.10.4. SWOT Analysis
- 12.1.1 Marimatic
- 12.2. Market Entropy
- 12.2.1 Company's Key Areas Served
- 12.2.2 Recent Developments
- 12.3. Company Market Share Analysis 2025
- 12.3.1 Top 5 Companies Market Share Analysis
- 12.3.2 Top 3 Companies Market Share Analysis
- 12.4. List of Potential Customers
- 13. Research Methodology
List of Figures
- Figure 1: Global Pneumatic Waste Management System In GCC Revenue Breakdown (Million, %) by Region 2025 & 2033
- Figure 2: Global Pneumatic Waste Management System In GCC Volume Breakdown (Million, %) by Region 2025 & 2033
- Figure 3: North America Pneumatic Waste Management System In GCC Revenue (Million), by End User 2025 & 2033
- Figure 4: North America Pneumatic Waste Management System In GCC Volume (Million), by End User 2025 & 2033
- Figure 5: North America Pneumatic Waste Management System In GCC Revenue Share (%), by End User 2025 & 2033
- Figure 6: North America Pneumatic Waste Management System In GCC Volume Share (%), by End User 2025 & 2033
- Figure 7: North America Pneumatic Waste Management System In GCC Revenue (Million), by Country 2025 & 2033
- Figure 8: North America Pneumatic Waste Management System In GCC Volume (Million), by Country 2025 & 2033
- Figure 9: North America Pneumatic Waste Management System In GCC Revenue Share (%), by Country 2025 & 2033
- Figure 10: North America Pneumatic Waste Management System In GCC Volume Share (%), by Country 2025 & 2033
- Figure 11: South America Pneumatic Waste Management System In GCC Revenue (Million), by End User 2025 & 2033
- Figure 12: South America Pneumatic Waste Management System In GCC Volume (Million), by End User 2025 & 2033
- Figure 13: South America Pneumatic Waste Management System In GCC Revenue Share (%), by End User 2025 & 2033
- Figure 14: South America Pneumatic Waste Management System In GCC Volume Share (%), by End User 2025 & 2033
- Figure 15: South America Pneumatic Waste Management System In GCC Revenue (Million), by Country 2025 & 2033
- Figure 16: South America Pneumatic Waste Management System In GCC Volume (Million), by Country 2025 & 2033
- Figure 17: South America Pneumatic Waste Management System In GCC Revenue Share (%), by Country 2025 & 2033
- Figure 18: South America Pneumatic Waste Management System In GCC Volume Share (%), by Country 2025 & 2033
- Figure 19: Europe Pneumatic Waste Management System In GCC Revenue (Million), by End User 2025 & 2033
- Figure 20: Europe Pneumatic Waste Management System In GCC Volume (Million), by End User 2025 & 2033
- Figure 21: Europe Pneumatic Waste Management System In GCC Revenue Share (%), by End User 2025 & 2033
- Figure 22: Europe Pneumatic Waste Management System In GCC Volume Share (%), by End User 2025 & 2033
- Figure 23: Europe Pneumatic Waste Management System In GCC Revenue (Million), by Country 2025 & 2033
- Figure 24: Europe Pneumatic Waste Management System In GCC Volume (Million), by Country 2025 & 2033
- Figure 25: Europe Pneumatic Waste Management System In GCC Revenue Share (%), by Country 2025 & 2033
- Figure 26: Europe Pneumatic Waste Management System In GCC Volume Share (%), by Country 2025 & 2033
- Figure 27: Middle East & Africa Pneumatic Waste Management System In GCC Revenue (Million), by End User 2025 & 2033
- Figure 28: Middle East & Africa Pneumatic Waste Management System In GCC Volume (Million), by End User 2025 & 2033
- Figure 29: Middle East & Africa Pneumatic Waste Management System In GCC Revenue Share (%), by End User 2025 & 2033
- Figure 30: Middle East & Africa Pneumatic Waste Management System In GCC Volume Share (%), by End User 2025 & 2033
- Figure 31: Middle East & Africa Pneumatic Waste Management System In GCC Revenue (Million), by Country 2025 & 2033
- Figure 32: Middle East & Africa Pneumatic Waste Management System In GCC Volume (Million), by Country 2025 & 2033
- Figure 33: Middle East & Africa Pneumatic Waste Management System In GCC Revenue Share (%), by Country 2025 & 2033
- Figure 34: Middle East & Africa Pneumatic Waste Management System In GCC Volume Share (%), by Country 2025 & 2033
- Figure 35: Asia Pacific Pneumatic Waste Management System In GCC Revenue (Million), by End User 2025 & 2033
- Figure 36: Asia Pacific Pneumatic Waste Management System In GCC Volume (Million), by End User 2025 & 2033
- Figure 37: Asia Pacific Pneumatic Waste Management System In GCC Revenue Share (%), by End User 2025 & 2033
- Figure 38: Asia Pacific Pneumatic Waste Management System In GCC Volume Share (%), by End User 2025 & 2033
- Figure 39: Asia Pacific Pneumatic Waste Management System In GCC Revenue (Million), by Country 2025 & 2033
- Figure 40: Asia Pacific Pneumatic Waste Management System In GCC Volume (Million), by Country 2025 & 2033
- Figure 41: Asia Pacific Pneumatic Waste Management System In GCC Revenue Share (%), by Country 2025 & 2033
- Figure 42: Asia Pacific Pneumatic Waste Management System In GCC Volume Share (%), by Country 2025 & 2033
List of Tables
- Table 1: Global Pneumatic Waste Management System In GCC Revenue Million Forecast, by End User 2020 & 2033
- Table 2: Global Pneumatic Waste Management System In GCC Volume Million Forecast, by End User 2020 & 2033
- Table 3: Global Pneumatic Waste Management System In GCC Revenue Million Forecast, by Region 2020 & 2033
- Table 4: Global Pneumatic Waste Management System In GCC Volume Million Forecast, by Region 2020 & 2033
- Table 5: Global Pneumatic Waste Management System In GCC Revenue Million Forecast, by End User 2020 & 2033
- Table 6: Global Pneumatic Waste Management System In GCC Volume Million Forecast, by End User 2020 & 2033
- Table 7: Global Pneumatic Waste Management System In GCC Revenue Million Forecast, by Country 2020 & 2033
- Table 8: Global Pneumatic Waste Management System In GCC Volume Million Forecast, by Country 2020 & 2033
- Table 9: United States Pneumatic Waste Management System In GCC Revenue (Million) Forecast, by Application 2020 & 2033
- Table 10: United States Pneumatic Waste Management System In GCC Volume (Million) Forecast, by Application 2020 & 2033
- Table 11: Canada Pneumatic Waste Management System In GCC Revenue (Million) Forecast, by Application 2020 & 2033
- Table 12: Canada Pneumatic Waste Management System In GCC Volume (Million) Forecast, by Application 2020 & 2033
- Table 13: Mexico Pneumatic Waste Management System In GCC Revenue (Million) Forecast, by Application 2020 & 2033
- Table 14: Mexico Pneumatic Waste Management System In GCC Volume (Million) Forecast, by Application 2020 & 2033
- Table 15: Global Pneumatic Waste Management System In GCC Revenue Million Forecast, by End User 2020 & 2033
- Table 16: Global Pneumatic Waste Management System In GCC Volume Million Forecast, by End User 2020 & 2033
- Table 17: Global Pneumatic Waste Management System In GCC Revenue Million Forecast, by Country 2020 & 2033
- Table 18: Global Pneumatic Waste Management System In GCC Volume Million Forecast, by Country 2020 & 2033
- Table 19: Brazil Pneumatic Waste Management System In GCC Revenue (Million) Forecast, by Application 2020 & 2033
- Table 20: Brazil Pneumatic Waste Management System In GCC Volume (Million) Forecast, by Application 2020 & 2033
- Table 21: Argentina Pneumatic Waste Management System In GCC Revenue (Million) Forecast, by Application 2020 & 2033
- Table 22: Argentina Pneumatic Waste Management System In GCC Volume (Million) Forecast, by Application 2020 & 2033
- Table 23: Rest of South America Pneumatic Waste Management System In GCC Revenue (Million) Forecast, by Application 2020 & 2033
- Table 24: Rest of South America Pneumatic Waste Management System In GCC Volume (Million) Forecast, by Application 2020 & 2033
- Table 25: Global Pneumatic Waste Management System In GCC Revenue Million Forecast, by End User 2020 & 2033
- Table 26: Global Pneumatic Waste Management System In GCC Volume Million Forecast, by End User 2020 & 2033
- Table 27: Global Pneumatic Waste Management System In GCC Revenue Million Forecast, by Country 2020 & 2033
- Table 28: Global Pneumatic Waste Management System In GCC Volume Million Forecast, by Country 2020 & 2033
- Table 29: United Kingdom Pneumatic Waste Management System In GCC Revenue (Million) Forecast, by Application 2020 & 2033
- Table 30: United Kingdom Pneumatic Waste Management System In GCC Volume (Million) Forecast, by Application 2020 & 2033
- Table 31: Germany Pneumatic Waste Management System In GCC Revenue (Million) Forecast, by Application 2020 & 2033
- Table 32: Germany Pneumatic Waste Management System In GCC Volume (Million) Forecast, by Application 2020 & 2033
- Table 33: France Pneumatic Waste Management System In GCC Revenue (Million) Forecast, by Application 2020 & 2033
- Table 34: France Pneumatic Waste Management System In GCC Volume (Million) Forecast, by Application 2020 & 2033
- Table 35: Italy Pneumatic Waste Management System In GCC Revenue (Million) Forecast, by Application 2020 & 2033
- Table 36: Italy Pneumatic Waste Management System In GCC Volume (Million) Forecast, by Application 2020 & 2033
- Table 37: Spain Pneumatic Waste Management System In GCC Revenue (Million) Forecast, by Application 2020 & 2033
- Table 38: Spain Pneumatic Waste Management System In GCC Volume (Million) Forecast, by Application 2020 & 2033
- Table 39: Russia Pneumatic Waste Management System In GCC Revenue (Million) Forecast, by Application 2020 & 2033
- Table 40: Russia Pneumatic Waste Management System In GCC Volume (Million) Forecast, by Application 2020 & 2033
- Table 41: Benelux Pneumatic Waste Management System In GCC Revenue (Million) Forecast, by Application 2020 & 2033
- Table 42: Benelux Pneumatic Waste Management System In GCC Volume (Million) Forecast, by Application 2020 & 2033
- Table 43: Nordics Pneumatic Waste Management System In GCC Revenue (Million) Forecast, by Application 2020 & 2033
- Table 44: Nordics Pneumatic Waste Management System In GCC Volume (Million) Forecast, by Application 2020 & 2033
- Table 45: Rest of Europe Pneumatic Waste Management System In GCC Revenue (Million) Forecast, by Application 2020 & 2033
- Table 46: Rest of Europe Pneumatic Waste Management System In GCC Volume (Million) Forecast, by Application 2020 & 2033
- Table 47: Global Pneumatic Waste Management System In GCC Revenue Million Forecast, by End User 2020 & 2033
- Table 48: Global Pneumatic Waste Management System In GCC Volume Million Forecast, by End User 2020 & 2033
- Table 49: Global Pneumatic Waste Management System In GCC Revenue Million Forecast, by Country 2020 & 2033
- Table 50: Global Pneumatic Waste Management System In GCC Volume Million Forecast, by Country 2020 & 2033
- Table 51: Turkey Pneumatic Waste Management System In GCC Revenue (Million) Forecast, by Application 2020 & 2033
- Table 52: Turkey Pneumatic Waste Management System In GCC Volume (Million) Forecast, by Application 2020 & 2033
- Table 53: Israel Pneumatic Waste Management System In GCC Revenue (Million) Forecast, by Application 2020 & 2033
- Table 54: Israel Pneumatic Waste Management System In GCC Volume (Million) Forecast, by Application 2020 & 2033
- Table 55: GCC Pneumatic Waste Management System In GCC Revenue (Million) Forecast, by Application 2020 & 2033
- Table 56: GCC Pneumatic Waste Management System In GCC Volume (Million) Forecast, by Application 2020 & 2033
- Table 57: North Africa Pneumatic Waste Management System In GCC Revenue (Million) Forecast, by Application 2020 & 2033
- Table 58: North Africa Pneumatic Waste Management System In GCC Volume (Million) Forecast, by Application 2020 & 2033
- Table 59: South Africa Pneumatic Waste Management System In GCC Revenue (Million) Forecast, by Application 2020 & 2033
- Table 60: South Africa Pneumatic Waste Management System In GCC Volume (Million) Forecast, by Application 2020 & 2033
- Table 61: Rest of Middle East & Africa Pneumatic Waste Management System In GCC Revenue (Million) Forecast, by Application 2020 & 2033
- Table 62: Rest of Middle East & Africa Pneumatic Waste Management System In GCC Volume (Million) Forecast, by Application 2020 & 2033
- Table 63: Global Pneumatic Waste Management System In GCC Revenue Million Forecast, by End User 2020 & 2033
- Table 64: Global Pneumatic Waste Management System In GCC Volume Million Forecast, by End User 2020 & 2033
- Table 65: Global Pneumatic Waste Management System In GCC Revenue Million Forecast, by Country 2020 & 2033
- Table 66: Global Pneumatic Waste Management System In GCC Volume Million Forecast, by Country 2020 & 2033
- Table 67: China Pneumatic Waste Management System In GCC Revenue (Million) Forecast, by Application 2020 & 2033
- Table 68: China Pneumatic Waste Management System In GCC Volume (Million) Forecast, by Application 2020 & 2033
- Table 69: India Pneumatic Waste Management System In GCC Revenue (Million) Forecast, by Application 2020 & 2033
- Table 70: India Pneumatic Waste Management System In GCC Volume (Million) Forecast, by Application 2020 & 2033
- Table 71: Japan Pneumatic Waste Management System In GCC Revenue (Million) Forecast, by Application 2020 & 2033
- Table 72: Japan Pneumatic Waste Management System In GCC Volume (Million) Forecast, by Application 2020 & 2033
- Table 73: South Korea Pneumatic Waste Management System In GCC Revenue (Million) Forecast, by Application 2020 & 2033
- Table 74: South Korea Pneumatic Waste Management System In GCC Volume (Million) Forecast, by Application 2020 & 2033
- Table 75: ASEAN Pneumatic Waste Management System In GCC Revenue (Million) Forecast, by Application 2020 & 2033
- Table 76: ASEAN Pneumatic Waste Management System In GCC Volume (Million) Forecast, by Application 2020 & 2033
- Table 77: Oceania Pneumatic Waste Management System In GCC Revenue (Million) Forecast, by Application 2020 & 2033
- Table 78: Oceania Pneumatic Waste Management System In GCC Volume (Million) Forecast, by Application 2020 & 2033
- Table 79: Rest of Asia Pacific Pneumatic Waste Management System In GCC Revenue (Million) Forecast, by Application 2020 & 2033
- Table 80: Rest of Asia Pacific Pneumatic Waste Management System In GCC Volume (Million) Forecast, by Application 2020 & 2033
Frequently Asked Questions
1. What is the projected Compound Annual Growth Rate (CAGR) of the Pneumatic Waste Management System In GCC?
The projected CAGR is approximately 5.47%.
2. Which companies are prominent players in the Pneumatic Waste Management System In GCC?
Key companies in the market include Marimatic, ENVAC, URD, Stream, ATREO, Ros Roca envirotec, Peakway Environmental Sci & Tech Co Ltd, Aerbin ApS, Urban Refuse Development, Logiwaste AB**List Not Exhaustive 7 3 Other Companie.
3. What are the main segments of the Pneumatic Waste Management System In GCC?
The market segments include End User.
4. Can you provide details about the market size?
The market size is estimated to be USD 23.80 Million as of 2022.
5. What are some drivers contributing to market growth?
Increase in Waste Generation; Government Initiatives in Waste Management; Increasing Construction of Smart Cities.
6. What are the notable trends driving market growth?
Increasing Demand for Pneumatic Waste Management Systems in Saudi Arabia is Driving the Market.
7. Are there any restraints impacting market growth?
Increase in Waste Generation; Government Initiatives in Waste Management; Increasing Construction of Smart Cities.
8. Can you provide examples of recent developments in the market?
August 2023: Akam, a subsidiary of the Saudi Investment Company for Recycling (SIRC Group), partnered with Alawalya Qatar for Primary Materials. This collaboration focuses on the technical aspects of demolition and construction waste sorting and reviews past contracts. It also includes analyzing recycled soil debris and powder for reuse in fertilization and road paving, exchanging scientific research, and setting Qatari standards for recycled materials. The partnership may extend to other waste sectors, such as metals and tires.
9. What pricing options are available for accessing the report?
Pricing options include single-user, multi-user, and enterprise licenses priced at USD 3800, USD 4500, and USD 5800 respectively.
10. Is the market size provided in terms of value or volume?
The market size is provided in terms of value, measured in Million and volume, measured in Million.
11. Are there any specific market keywords associated with the report?
Yes, the market keyword associated with the report is "Pneumatic Waste Management System In GCC," which aids in identifying and referencing the specific market segment covered.
12. How do I determine which pricing option suits my needs best?
The pricing options vary based on user requirements and access needs. Individual users may opt for single-user licenses, while businesses requiring broader access may choose multi-user or enterprise licenses for cost-effective access to the report.
13. Are there any additional resources or data provided in the Pneumatic Waste Management System In GCC report?
While the report offers comprehensive insights, it's advisable to review the specific contents or supplementary materials provided to ascertain if additional resources or data are available.
14. How can I stay updated on further developments or reports in the Pneumatic Waste Management System In GCC?
To stay informed about further developments, trends, and reports in the Pneumatic Waste Management System In GCC, consider subscribing to industry newsletters, following relevant companies and organizations, or regularly checking reputable industry news sources and publications.
Methodology
Step 1 - Identification of Relevant Samples Size from Population Database


Step 2 - Approaches for Defining Global Market Size (Value, Volume* & Price*)

Note*: In applicable scenarios
Step 3 - Data Sources
Primary Research
- Web Analytics
- Survey Reports
- Research Institute
- Latest Research Reports
- Opinion Leaders
Secondary Research
- Annual Reports
- White Paper
- Latest Press Release
- Industry Association
- Paid Database
- Investor Presentations

Step 4 - Data Triangulation
Involves using different sources of information in order to increase the validity of a study
These sources are likely to be stakeholders in a program - participants, other researchers, program staff, other community members, and so on.
Then we put all data in single framework & apply various statistical tools to find out the dynamic on the market.
During the analysis stage, feedback from the stakeholder groups would be compared to determine areas of agreement as well as areas of divergence