

Key Insights
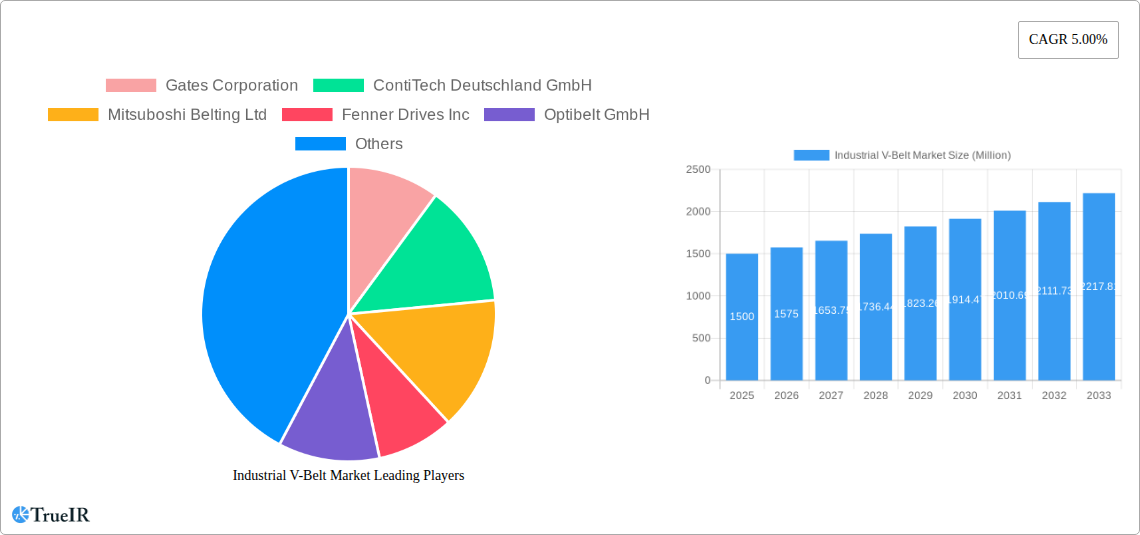
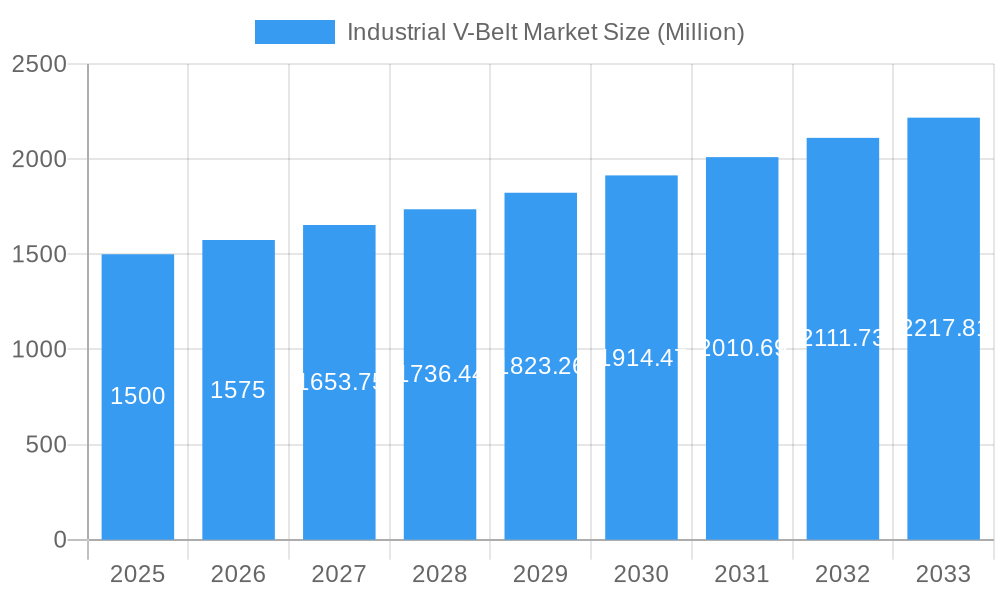
The global industrial V-belt market, valued at $1.5 billion in 2025, is projected to experience robust growth, driven by the increasing demand across various industrial sectors. A Compound Annual Growth Rate (CAGR) of 5% from 2025 to 2033 indicates a significant expansion of this market. Key drivers include the rising adoption of automation in manufacturing, the growth of the automotive and food processing industries, and the increasing need for efficient power transmission systems in diverse applications. Furthermore, technological advancements leading to improved durability, efficiency, and longer lifespan of V-belts contribute to market expansion. While potential restraints such as the fluctuating prices of raw materials and competition from alternative power transmission technologies exist, the overall market outlook remains positive. The market is segmented by material type (e.g., rubber, polyurethane), belt type (e.g., classical V-belts, cogged V-belts, multi-V-belts), and industry application (e.g., automotive, industrial machinery, agriculture). Major players like Gates Corporation, ContiTech, and Bando Chemical Industries dominate the market, constantly innovating to meet evolving customer needs and maintain their competitive edge. The market shows a diverse geographic spread, with regions like North America and Europe anticipated to maintain significant market shares, while emerging economies in Asia-Pacific are expected to exhibit considerable growth potential due to rapid industrialization.
Industrial V-Belt Market Market Size (In Billion)
The forecast period (2025-2033) anticipates continued growth driven by factors such as the increasing demand for robust and reliable power transmission solutions in heavy-duty industries and the expansion of renewable energy projects, which often utilize V-belt technology. The market is likely to witness increased adoption of advanced V-belt materials with enhanced performance characteristics and the development of more efficient manufacturing processes. Strategic partnerships and mergers and acquisitions are expected among key players, leading to increased market consolidation and innovation. While pricing pressures and supply chain disruptions might present challenges, the long-term growth trajectory remains optimistic, fueled by the fundamental importance of V-belts in various industrial applications. The ongoing shift towards more sustainable manufacturing practices might also influence the demand for environmentally friendly V-belt materials in the coming years.
Industrial V-Belt Market Company Market Share
Industrial V-Belt Market: A Comprehensive Report (2019-2033)
This dynamic report provides a comprehensive analysis of the Industrial V-Belt market, offering invaluable insights for industry stakeholders. With a focus on market trends, competitive landscapes, and future growth potential, this report is a must-have resource for strategic decision-making. Covering the period from 2019 to 2033, with 2025 as the base year, this in-depth study provides historical data, current market estimates, and future projections. The report's findings are supported by rigorous analysis and data visualization, ensuring clarity and actionable intelligence. The market is expected to reach xx Million by 2033, exhibiting a CAGR of xx% during the forecast period (2025-2033).
Industrial V-Belt Market Market Structure & Competitive Landscape
The Industrial V-Belt market exhibits a moderately consolidated structure, with key players such as Gates Corporation, ContiTech Deutschland GmbH, and Mitsuboshi Belting Ltd. holding significant market share. The Herfindahl-Hirschman Index (HHI) is estimated at xx, indicating a moderately competitive landscape. However, the market is characterized by ongoing innovation, driving the development of high-performance belts with enhanced durability and efficiency. Regulatory changes impacting material usage and environmental standards continue to influence market dynamics. Product substitution, primarily from other power transmission technologies (e.g., geared motors), poses a moderate threat. The market is segmented by various end-use industries, including automotive, manufacturing, and agriculture, each with unique demand characteristics. Mergers and acquisitions (M&A) activity has been moderate in recent years, with xx M&A deals recorded between 2019 and 2024, primarily focused on expanding geographical reach and technological capabilities.
- Market Concentration: Moderately consolidated, with a HHI of xx.
- Innovation Drivers: Development of high-performance materials (e.g., ethylene elastomer), enhanced durability, and improved energy efficiency.
- Regulatory Impacts: Environmental regulations and material safety standards influence product design and manufacturing processes.
- Product Substitutes: Geared motors, timing belts, and other power transmission technologies pose a moderate competitive threat.
- End-User Segmentation: Automotive, manufacturing, agriculture, and other industrial applications.
- M&A Trends: Moderate activity, driven by expansion and technological acquisition.
Industrial V-Belt Market Market Trends & Opportunities
The global Industrial V-Belt market is experiencing robust growth, driven by increasing industrial automation, rising demand from emerging economies, and advancements in belt technology. The market size was valued at xx Million in 2024 and is projected to reach xx Million by 2033, exhibiting a CAGR of xx%. This growth is fueled by several key trends:
- Technological Advancements: The adoption of high-performance materials like ethylene elastomer is enhancing belt durability and efficiency, leading to increased market penetration.
- Consumer Preferences: The demand for energy-efficient and quieter operation is driving the adoption of advanced belt designs.
- Competitive Dynamics: The market is witnessing increasing competition, with companies focusing on product differentiation, innovation, and cost optimization.
- Market Penetration: The penetration rate of advanced V-belt technologies is steadily increasing, particularly in developed economies.
The market presents significant opportunities for manufacturers focused on innovation, sustainability, and cost-effectiveness. Expanding into emerging economies, strategic partnerships, and the development of niche applications hold significant growth potential.
Dominant Markets & Segments in Industrial V-Belt Market
The North American region currently dominates the Industrial V-Belt market, driven by robust industrial activity and high adoption rates of advanced belt technologies. The strong automotive and manufacturing sectors in this region are significant contributors to the market's growth.
- Key Growth Drivers in North America:
- Robust industrial activity and manufacturing sector growth.
- High adoption rate of advanced V-belt technologies.
- Favorable regulatory environment.
- Strong automotive industry.
The European and Asia-Pacific markets are also experiencing significant growth, fueled by increasing industrialization and rising infrastructure development. Within the segment, high-capacity V-belts are witnessing the highest growth rate, driven by the need for higher power transmission capabilities in various industrial applications.
Key Growth Drivers in Asia-Pacific:
- Rapid industrialization and urbanization.
- Rising infrastructure development.
- Growth in manufacturing and automotive sectors.
Key Growth Drivers in Europe:
- High level of industrial automation.
- Stringent environmental regulations fostering innovation.
Industrial V-Belt Market Product Analysis
The industrial V-belt market offers a wide range of products, including classical V-belts, cogged V-belts, and banded V-belts, each catering to specific application requirements. Recent innovations focus on materials like ethylene elastomer (EE), providing improved durability and resistance to heat and chemicals. These advancements enhance efficiency and reduce maintenance costs, driving their adoption across diverse industrial applications. The market is also seeing growth in specialized V-belts designed for specific applications like high-speed machinery and harsh operating conditions. The key competitive advantages are derived from superior performance characteristics, extended lifespan, and cost-effectiveness.
Key Drivers, Barriers & Challenges in Industrial V-Belt Market
Key Drivers:
- Technological advancements in materials science leading to higher efficiency and durability.
- Increasing industrial automation and the need for reliable power transmission systems.
- Growth in manufacturing and automotive sectors globally.
Challenges:
- Fluctuations in raw material prices impacting profitability.
- Stringent environmental regulations requiring compliance with sustainability standards.
- Competition from alternative power transmission technologies. This is estimated to reduce market growth by approximately xx% by 2033.
Growth Drivers in the Industrial V-Belt Market Market
The growth of the Industrial V-Belt market is propelled by several key factors. Technological advancements resulting in higher efficiency and longer lifespan belts are a major driver. The increasing demand from various industrial sectors like automotive, manufacturing, and food processing also contributes significantly. Government regulations favoring energy-efficient technologies further boost market growth.
Challenges Impacting Industrial V-Belt Market Growth
Several factors pose challenges to the growth of the Industrial V-Belt market. Supply chain disruptions caused by geopolitical events or natural disasters can impact production and availability. Intense competition from alternative power transmission technologies and fluctuating raw material prices also present significant obstacles. Stricter environmental regulations may require significant investments in new technologies and processes.
Key Players Shaping the Industrial V-Belt Market Market
- Gates Corporation
- ContiTech Deutschland GmbH
- Mitsuboshi Belting Ltd
- Fenner Drives Inc
- Optibelt GmbH
- Bando Chemical Industries Ltd
- SFK Group
- Hutchinson
- PIX Transmissions Ltd
- Timken Belts
- Zhejiang Sanlux Rubber Co Ltd
- PowerDrive LLC
- BEHA Innovation GmbH
Significant Industrial V-Belt Market Industry Milestones
- August 2024: Gates Corporation announces the transition of its Super High Capacity (HC) Molded Notch (MN) V-belt composition from chloroprene rubber (CR) to advanced ethylene elastomer (EE) compounds, enhancing durability and performance. The company also begins producing its EE Tri-Power V-belts in Europe, reducing lead times and improving availability.
- July 2024: Gates Corporation begins producing its EE Tri-Power V-belts in Europe.
- March 2024: Dayco Inc. opens a new plant in San Luis Potosí, Mexico, with a capacity to produce up to 4.2 Million Poly-V belts annually, signifying expansion in the Americas.
Future Outlook for Industrial V-Belt Market Market
The Industrial V-Belt market is poised for continued growth, driven by ongoing technological advancements, increasing industrial automation, and rising demand from emerging economies. Strategic partnerships and expansion into new geographical markets present significant opportunities for players in this space. The focus on sustainable materials and energy-efficient designs will further shape market dynamics in the coming years. The market is expected to experience sustained growth, propelled by the factors mentioned above, with significant potential for players who can effectively innovate and adapt to evolving market needs.
Industrial V-Belt Market Segmentation
-
1. Type
- 1.1. Classical V-belt
- 1.2. Narrow V-belt
- 1.3. Wedge V-belt
- 1.4. Banded V-belt
-
2. Material
- 2.1. Rubber Belt
- 2.2. Polyurethane V-belt
- 2.3. Neoprene V-belt
-
3. End-user Vertical
- 3.1. Automotive Industry
- 3.2. Agriculture
- 3.3. Mining and Quarrying
- 3.4. Manufacturing
- 3.5. Construction
- 3.6. HVAC Systems
Industrial V-Belt Market Segmentation By Geography
- 1. North America
- 2. Europe
- 3. Asia
- 4. Australia and New Zealand
- 5. Latin America
- 6. Middle East and Africa
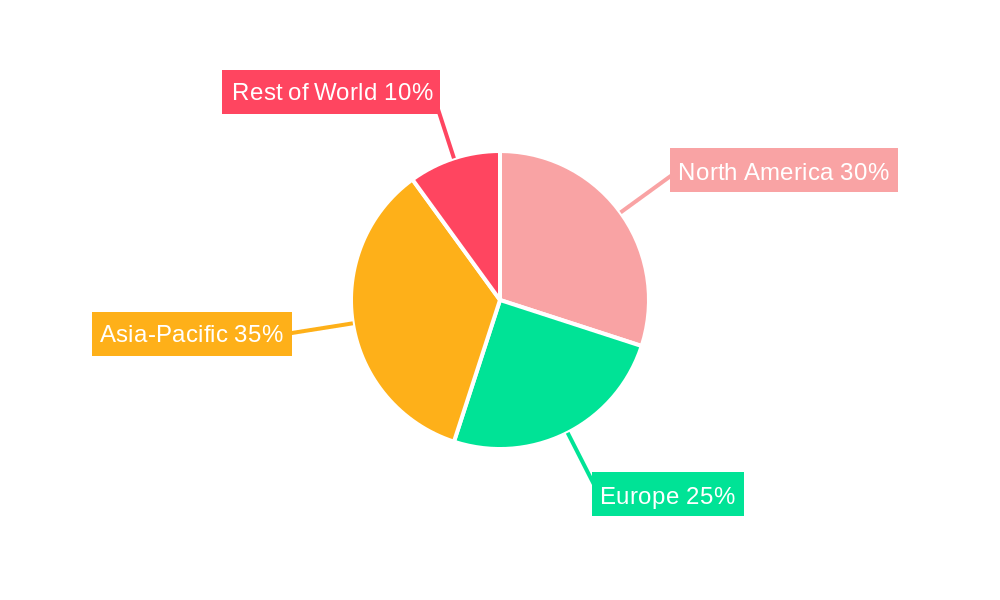
Industrial V-Belt Market Regional Market Share
Geographic Coverage of Industrial V-Belt Market
Industrial V-Belt Market REPORT HIGHLIGHTS
| Aspects | Details |
|---|---|
| Study Period | 2020-2034 |
| Base Year | 2025 |
| Estimated Year | 2026 |
| Forecast Period | 2026-2034 |
| Historical Period | 2020-2025 |
| Growth Rate | CAGR of 5.00% from 2020-2034 |
| Segmentation |
|
Table of Contents
- 1. Introduction
- 1.1. Research Scope
- 1.2. Market Segmentation
- 1.3. Research Objective
- 1.4. Definitions and Assumptions
- 2. Executive Summary
- 2.1. Market Snapshot
- 3. Market Dynamics
- 3.1. Market Drivers
- 3.2. Market Restrains
- 3.3. Market Trends
- 3.4. Market Opportunities
- 4. Market Factor Analysis
- 4.1. Porters Five Forces
- 4.1.1. Bargaining Power of Suppliers
- 4.1.2. Bargaining Power of Buyers
- 4.1.3. Threat of New Entrants
- 4.1.4. Threat of Substitutes
- 4.1.5. Competitive Rivalry
- 4.2. PESTEL analysis
- 4.3. BCG Analysis
- 4.3.1. Stars (High Growth, High Market Share)
- 4.3.2. Cash Cows (Low Growth, High Market Share)
- 4.3.3. Question Mark (High Growth, Low Market Share)
- 4.3.4. Dogs (Low Growth, Low Market Share)
- 4.4. Ansoff Matrix Analysis
- 4.5. Supply Chain Analysis
- 4.6. Regulatory Landscape
- 4.7. Current Market Potential and Opportunity Assessment (TAM–SAM–SOM Framework)
- 4.8. TIR Analyst Note
- 4.1. Porters Five Forces
- 5. Market Analysis, Insights and Forecast 2021-2033
- 5.1. Market Analysis, Insights and Forecast - by Type
- 5.1.1. Classical V-belt
- 5.1.2. Narrow V-belt
- 5.1.3. Wedge V-belt
- 5.1.4. Banded V-belt
- 5.2. Market Analysis, Insights and Forecast - by Material
- 5.2.1. Rubber Belt
- 5.2.2. Polyurethane V-belt
- 5.2.3. Neoprene V-belt
- 5.3. Market Analysis, Insights and Forecast - by End-user Vertical
- 5.3.1. Automotive Industry
- 5.3.2. Agriculture
- 5.3.3. Mining and Quarrying
- 5.3.4. Manufacturing
- 5.3.5. Construction
- 5.3.6. HVAC Systems
- 5.4. Market Analysis, Insights and Forecast - by Region
- 5.4.1. North America
- 5.4.2. Europe
- 5.4.3. Asia
- 5.4.4. Australia and New Zealand
- 5.4.5. Latin America
- 5.4.6. Middle East and Africa
- 5.1. Market Analysis, Insights and Forecast - by Type
- 6. Global Industrial V-Belt Market Analysis, Insights and Forecast, 2021-2033
- 6.1. Market Analysis, Insights and Forecast - by Type
- 6.1.1. Classical V-belt
- 6.1.2. Narrow V-belt
- 6.1.3. Wedge V-belt
- 6.1.4. Banded V-belt
- 6.2. Market Analysis, Insights and Forecast - by Material
- 6.2.1. Rubber Belt
- 6.2.2. Polyurethane V-belt
- 6.2.3. Neoprene V-belt
- 6.3. Market Analysis, Insights and Forecast - by End-user Vertical
- 6.3.1. Automotive Industry
- 6.3.2. Agriculture
- 6.3.3. Mining and Quarrying
- 6.3.4. Manufacturing
- 6.3.5. Construction
- 6.3.6. HVAC Systems
- 6.1. Market Analysis, Insights and Forecast - by Type
- 7. North America Industrial V-Belt Market Analysis, Insights and Forecast, 2020-2032
- 7.1. Market Analysis, Insights and Forecast - by Type
- 7.1.1. Classical V-belt
- 7.1.2. Narrow V-belt
- 7.1.3. Wedge V-belt
- 7.1.4. Banded V-belt
- 7.2. Market Analysis, Insights and Forecast - by Material
- 7.2.1. Rubber Belt
- 7.2.2. Polyurethane V-belt
- 7.2.3. Neoprene V-belt
- 7.3. Market Analysis, Insights and Forecast - by End-user Vertical
- 7.3.1. Automotive Industry
- 7.3.2. Agriculture
- 7.3.3. Mining and Quarrying
- 7.3.4. Manufacturing
- 7.3.5. Construction
- 7.3.6. HVAC Systems
- 7.1. Market Analysis, Insights and Forecast - by Type
- 8. Europe Industrial V-Belt Market Analysis, Insights and Forecast, 2020-2032
- 8.1. Market Analysis, Insights and Forecast - by Type
- 8.1.1. Classical V-belt
- 8.1.2. Narrow V-belt
- 8.1.3. Wedge V-belt
- 8.1.4. Banded V-belt
- 8.2. Market Analysis, Insights and Forecast - by Material
- 8.2.1. Rubber Belt
- 8.2.2. Polyurethane V-belt
- 8.2.3. Neoprene V-belt
- 8.3. Market Analysis, Insights and Forecast - by End-user Vertical
- 8.3.1. Automotive Industry
- 8.3.2. Agriculture
- 8.3.3. Mining and Quarrying
- 8.3.4. Manufacturing
- 8.3.5. Construction
- 8.3.6. HVAC Systems
- 8.1. Market Analysis, Insights and Forecast - by Type
- 9. Asia Industrial V-Belt Market Analysis, Insights and Forecast, 2020-2032
- 9.1. Market Analysis, Insights and Forecast - by Type
- 9.1.1. Classical V-belt
- 9.1.2. Narrow V-belt
- 9.1.3. Wedge V-belt
- 9.1.4. Banded V-belt
- 9.2. Market Analysis, Insights and Forecast - by Material
- 9.2.1. Rubber Belt
- 9.2.2. Polyurethane V-belt
- 9.2.3. Neoprene V-belt
- 9.3. Market Analysis, Insights and Forecast - by End-user Vertical
- 9.3.1. Automotive Industry
- 9.3.2. Agriculture
- 9.3.3. Mining and Quarrying
- 9.3.4. Manufacturing
- 9.3.5. Construction
- 9.3.6. HVAC Systems
- 9.1. Market Analysis, Insights and Forecast - by Type
- 10. Australia and New Zealand Industrial V-Belt Market Analysis, Insights and Forecast, 2020-2032
- 10.1. Market Analysis, Insights and Forecast - by Type
- 10.1.1. Classical V-belt
- 10.1.2. Narrow V-belt
- 10.1.3. Wedge V-belt
- 10.1.4. Banded V-belt
- 10.2. Market Analysis, Insights and Forecast - by Material
- 10.2.1. Rubber Belt
- 10.2.2. Polyurethane V-belt
- 10.2.3. Neoprene V-belt
- 10.3. Market Analysis, Insights and Forecast - by End-user Vertical
- 10.3.1. Automotive Industry
- 10.3.2. Agriculture
- 10.3.3. Mining and Quarrying
- 10.3.4. Manufacturing
- 10.3.5. Construction
- 10.3.6. HVAC Systems
- 10.1. Market Analysis, Insights and Forecast - by Type
- 11. Latin America Industrial V-Belt Market Analysis, Insights and Forecast, 2020-2032
- 11.1. Market Analysis, Insights and Forecast - by Type
- 11.1.1. Classical V-belt
- 11.1.2. Narrow V-belt
- 11.1.3. Wedge V-belt
- 11.1.4. Banded V-belt
- 11.2. Market Analysis, Insights and Forecast - by Material
- 11.2.1. Rubber Belt
- 11.2.2. Polyurethane V-belt
- 11.2.3. Neoprene V-belt
- 11.3. Market Analysis, Insights and Forecast - by End-user Vertical
- 11.3.1. Automotive Industry
- 11.3.2. Agriculture
- 11.3.3. Mining and Quarrying
- 11.3.4. Manufacturing
- 11.3.5. Construction
- 11.3.6. HVAC Systems
- 11.1. Market Analysis, Insights and Forecast - by Type
- 12. Middle East and Africa Industrial V-Belt Market Analysis, Insights and Forecast, 2020-2032
- 12.1. Market Analysis, Insights and Forecast - by Type
- 12.1.1. Classical V-belt
- 12.1.2. Narrow V-belt
- 12.1.3. Wedge V-belt
- 12.1.4. Banded V-belt
- 12.2. Market Analysis, Insights and Forecast - by Material
- 12.2.1. Rubber Belt
- 12.2.2. Polyurethane V-belt
- 12.2.3. Neoprene V-belt
- 12.3. Market Analysis, Insights and Forecast - by End-user Vertical
- 12.3.1. Automotive Industry
- 12.3.2. Agriculture
- 12.3.3. Mining and Quarrying
- 12.3.4. Manufacturing
- 12.3.5. Construction
- 12.3.6. HVAC Systems
- 12.1. Market Analysis, Insights and Forecast - by Type
- 13. Competitive Analysis
- 13.1. Company Profiles
- 13.1.1 Gates Corporation
- 13.1.1.1. Company Overview
- 13.1.1.2. Products
- 13.1.1.3. Company Financials
- 13.1.1.4. SWOT Analysis
- 13.1.2 ContiTech Deutschland GmbH
- 13.1.2.1. Company Overview
- 13.1.2.2. Products
- 13.1.2.3. Company Financials
- 13.1.2.4. SWOT Analysis
- 13.1.3 Mitsuboshi Belting Ltd
- 13.1.3.1. Company Overview
- 13.1.3.2. Products
- 13.1.3.3. Company Financials
- 13.1.3.4. SWOT Analysis
- 13.1.4 Fenner Drives Inc
- 13.1.4.1. Company Overview
- 13.1.4.2. Products
- 13.1.4.3. Company Financials
- 13.1.4.4. SWOT Analysis
- 13.1.5 Optibelt GmbH
- 13.1.5.1. Company Overview
- 13.1.5.2. Products
- 13.1.5.3. Company Financials
- 13.1.5.4. SWOT Analysis
- 13.1.6 Bando Chemical Industries Ltd
- 13.1.6.1. Company Overview
- 13.1.6.2. Products
- 13.1.6.3. Company Financials
- 13.1.6.4. SWOT Analysis
- 13.1.7 SFK Group
- 13.1.7.1. Company Overview
- 13.1.7.2. Products
- 13.1.7.3. Company Financials
- 13.1.7.4. SWOT Analysis
- 13.1.8 Hutchinson
- 13.1.8.1. Company Overview
- 13.1.8.2. Products
- 13.1.8.3. Company Financials
- 13.1.8.4. SWOT Analysis
- 13.1.9 PIX Transmissions Ltd
- 13.1.9.1. Company Overview
- 13.1.9.2. Products
- 13.1.9.3. Company Financials
- 13.1.9.4. SWOT Analysis
- 13.1.10 Timken Belts
- 13.1.10.1. Company Overview
- 13.1.10.2. Products
- 13.1.10.3. Company Financials
- 13.1.10.4. SWOT Analysis
- 13.1.11 Zhejiang Sanlux Rubber Co Ltd
- 13.1.11.1. Company Overview
- 13.1.11.2. Products
- 13.1.11.3. Company Financials
- 13.1.11.4. SWOT Analysis
- 13.1.12 PowerDrive LLC
- 13.1.12.1. Company Overview
- 13.1.12.2. Products
- 13.1.12.3. Company Financials
- 13.1.12.4. SWOT Analysis
- 13.1.13 BEHA Innovation GmbH*List Not Exhaustive
- 13.1.13.1. Company Overview
- 13.1.13.2. Products
- 13.1.13.3. Company Financials
- 13.1.13.4. SWOT Analysis
- 13.1.1 Gates Corporation
- 13.2. Market Entropy
- 13.2.1 Company's Key Areas Served
- 13.2.2 Recent Developments
- 13.3. Company Market Share Analysis 2025
- 13.3.1 Top 5 Companies Market Share Analysis
- 13.3.2 Top 3 Companies Market Share Analysis
- 13.4. List of Potential Customers
- 14. Research Methodology
List of Figures
- Figure 1: Global Industrial V-Belt Market Revenue Breakdown (Million, %) by Region 2025 & 2033
- Figure 2: Global Industrial V-Belt Market Volume Breakdown (Billion, %) by Region 2025 & 2033
- Figure 3: North America Industrial V-Belt Market Revenue (Million), by Type 2025 & 2033
- Figure 4: North America Industrial V-Belt Market Volume (Billion), by Type 2025 & 2033
- Figure 5: North America Industrial V-Belt Market Revenue Share (%), by Type 2025 & 2033
- Figure 6: North America Industrial V-Belt Market Volume Share (%), by Type 2025 & 2033
- Figure 7: North America Industrial V-Belt Market Revenue (Million), by Material 2025 & 2033
- Figure 8: North America Industrial V-Belt Market Volume (Billion), by Material 2025 & 2033
- Figure 9: North America Industrial V-Belt Market Revenue Share (%), by Material 2025 & 2033
- Figure 10: North America Industrial V-Belt Market Volume Share (%), by Material 2025 & 2033
- Figure 11: North America Industrial V-Belt Market Revenue (Million), by End-user Vertical 2025 & 2033
- Figure 12: North America Industrial V-Belt Market Volume (Billion), by End-user Vertical 2025 & 2033
- Figure 13: North America Industrial V-Belt Market Revenue Share (%), by End-user Vertical 2025 & 2033
- Figure 14: North America Industrial V-Belt Market Volume Share (%), by End-user Vertical 2025 & 2033
- Figure 15: North America Industrial V-Belt Market Revenue (Million), by Country 2025 & 2033
- Figure 16: North America Industrial V-Belt Market Volume (Billion), by Country 2025 & 2033
- Figure 17: North America Industrial V-Belt Market Revenue Share (%), by Country 2025 & 2033
- Figure 18: North America Industrial V-Belt Market Volume Share (%), by Country 2025 & 2033
- Figure 19: Europe Industrial V-Belt Market Revenue (Million), by Type 2025 & 2033
- Figure 20: Europe Industrial V-Belt Market Volume (Billion), by Type 2025 & 2033
- Figure 21: Europe Industrial V-Belt Market Revenue Share (%), by Type 2025 & 2033
- Figure 22: Europe Industrial V-Belt Market Volume Share (%), by Type 2025 & 2033
- Figure 23: Europe Industrial V-Belt Market Revenue (Million), by Material 2025 & 2033
- Figure 24: Europe Industrial V-Belt Market Volume (Billion), by Material 2025 & 2033
- Figure 25: Europe Industrial V-Belt Market Revenue Share (%), by Material 2025 & 2033
- Figure 26: Europe Industrial V-Belt Market Volume Share (%), by Material 2025 & 2033
- Figure 27: Europe Industrial V-Belt Market Revenue (Million), by End-user Vertical 2025 & 2033
- Figure 28: Europe Industrial V-Belt Market Volume (Billion), by End-user Vertical 2025 & 2033
- Figure 29: Europe Industrial V-Belt Market Revenue Share (%), by End-user Vertical 2025 & 2033
- Figure 30: Europe Industrial V-Belt Market Volume Share (%), by End-user Vertical 2025 & 2033
- Figure 31: Europe Industrial V-Belt Market Revenue (Million), by Country 2025 & 2033
- Figure 32: Europe Industrial V-Belt Market Volume (Billion), by Country 2025 & 2033
- Figure 33: Europe Industrial V-Belt Market Revenue Share (%), by Country 2025 & 2033
- Figure 34: Europe Industrial V-Belt Market Volume Share (%), by Country 2025 & 2033
- Figure 35: Asia Industrial V-Belt Market Revenue (Million), by Type 2025 & 2033
- Figure 36: Asia Industrial V-Belt Market Volume (Billion), by Type 2025 & 2033
- Figure 37: Asia Industrial V-Belt Market Revenue Share (%), by Type 2025 & 2033
- Figure 38: Asia Industrial V-Belt Market Volume Share (%), by Type 2025 & 2033
- Figure 39: Asia Industrial V-Belt Market Revenue (Million), by Material 2025 & 2033
- Figure 40: Asia Industrial V-Belt Market Volume (Billion), by Material 2025 & 2033
- Figure 41: Asia Industrial V-Belt Market Revenue Share (%), by Material 2025 & 2033
- Figure 42: Asia Industrial V-Belt Market Volume Share (%), by Material 2025 & 2033
- Figure 43: Asia Industrial V-Belt Market Revenue (Million), by End-user Vertical 2025 & 2033
- Figure 44: Asia Industrial V-Belt Market Volume (Billion), by End-user Vertical 2025 & 2033
- Figure 45: Asia Industrial V-Belt Market Revenue Share (%), by End-user Vertical 2025 & 2033
- Figure 46: Asia Industrial V-Belt Market Volume Share (%), by End-user Vertical 2025 & 2033
- Figure 47: Asia Industrial V-Belt Market Revenue (Million), by Country 2025 & 2033
- Figure 48: Asia Industrial V-Belt Market Volume (Billion), by Country 2025 & 2033
- Figure 49: Asia Industrial V-Belt Market Revenue Share (%), by Country 2025 & 2033
- Figure 50: Asia Industrial V-Belt Market Volume Share (%), by Country 2025 & 2033
- Figure 51: Australia and New Zealand Industrial V-Belt Market Revenue (Million), by Type 2025 & 2033
- Figure 52: Australia and New Zealand Industrial V-Belt Market Volume (Billion), by Type 2025 & 2033
- Figure 53: Australia and New Zealand Industrial V-Belt Market Revenue Share (%), by Type 2025 & 2033
- Figure 54: Australia and New Zealand Industrial V-Belt Market Volume Share (%), by Type 2025 & 2033
- Figure 55: Australia and New Zealand Industrial V-Belt Market Revenue (Million), by Material 2025 & 2033
- Figure 56: Australia and New Zealand Industrial V-Belt Market Volume (Billion), by Material 2025 & 2033
- Figure 57: Australia and New Zealand Industrial V-Belt Market Revenue Share (%), by Material 2025 & 2033
- Figure 58: Australia and New Zealand Industrial V-Belt Market Volume Share (%), by Material 2025 & 2033
- Figure 59: Australia and New Zealand Industrial V-Belt Market Revenue (Million), by End-user Vertical 2025 & 2033
- Figure 60: Australia and New Zealand Industrial V-Belt Market Volume (Billion), by End-user Vertical 2025 & 2033
- Figure 61: Australia and New Zealand Industrial V-Belt Market Revenue Share (%), by End-user Vertical 2025 & 2033
- Figure 62: Australia and New Zealand Industrial V-Belt Market Volume Share (%), by End-user Vertical 2025 & 2033
- Figure 63: Australia and New Zealand Industrial V-Belt Market Revenue (Million), by Country 2025 & 2033
- Figure 64: Australia and New Zealand Industrial V-Belt Market Volume (Billion), by Country 2025 & 2033
- Figure 65: Australia and New Zealand Industrial V-Belt Market Revenue Share (%), by Country 2025 & 2033
- Figure 66: Australia and New Zealand Industrial V-Belt Market Volume Share (%), by Country 2025 & 2033
- Figure 67: Latin America Industrial V-Belt Market Revenue (Million), by Type 2025 & 2033
- Figure 68: Latin America Industrial V-Belt Market Volume (Billion), by Type 2025 & 2033
- Figure 69: Latin America Industrial V-Belt Market Revenue Share (%), by Type 2025 & 2033
- Figure 70: Latin America Industrial V-Belt Market Volume Share (%), by Type 2025 & 2033
- Figure 71: Latin America Industrial V-Belt Market Revenue (Million), by Material 2025 & 2033
- Figure 72: Latin America Industrial V-Belt Market Volume (Billion), by Material 2025 & 2033
- Figure 73: Latin America Industrial V-Belt Market Revenue Share (%), by Material 2025 & 2033
- Figure 74: Latin America Industrial V-Belt Market Volume Share (%), by Material 2025 & 2033
- Figure 75: Latin America Industrial V-Belt Market Revenue (Million), by End-user Vertical 2025 & 2033
- Figure 76: Latin America Industrial V-Belt Market Volume (Billion), by End-user Vertical 2025 & 2033
- Figure 77: Latin America Industrial V-Belt Market Revenue Share (%), by End-user Vertical 2025 & 2033
- Figure 78: Latin America Industrial V-Belt Market Volume Share (%), by End-user Vertical 2025 & 2033
- Figure 79: Latin America Industrial V-Belt Market Revenue (Million), by Country 2025 & 2033
- Figure 80: Latin America Industrial V-Belt Market Volume (Billion), by Country 2025 & 2033
- Figure 81: Latin America Industrial V-Belt Market Revenue Share (%), by Country 2025 & 2033
- Figure 82: Latin America Industrial V-Belt Market Volume Share (%), by Country 2025 & 2033
- Figure 83: Middle East and Africa Industrial V-Belt Market Revenue (Million), by Type 2025 & 2033
- Figure 84: Middle East and Africa Industrial V-Belt Market Volume (Billion), by Type 2025 & 2033
- Figure 85: Middle East and Africa Industrial V-Belt Market Revenue Share (%), by Type 2025 & 2033
- Figure 86: Middle East and Africa Industrial V-Belt Market Volume Share (%), by Type 2025 & 2033
- Figure 87: Middle East and Africa Industrial V-Belt Market Revenue (Million), by Material 2025 & 2033
- Figure 88: Middle East and Africa Industrial V-Belt Market Volume (Billion), by Material 2025 & 2033
- Figure 89: Middle East and Africa Industrial V-Belt Market Revenue Share (%), by Material 2025 & 2033
- Figure 90: Middle East and Africa Industrial V-Belt Market Volume Share (%), by Material 2025 & 2033
- Figure 91: Middle East and Africa Industrial V-Belt Market Revenue (Million), by End-user Vertical 2025 & 2033
- Figure 92: Middle East and Africa Industrial V-Belt Market Volume (Billion), by End-user Vertical 2025 & 2033
- Figure 93: Middle East and Africa Industrial V-Belt Market Revenue Share (%), by End-user Vertical 2025 & 2033
- Figure 94: Middle East and Africa Industrial V-Belt Market Volume Share (%), by End-user Vertical 2025 & 2033
- Figure 95: Middle East and Africa Industrial V-Belt Market Revenue (Million), by Country 2025 & 2033
- Figure 96: Middle East and Africa Industrial V-Belt Market Volume (Billion), by Country 2025 & 2033
- Figure 97: Middle East and Africa Industrial V-Belt Market Revenue Share (%), by Country 2025 & 2033
- Figure 98: Middle East and Africa Industrial V-Belt Market Volume Share (%), by Country 2025 & 2033
List of Tables
- Table 1: Global Industrial V-Belt Market Revenue Million Forecast, by Type 2020 & 2033
- Table 2: Global Industrial V-Belt Market Volume Billion Forecast, by Type 2020 & 2033
- Table 3: Global Industrial V-Belt Market Revenue Million Forecast, by Material 2020 & 2033
- Table 4: Global Industrial V-Belt Market Volume Billion Forecast, by Material 2020 & 2033
- Table 5: Global Industrial V-Belt Market Revenue Million Forecast, by End-user Vertical 2020 & 2033
- Table 6: Global Industrial V-Belt Market Volume Billion Forecast, by End-user Vertical 2020 & 2033
- Table 7: Global Industrial V-Belt Market Revenue Million Forecast, by Region 2020 & 2033
- Table 8: Global Industrial V-Belt Market Volume Billion Forecast, by Region 2020 & 2033
- Table 9: Global Industrial V-Belt Market Revenue Million Forecast, by Type 2020 & 2033
- Table 10: Global Industrial V-Belt Market Volume Billion Forecast, by Type 2020 & 2033
- Table 11: Global Industrial V-Belt Market Revenue Million Forecast, by Material 2020 & 2033
- Table 12: Global Industrial V-Belt Market Volume Billion Forecast, by Material 2020 & 2033
- Table 13: Global Industrial V-Belt Market Revenue Million Forecast, by End-user Vertical 2020 & 2033
- Table 14: Global Industrial V-Belt Market Volume Billion Forecast, by End-user Vertical 2020 & 2033
- Table 15: Global Industrial V-Belt Market Revenue Million Forecast, by Country 2020 & 2033
- Table 16: Global Industrial V-Belt Market Volume Billion Forecast, by Country 2020 & 2033
- Table 17: Global Industrial V-Belt Market Revenue Million Forecast, by Type 2020 & 2033
- Table 18: Global Industrial V-Belt Market Volume Billion Forecast, by Type 2020 & 2033
- Table 19: Global Industrial V-Belt Market Revenue Million Forecast, by Material 2020 & 2033
- Table 20: Global Industrial V-Belt Market Volume Billion Forecast, by Material 2020 & 2033
- Table 21: Global Industrial V-Belt Market Revenue Million Forecast, by End-user Vertical 2020 & 2033
- Table 22: Global Industrial V-Belt Market Volume Billion Forecast, by End-user Vertical 2020 & 2033
- Table 23: Global Industrial V-Belt Market Revenue Million Forecast, by Country 2020 & 2033
- Table 24: Global Industrial V-Belt Market Volume Billion Forecast, by Country 2020 & 2033
- Table 25: Global Industrial V-Belt Market Revenue Million Forecast, by Type 2020 & 2033
- Table 26: Global Industrial V-Belt Market Volume Billion Forecast, by Type 2020 & 2033
- Table 27: Global Industrial V-Belt Market Revenue Million Forecast, by Material 2020 & 2033
- Table 28: Global Industrial V-Belt Market Volume Billion Forecast, by Material 2020 & 2033
- Table 29: Global Industrial V-Belt Market Revenue Million Forecast, by End-user Vertical 2020 & 2033
- Table 30: Global Industrial V-Belt Market Volume Billion Forecast, by End-user Vertical 2020 & 2033
- Table 31: Global Industrial V-Belt Market Revenue Million Forecast, by Country 2020 & 2033
- Table 32: Global Industrial V-Belt Market Volume Billion Forecast, by Country 2020 & 2033
- Table 33: Global Industrial V-Belt Market Revenue Million Forecast, by Type 2020 & 2033
- Table 34: Global Industrial V-Belt Market Volume Billion Forecast, by Type 2020 & 2033
- Table 35: Global Industrial V-Belt Market Revenue Million Forecast, by Material 2020 & 2033
- Table 36: Global Industrial V-Belt Market Volume Billion Forecast, by Material 2020 & 2033
- Table 37: Global Industrial V-Belt Market Revenue Million Forecast, by End-user Vertical 2020 & 2033
- Table 38: Global Industrial V-Belt Market Volume Billion Forecast, by End-user Vertical 2020 & 2033
- Table 39: Global Industrial V-Belt Market Revenue Million Forecast, by Country 2020 & 2033
- Table 40: Global Industrial V-Belt Market Volume Billion Forecast, by Country 2020 & 2033
- Table 41: Global Industrial V-Belt Market Revenue Million Forecast, by Type 2020 & 2033
- Table 42: Global Industrial V-Belt Market Volume Billion Forecast, by Type 2020 & 2033
- Table 43: Global Industrial V-Belt Market Revenue Million Forecast, by Material 2020 & 2033
- Table 44: Global Industrial V-Belt Market Volume Billion Forecast, by Material 2020 & 2033
- Table 45: Global Industrial V-Belt Market Revenue Million Forecast, by End-user Vertical 2020 & 2033
- Table 46: Global Industrial V-Belt Market Volume Billion Forecast, by End-user Vertical 2020 & 2033
- Table 47: Global Industrial V-Belt Market Revenue Million Forecast, by Country 2020 & 2033
- Table 48: Global Industrial V-Belt Market Volume Billion Forecast, by Country 2020 & 2033
- Table 49: Global Industrial V-Belt Market Revenue Million Forecast, by Type 2020 & 2033
- Table 50: Global Industrial V-Belt Market Volume Billion Forecast, by Type 2020 & 2033
- Table 51: Global Industrial V-Belt Market Revenue Million Forecast, by Material 2020 & 2033
- Table 52: Global Industrial V-Belt Market Volume Billion Forecast, by Material 2020 & 2033
- Table 53: Global Industrial V-Belt Market Revenue Million Forecast, by End-user Vertical 2020 & 2033
- Table 54: Global Industrial V-Belt Market Volume Billion Forecast, by End-user Vertical 2020 & 2033
- Table 55: Global Industrial V-Belt Market Revenue Million Forecast, by Country 2020 & 2033
- Table 56: Global Industrial V-Belt Market Volume Billion Forecast, by Country 2020 & 2033
Frequently Asked Questions
1. What is the projected Compound Annual Growth Rate (CAGR) of the Industrial V-Belt Market?
The projected CAGR is approximately 5.00%.
2. Which companies are prominent players in the Industrial V-Belt Market?
Key companies in the market include Gates Corporation, ContiTech Deutschland GmbH, Mitsuboshi Belting Ltd, Fenner Drives Inc, Optibelt GmbH, Bando Chemical Industries Ltd, SFK Group, Hutchinson, PIX Transmissions Ltd, Timken Belts, Zhejiang Sanlux Rubber Co Ltd, PowerDrive LLC, BEHA Innovation GmbH*List Not Exhaustive.
3. What are the main segments of the Industrial V-Belt Market?
The market segments include Type, Material, End-user Vertical.
4. Can you provide details about the market size?
The market size is estimated to be USD 1.5 Million as of 2022.
5. What are some drivers contributing to market growth?
Industrial Automation Growth; Maintenance and Replacement Demand.
6. What are the notable trends driving market growth?
The Automotive Industry is Projected to Witness Strong Demand.
7. Are there any restraints impacting market growth?
Industrial Automation Growth; Maintenance and Replacement Demand.
8. Can you provide examples of recent developments in the market?
August 2024: Gates Corporation is enhancing its bandless V-belt lineup. The composition of the Super High Capacity (HC) Molded Notch (MN) V-belt will transition from standard chloroprene rubber (CR) materials to advanced ethylene elastomer (EE) compounds. Furthermore, in July 2024, the company began producing its EE Tri-Power V-belts in Europe, ensuring reduced lead times and improved availability.March 2024: V-Belt manufacturer Dayco Inc. inaugurated its new plant in San Luis Potosí, Mexico, located in the Tres Naciones Park, in the Industrial Zone of the state. The new plant will be used to produce belts for light combustion cars, with its molded tooth design that operates more quietly and efficiently. In terms of its scale and capacity, the facility covers 73,000 sq. ft and is equipped with state-of-the-art machinery that can produce up to 4.2 million Poly-V belts annually,
9. What pricing options are available for accessing the report?
Pricing options include single-user, multi-user, and enterprise licenses priced at USD 4750, USD 5250, and USD 8750 respectively.
10. Is the market size provided in terms of value or volume?
The market size is provided in terms of value, measured in Million and volume, measured in Billion.
11. Are there any specific market keywords associated with the report?
Yes, the market keyword associated with the report is "Industrial V-Belt Market," which aids in identifying and referencing the specific market segment covered.
12. How do I determine which pricing option suits my needs best?
The pricing options vary based on user requirements and access needs. Individual users may opt for single-user licenses, while businesses requiring broader access may choose multi-user or enterprise licenses for cost-effective access to the report.
13. Are there any additional resources or data provided in the Industrial V-Belt Market report?
While the report offers comprehensive insights, it's advisable to review the specific contents or supplementary materials provided to ascertain if additional resources or data are available.
14. How can I stay updated on further developments or reports in the Industrial V-Belt Market?
To stay informed about further developments, trends, and reports in the Industrial V-Belt Market, consider subscribing to industry newsletters, following relevant companies and organizations, or regularly checking reputable industry news sources and publications.
Methodology
Step 1 - Identification of Relevant Samples Size from Population Database


Step 2 - Approaches for Defining Global Market Size (Value, Volume* & Price*)

Note*: In applicable scenarios
Step 3 - Data Sources
Primary Research
- Web Analytics
- Survey Reports
- Research Institute
- Latest Research Reports
- Opinion Leaders
Secondary Research
- Annual Reports
- White Paper
- Latest Press Release
- Industry Association
- Paid Database
- Investor Presentations

Step 4 - Data Triangulation
Involves using different sources of information in order to increase the validity of a study
These sources are likely to be stakeholders in a program - participants, other researchers, program staff, other community members, and so on.
Then we put all data in single framework & apply various statistical tools to find out the dynamic on the market.
During the analysis stage, feedback from the stakeholder groups would be compared to determine areas of agreement as well as areas of divergence