

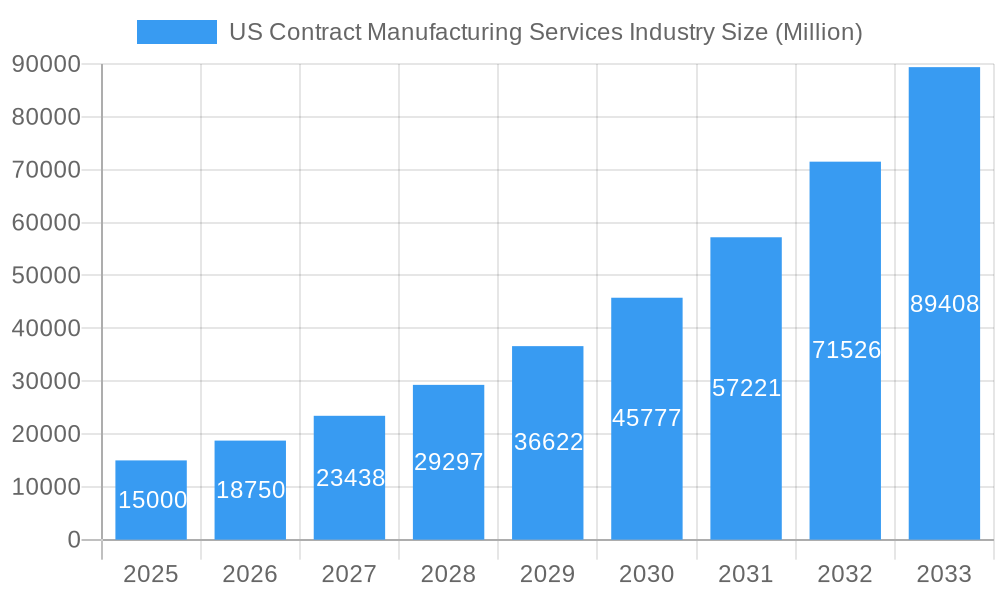
Key Insights
The US contract manufacturing services (CMS) industry is experiencing robust growth, fueled by several key factors. The increasing demand for specialized products, coupled with rising consumer expectations for speed and efficiency in product delivery, is driving companies to outsource manufacturing processes. This trend is particularly pronounced in sectors like food and beverage, pharmaceuticals, and cosmetics, where specialized equipment and expertise are crucial for maintaining quality and meeting regulatory standards. The industry's 25.10% CAGR (Compound Annual Growth Rate) from 2019-2033 indicates a significant upward trajectory. This growth is being facilitated by advancements in automation and technology, allowing CMS providers to offer greater scalability and cost-effectiveness. Furthermore, the rising prevalence of e-commerce and direct-to-consumer brands increases the need for flexible and adaptable manufacturing partners capable of handling fluctuating demand. While potential restraints include supply chain disruptions and increasing labor costs, the overall market outlook remains positive. The large number of companies involved, ranging from large multinational corporations to smaller niche players, reflects the industry's diversity and competitiveness. The industry's segmentation suggests a strong focus on meeting the diverse needs of various clients and industries. For example, the presence of companies specialized in food & beverage, pharmaceuticals and cosmetics reflects different regulatory environments and market needs.
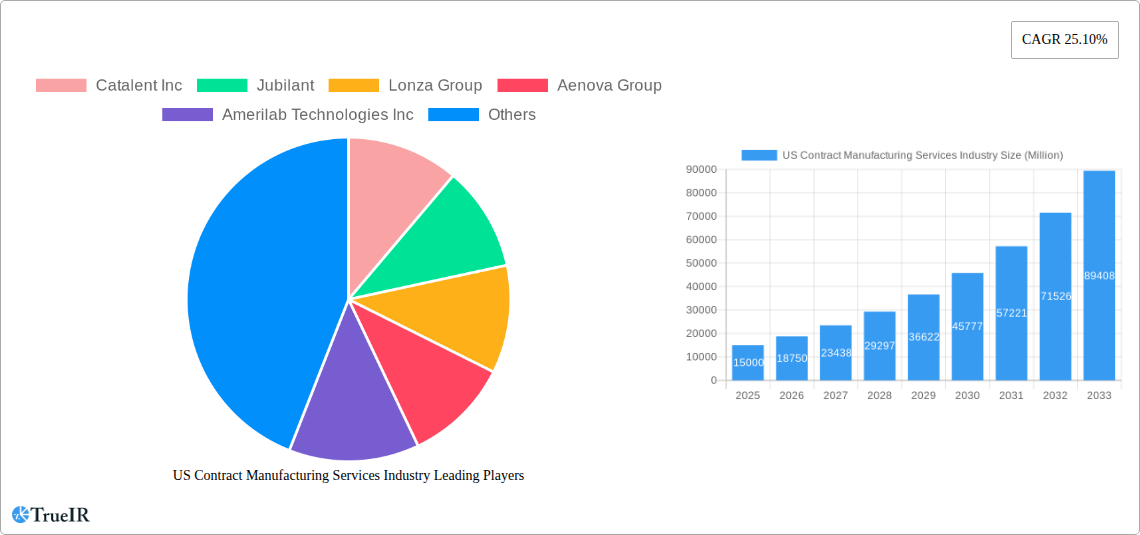
US Contract Manufacturing Services Industry Market Size (In Billion)
The forecast for the US CMS market shows continued expansion through 2033. The industry's success hinges on its ability to innovate, adapt to evolving consumer preferences, and navigate global supply chain complexities. The continued integration of technology, such as automation and data analytics, will be critical for improving efficiency and maintaining a competitive edge. The focus on sustainability and ethical sourcing is also becoming increasingly important, influencing manufacturing practices and driving demand for CMS providers that align with these values. The presence of both large established players and smaller specialized firms indicates a healthy competitive landscape, fostering innovation and driving down costs for clients. The continued consolidation within some segments is likely to drive market efficiency, providing economies of scale and streamlining supply chains.
US Contract Manufacturing Services Industry Company Market Share
This comprehensive report provides a detailed analysis of the US Contract Manufacturing Services (CMS) industry, covering market size, trends, competitive landscape, and future outlook. With a study period spanning 2019-2033, a base year of 2025, and a forecast period of 2025-2033, this report is an invaluable resource for industry stakeholders, investors, and strategic decision-makers. The report leverages extensive data analysis and expert insights to provide a clear understanding of this dynamic market. Key players such as Catalent Inc, Lonza Group, and KIK Custom Products are profiled, along with an overview of emerging trends and challenges shaping the industry's future.
US Contract Manufacturing Services Industry Market Structure & Competitive Landscape
The US Contract Manufacturing Services industry is characterized by a moderately fragmented yet dynamic market structure. While specific Herfindahl-Hirschman Index (HHI) figures can fluctuate, the presence of both established multinational corporations and a robust network of specialized, agile contract manufacturers indicates a competitive environment. Market concentration is influenced by critical factors such as the ability to achieve economies of scale, the depth and breadth of technological capabilities, and the unwavering commitment to regulatory compliance across diverse sectors.
Innovation Drivers: A significant catalyst for innovation within the industry is the continuous evolution and adoption of advanced manufacturing technologies. This includes the increasing integration of automation, robotics, artificial intelligence (AI), and the broader principles of Industry 4.0. These advancements are not only enhancing operational efficiency and flexibility but also enabling the production of more complex and specialized products.
Regulatory Impacts: The industry's landscape is profoundly shaped by stringent regulatory frameworks, particularly within high-stakes sectors like pharmaceuticals, biotechnology, and food & beverage. Adherence to regulations set forth by bodies such as the FDA (Food and Drug Administration) and other relevant agencies is paramount. These compliance requirements directly influence operational costs, necessitate specialized expertise, and can serve as significant market entry barriers for new entrants.
Product Substitutes: While direct substitutes for contract manufacturing services are limited, businesses retain the option of establishing and managing in-house manufacturing facilities. This alternative is particularly relevant for large corporations with substantial capital investment capabilities and a strategic imperative for complete control over their production processes. The decision between outsourcing and in-house production is a key consideration impacting the demand for contract manufacturing.
End-User Segmentation: The US Contract Manufacturing Services market is highly diversified, catering to a wide array of end-user industries. Key segments include pharmaceuticals, food & beverage, cosmetics, personal care, nutraceuticals, and industrial goods. The pharmaceutical segment typically commands a substantial market share due to its high-value products and stringent manufacturing demands. Other significant contributors include the rapidly growing food & beverage and personal care sectors.
M&A Trends: Mergers and acquisitions (M&A) activity is a notable feature of the industry, driven by strategic imperatives such as expanding service offerings, acquiring cutting-edge technologies, achieving greater market penetration, and consolidating market share. These transactions play a crucial role in shaping the competitive landscape and fostering industry consolidation.
US Contract Manufacturing Services Industry Market Trends & Opportunities
The US Contract Manufacturing Services market is poised for robust growth, fueled by a confluence of strategic shifts and evolving industry demands. Key indicators point towards significant expansion in market size, driven by a projected Compound Annual Growth Rate (CAGR) that reflects increasing reliance on specialized manufacturing partners.
- Strategic Outsourcing: A primary growth driver is the escalating trend of companies outsourcing manufacturing functions. This allows businesses to sharpen their focus on core competencies, such as research and development, marketing, and sales, while leveraging the expertise and infrastructure of contract manufacturers to optimize production and reduce overheads.
- Technological Revolution: The pervasive integration of advanced technologies is a cornerstone of market growth. Automation, AI-driven analytics, the Internet of Things (IoT), and advanced robotics are not only enhancing manufacturing efficiency and precision but also improving product quality, reducing waste, and enabling greater traceability.
- Demand for Bespoke Products: The modern consumer landscape increasingly values product personalization and variety. This surge in demand for customized and niche products directly translates into a greater need for flexible, agile, and responsive contract manufacturers capable of meeting specific formulation, packaging, and production requirements.
- Sector-Specific Expansions: Strong and sustained growth within pivotal sectors such as pharmaceuticals, biotechnology, and the burgeoning food & beverage and health & wellness industries provides a fertile ground for contract manufacturing services. These sectors often require specialized expertise and adherence to rigorous quality standards.
- E-commerce Catalysis: The exponential growth of e-commerce has fundamentally altered supply chain dynamics. This necessitates efficient, scalable, and rapid manufacturing capabilities to meet fluctuating demand and ensure timely delivery of goods directly to consumers, thereby boosting the demand for contract manufacturing solutions.
Market penetration rates vary across different segments, with highly regulated and high-value sectors like pharmaceuticals often exhibiting the highest adoption of contract manufacturing. Competitive dynamics are intensely shaped by factors such as the ability to offer competitive pricing, the demonstrable strength of technological capabilities, the cultivation of strong, long-term customer relationships, and the proven track record of quality and reliability.
Dominant Markets & Segments in US Contract Manufacturing Services Industry
The Northeast region currently dominates the US Contract Manufacturing Services market, accounting for xx% of total revenue in 2025. This dominance is primarily due to factors such as:
- Strong Concentration of End-Users: A significant number of pharmaceutical, cosmetic, and food & beverage companies operate in this region, creating higher demand.
- Developed Infrastructure: Mature infrastructure, including logistics and transportation networks, facilitates efficient operations.
- Skilled Workforce: The Northeast has a highly skilled workforce with expertise in contract manufacturing.
- Supportive Government Policies: Government initiatives and incentives promote business growth and investment in the region.
Other regions are expected to witness growth, but at a slower pace compared to the Northeast. The pharmaceutical segment is the leading market segment, driven by factors such as the increasing prevalence of chronic diseases and the growing demand for biopharmaceuticals.
US Contract Manufacturing Services Industry Product Analysis
The US Contract Manufacturing Services (CMS) industry offers a comprehensive suite of specialized services designed to meet the diverse needs of its clientele. These services extend beyond mere production to encompass critical areas such as formulation development, advanced analytical testing, sterile filling, packaging, and sophisticated labeling. The market is witnessing a strong emphasis on innovation aimed at elevating process efficiency, guaranteeing superior product quality, and ensuring unwavering adherence to regulatory mandates. Key technological advancements driving this evolution include the widespread adoption of automation and robotics, the strategic implementation of data analytics for process optimization, and the integration of Industry 4.0 principles to create smart, interconnected manufacturing environments.
The competitive landscape is fiercely contested, with success largely dependent on a provider's ability to deliver tailored, end-to-end solutions, maintain impeccable on-time delivery records, and uphold the highest standards of product quality and consistency. The increasing demand for agile, flexible, and adaptable manufacturing processes is a significant influence on product innovation within the CMS sector. This focus ensures that contract manufacturers can swiftly respond to evolving customer specifications and dynamic market demands, thereby solidifying their role as indispensable partners in product development and commercialization.
Key Drivers, Barriers & Challenges in US Contract Manufacturing Services Industry
Key Drivers:
- Strategic Outsourcing Imperative: A fundamental driver is the ongoing strategic decision by companies across various sectors to outsource manufacturing operations. This allows them to concentrate resources and efforts on core competencies such as innovation, research, and market development, while relying on specialized contract manufacturers for efficient and cost-effective production.
- Technological Advancements and Digitalization: The rapid pace of technological innovation, including automation, AI, machine learning, and advanced analytics, is a significant enabler. These technologies enhance manufacturing precision, improve operational efficiency, reduce waste, and contribute to cost savings, making contract manufacturing increasingly attractive.
- Growing Consumer Demand and Market Expansion: Rising consumer demand for a wider variety of goods, particularly in sectors like health & wellness, personal care, and specialized food products, fuels the need for flexible and scalable manufacturing capabilities. This growing market appetite directly benefits contract manufacturers.
- Focus on Core Competencies: Businesses are increasingly recognizing the value of focusing on their strengths, such as brand building, product design, and customer engagement. Outsourcing manufacturing allows them to optimize resource allocation and dedicate internal expertise to these critical areas.
Key Barriers & Challenges:
- Supply Chain Volatility and Disruptions: Global supply chain complexities, geopolitical events, and logistical challenges can significantly impact the availability of raw materials and components, leading to production delays and increased costs.
- Stringent Regulatory Compliance: Navigating and adhering to complex and evolving regulatory requirements, especially in highly regulated industries like pharmaceuticals and food, presents a significant challenge. Maintaining compliance necessitates substantial investment in quality control systems, documentation, and specialized expertise.
- Intense Pricing Pressure and Profitability Concerns: The highly competitive nature of the contract manufacturing market often leads to significant pricing pressure. This can impact profit margins, requiring manufacturers to continuously seek efficiencies and value-added services to remain competitive.
- Talent Acquisition and Retention: Securing and retaining a skilled workforce, particularly those with expertise in advanced manufacturing technologies and regulatory affairs, remains a persistent challenge for many contract manufacturers.
- Intellectual Property Protection: Ensuring the robust protection of client intellectual property (IP) is paramount and can be a complex undertaking, requiring sophisticated security measures and contractual safeguards.
Growth Drivers in the US Contract Manufacturing Services Industry Market
The US Contract Manufacturing Services market is driven by several key factors including increasing outsourcing by companies to reduce operational costs and focus on core competencies, continuous technological advancements such as automation and AI which increase efficiency and product quality, and rising demand for customized products catering to diverse consumer preferences. The growth of specific sectors such as pharmaceuticals and food and beverage contributes significantly to market expansion.
Challenges Impacting US Contract Manufacturing Services Industry Growth
The US CMS industry faces challenges including supply chain disruptions impacting raw material availability and lead times, increasing regulatory complexities and costs related to compliance, and intense competition leading to pricing pressures and reduced profit margins. These factors collectively hinder industry growth and require proactive strategies for mitigation.
Key Players Shaping the US Contract Manufacturing Services Industry Market
- Catalent Inc
- Jubilant Bioscience (Part of Jubilant Pharmova Limited)
- Lonza Group
- Aenova Group
- Amerilab Technologies Inc.
- Bernet Food & Beverage
- Big Brands LLC
- Delamaine Fine Foods Limited
- Brooklyn Bottling
- CSD Co-Packers
- Southeast Bottling & Beverages
- G3 Enterprises
- Western Innovations
- Niagara Bottling
- KIK Custom Products
- Sensible Organics
- Colep
- Cosmetic Essence LLC
- Formula Corp
- Robinsons Breweries (Part of Britvic)
Significant US Contract Manufacturing Services Industry Industry Milestones
- July 2021: Catalent Inc launched GPEx lightning, a next-generation cell lighting technology, shortening drug development timelines by three months. This significantly enhanced the company's competitive advantage.
- May 2022: Lonza and the Israel Biotech Fund collaborated on a framework agreement to support biologics and small molecule development and manufacturing, facilitating Lonza's access to the Israeli market. This strategic partnership expanded Lonza's global reach and market opportunities.
Future Outlook for US Contract Manufacturing Services Industry Market
The US Contract Manufacturing Services industry is poised for continued growth, driven by technological innovation, increasing outsourcing trends, and rising demand across key sectors. Strategic opportunities exist in leveraging advanced technologies like AI and automation to enhance efficiency and offer customized solutions. The market's future hinges on navigating supply chain challenges, adapting to regulatory changes, and maintaining a competitive edge through innovation and strategic partnerships. The market is expected to reach xx Million by 2033.
US Contract Manufacturing Services Industry Segmentation
-
1. pharmaceutical
- 1.1. Current Market Scenario and growth influencers
- 1.2. Market B
-
1.3. Active P
- 1.3.1. Small molecule
- 1.3.2. Large Molecule
- 1.3.3. High Potency API (HPAPI)
-
1.4. Finished
- 1.4.1. Solid Dose Formulation
- 1.4.2. Liquid Dose Formulation
- 1.4.3. Injectable Dose Formulation
- 1.5. Secondary Packaging
-
2. Food processing & manufacturing
- 2.1. Market Breakdown - by Service Type
- 2.2. Current Market Scenario and growth influencers
-
2.3. Food Manufacturing Services
- 2.3.1. Convenience Foods
- 2.3.2. Bakery Products
- 2.3.3. Confectionary Products
- 2.3.4. Dairy Products
- 2.3.5. Research & Development
- 2.3.6. Food Packaging Services
-
3. Beverage
- 3.1. Current Market Scenario and growth influencers
-
3.2. Market B
- 3.2.1. Beer
- 3.2.2. Carbonated Drinks & Fruit-based Beverages
- 3.2.3. Bottled Water
- 3.2.4. Others (Sport Drinks)
-
4. Personal Care
- 4.1. Current Market Scenario and growth influencers
-
4.2. Market Breakdown - by Type
- 4.2.1. Skin Care
- 4.2.2. Hair Care
- 4.2.3. Make up & Color Cosmetics
- 4.2.4. Others
US Contract Manufacturing Services Industry Segmentation By Geography
-
1. North America
- 1.1. United States
- 1.2. Canada
- 1.3. Mexico
-
2. South America
- 2.1. Brazil
- 2.2. Argentina
- 2.3. Rest of South America
-
3. Europe
- 3.1. United Kingdom
- 3.2. Germany
- 3.3. France
- 3.4. Italy
- 3.5. Spain
- 3.6. Russia
- 3.7. Benelux
- 3.8. Nordics
- 3.9. Rest of Europe
-
4. Middle East & Africa
- 4.1. Turkey
- 4.2. Israel
- 4.3. GCC
- 4.4. North Africa
- 4.5. South Africa
- 4.6. Rest of Middle East & Africa
-
5. Asia Pacific
- 5.1. China
- 5.2. India
- 5.3. Japan
- 5.4. South Korea
- 5.5. ASEAN
- 5.6. Oceania
- 5.7. Rest of Asia Pacific
US Contract Manufacturing Services Industry Regional Market Share
Geographic Coverage of US Contract Manufacturing Services Industry
US Contract Manufacturing Services Industry REPORT HIGHLIGHTS
| Aspects | Details |
|---|---|
| Study Period | 2020-2034 |
| Base Year | 2025 |
| Estimated Year | 2026 |
| Forecast Period | 2026-2034 |
| Historical Period | 2020-2025 |
| Growth Rate | CAGR of 6.8% from 2020-2034 |
| Segmentation |
|
Table of Contents
- 1. Introduction
- 1.1. Research Scope
- 1.2. Market Segmentation
- 1.3. Research Objective
- 1.4. Definitions and Assumptions
- 2. Executive Summary
- 2.1. Market Snapshot
- 3. Market Dynamics
- 3.1. Market Drivers
- 3.2. Market Restrains
- 3.3. Market Trends
- 3.4. Market Opportunities
- 4. Market Factor Analysis
- 4.1. Porters Five Forces
- 4.1.1. Bargaining Power of Suppliers
- 4.1.2. Bargaining Power of Buyers
- 4.1.3. Threat of New Entrants
- 4.1.4. Threat of Substitutes
- 4.1.5. Competitive Rivalry
- 4.2. PESTEL analysis
- 4.3. BCG Analysis
- 4.3.1. Stars (High Growth, High Market Share)
- 4.3.2. Cash Cows (Low Growth, High Market Share)
- 4.3.3. Question Mark (High Growth, Low Market Share)
- 4.3.4. Dogs (Low Growth, Low Market Share)
- 4.4. Ansoff Matrix Analysis
- 4.5. Supply Chain Analysis
- 4.6. Regulatory Landscape
- 4.7. Current Market Potential and Opportunity Assessment (TAM–SAM–SOM Framework)
- 4.8. TIR Analyst Note
- 4.1. Porters Five Forces
- 5. Market Analysis, Insights and Forecast 2021-2033
- 5.1. Market Analysis, Insights and Forecast - by pharmaceutical
- 5.1.1. Current Market Scenario and growth influencers
- 5.1.2. Market B
- 5.1.3. Active P
- 5.1.3.1. Small molecule
- 5.1.3.2. Large Molecule
- 5.1.3.3. High Potency API (HPAPI)
- 5.1.4. Finished
- 5.1.4.1. Solid Dose Formulation
- 5.1.4.2. Liquid Dose Formulation
- 5.1.4.3. Injectable Dose Formulation
- 5.1.5. Secondary Packaging
- 5.2. Market Analysis, Insights and Forecast - by Food processing & manufacturing
- 5.2.1. Market Breakdown - by Service Type
- 5.2.2. Current Market Scenario and growth influencers
- 5.2.3. Food Manufacturing Services
- 5.2.3.1. Convenience Foods
- 5.2.3.2. Bakery Products
- 5.2.3.3. Confectionary Products
- 5.2.3.4. Dairy Products
- 5.2.3.5. Research & Development
- 5.2.3.6. Food Packaging Services
- 5.3. Market Analysis, Insights and Forecast - by Beverage
- 5.3.1. Current Market Scenario and growth influencers
- 5.3.2. Market B
- 5.3.2.1. Beer
- 5.3.2.2. Carbonated Drinks & Fruit-based Beverages
- 5.3.2.3. Bottled Water
- 5.3.2.4. Others (Sport Drinks)
- 5.4. Market Analysis, Insights and Forecast - by Personal Care
- 5.4.1. Current Market Scenario and growth influencers
- 5.4.2. Market Breakdown - by Type
- 5.4.2.1. Skin Care
- 5.4.2.2. Hair Care
- 5.4.2.3. Make up & Color Cosmetics
- 5.4.2.4. Others
- 5.5. Market Analysis, Insights and Forecast - by Region
- 5.5.1. North America
- 5.5.2. South America
- 5.5.3. Europe
- 5.5.4. Middle East & Africa
- 5.5.5. Asia Pacific
- 5.1. Market Analysis, Insights and Forecast - by pharmaceutical
- 6. Global US Contract Manufacturing Services Industry Analysis, Insights and Forecast, 2021-2033
- 6.1. Market Analysis, Insights and Forecast - by pharmaceutical
- 6.1.1. Current Market Scenario and growth influencers
- 6.1.2. Market B
- 6.1.3. Active P
- 6.1.3.1. Small molecule
- 6.1.3.2. Large Molecule
- 6.1.3.3. High Potency API (HPAPI)
- 6.1.4. Finished
- 6.1.4.1. Solid Dose Formulation
- 6.1.4.2. Liquid Dose Formulation
- 6.1.4.3. Injectable Dose Formulation
- 6.1.5. Secondary Packaging
- 6.2. Market Analysis, Insights and Forecast - by Food processing & manufacturing
- 6.2.1. Market Breakdown - by Service Type
- 6.2.2. Current Market Scenario and growth influencers
- 6.2.3. Food Manufacturing Services
- 6.2.3.1. Convenience Foods
- 6.2.3.2. Bakery Products
- 6.2.3.3. Confectionary Products
- 6.2.3.4. Dairy Products
- 6.2.3.5. Research & Development
- 6.2.3.6. Food Packaging Services
- 6.3. Market Analysis, Insights and Forecast - by Beverage
- 6.3.1. Current Market Scenario and growth influencers
- 6.3.2. Market B
- 6.3.2.1. Beer
- 6.3.2.2. Carbonated Drinks & Fruit-based Beverages
- 6.3.2.3. Bottled Water
- 6.3.2.4. Others (Sport Drinks)
- 6.4. Market Analysis, Insights and Forecast - by Personal Care
- 6.4.1. Current Market Scenario and growth influencers
- 6.4.2. Market Breakdown - by Type
- 6.4.2.1. Skin Care
- 6.4.2.2. Hair Care
- 6.4.2.3. Make up & Color Cosmetics
- 6.4.2.4. Others
- 6.1. Market Analysis, Insights and Forecast - by pharmaceutical
- 7. North America US Contract Manufacturing Services Industry Analysis, Insights and Forecast, 2020-2032
- 7.1. Market Analysis, Insights and Forecast - by pharmaceutical
- 7.1.1. Current Market Scenario and growth influencers
- 7.1.2. Market B
- 7.1.3. Active P
- 7.1.3.1. Small molecule
- 7.1.3.2. Large Molecule
- 7.1.3.3. High Potency API (HPAPI)
- 7.1.4. Finished
- 7.1.4.1. Solid Dose Formulation
- 7.1.4.2. Liquid Dose Formulation
- 7.1.4.3. Injectable Dose Formulation
- 7.1.5. Secondary Packaging
- 7.2. Market Analysis, Insights and Forecast - by Food processing & manufacturing
- 7.2.1. Market Breakdown - by Service Type
- 7.2.2. Current Market Scenario and growth influencers
- 7.2.3. Food Manufacturing Services
- 7.2.3.1. Convenience Foods
- 7.2.3.2. Bakery Products
- 7.2.3.3. Confectionary Products
- 7.2.3.4. Dairy Products
- 7.2.3.5. Research & Development
- 7.2.3.6. Food Packaging Services
- 7.3. Market Analysis, Insights and Forecast - by Beverage
- 7.3.1. Current Market Scenario and growth influencers
- 7.3.2. Market B
- 7.3.2.1. Beer
- 7.3.2.2. Carbonated Drinks & Fruit-based Beverages
- 7.3.2.3. Bottled Water
- 7.3.2.4. Others (Sport Drinks)
- 7.4. Market Analysis, Insights and Forecast - by Personal Care
- 7.4.1. Current Market Scenario and growth influencers
- 7.4.2. Market Breakdown - by Type
- 7.4.2.1. Skin Care
- 7.4.2.2. Hair Care
- 7.4.2.3. Make up & Color Cosmetics
- 7.4.2.4. Others
- 7.1. Market Analysis, Insights and Forecast - by pharmaceutical
- 8. South America US Contract Manufacturing Services Industry Analysis, Insights and Forecast, 2020-2032
- 8.1. Market Analysis, Insights and Forecast - by pharmaceutical
- 8.1.1. Current Market Scenario and growth influencers
- 8.1.2. Market B
- 8.1.3. Active P
- 8.1.3.1. Small molecule
- 8.1.3.2. Large Molecule
- 8.1.3.3. High Potency API (HPAPI)
- 8.1.4. Finished
- 8.1.4.1. Solid Dose Formulation
- 8.1.4.2. Liquid Dose Formulation
- 8.1.4.3. Injectable Dose Formulation
- 8.1.5. Secondary Packaging
- 8.2. Market Analysis, Insights and Forecast - by Food processing & manufacturing
- 8.2.1. Market Breakdown - by Service Type
- 8.2.2. Current Market Scenario and growth influencers
- 8.2.3. Food Manufacturing Services
- 8.2.3.1. Convenience Foods
- 8.2.3.2. Bakery Products
- 8.2.3.3. Confectionary Products
- 8.2.3.4. Dairy Products
- 8.2.3.5. Research & Development
- 8.2.3.6. Food Packaging Services
- 8.3. Market Analysis, Insights and Forecast - by Beverage
- 8.3.1. Current Market Scenario and growth influencers
- 8.3.2. Market B
- 8.3.2.1. Beer
- 8.3.2.2. Carbonated Drinks & Fruit-based Beverages
- 8.3.2.3. Bottled Water
- 8.3.2.4. Others (Sport Drinks)
- 8.4. Market Analysis, Insights and Forecast - by Personal Care
- 8.4.1. Current Market Scenario and growth influencers
- 8.4.2. Market Breakdown - by Type
- 8.4.2.1. Skin Care
- 8.4.2.2. Hair Care
- 8.4.2.3. Make up & Color Cosmetics
- 8.4.2.4. Others
- 8.1. Market Analysis, Insights and Forecast - by pharmaceutical
- 9. Europe US Contract Manufacturing Services Industry Analysis, Insights and Forecast, 2020-2032
- 9.1. Market Analysis, Insights and Forecast - by pharmaceutical
- 9.1.1. Current Market Scenario and growth influencers
- 9.1.2. Market B
- 9.1.3. Active P
- 9.1.3.1. Small molecule
- 9.1.3.2. Large Molecule
- 9.1.3.3. High Potency API (HPAPI)
- 9.1.4. Finished
- 9.1.4.1. Solid Dose Formulation
- 9.1.4.2. Liquid Dose Formulation
- 9.1.4.3. Injectable Dose Formulation
- 9.1.5. Secondary Packaging
- 9.2. Market Analysis, Insights and Forecast - by Food processing & manufacturing
- 9.2.1. Market Breakdown - by Service Type
- 9.2.2. Current Market Scenario and growth influencers
- 9.2.3. Food Manufacturing Services
- 9.2.3.1. Convenience Foods
- 9.2.3.2. Bakery Products
- 9.2.3.3. Confectionary Products
- 9.2.3.4. Dairy Products
- 9.2.3.5. Research & Development
- 9.2.3.6. Food Packaging Services
- 9.3. Market Analysis, Insights and Forecast - by Beverage
- 9.3.1. Current Market Scenario and growth influencers
- 9.3.2. Market B
- 9.3.2.1. Beer
- 9.3.2.2. Carbonated Drinks & Fruit-based Beverages
- 9.3.2.3. Bottled Water
- 9.3.2.4. Others (Sport Drinks)
- 9.4. Market Analysis, Insights and Forecast - by Personal Care
- 9.4.1. Current Market Scenario and growth influencers
- 9.4.2. Market Breakdown - by Type
- 9.4.2.1. Skin Care
- 9.4.2.2. Hair Care
- 9.4.2.3. Make up & Color Cosmetics
- 9.4.2.4. Others
- 9.1. Market Analysis, Insights and Forecast - by pharmaceutical
- 10. Middle East & Africa US Contract Manufacturing Services Industry Analysis, Insights and Forecast, 2020-2032
- 10.1. Market Analysis, Insights and Forecast - by pharmaceutical
- 10.1.1. Current Market Scenario and growth influencers
- 10.1.2. Market B
- 10.1.3. Active P
- 10.1.3.1. Small molecule
- 10.1.3.2. Large Molecule
- 10.1.3.3. High Potency API (HPAPI)
- 10.1.4. Finished
- 10.1.4.1. Solid Dose Formulation
- 10.1.4.2. Liquid Dose Formulation
- 10.1.4.3. Injectable Dose Formulation
- 10.1.5. Secondary Packaging
- 10.2. Market Analysis, Insights and Forecast - by Food processing & manufacturing
- 10.2.1. Market Breakdown - by Service Type
- 10.2.2. Current Market Scenario and growth influencers
- 10.2.3. Food Manufacturing Services
- 10.2.3.1. Convenience Foods
- 10.2.3.2. Bakery Products
- 10.2.3.3. Confectionary Products
- 10.2.3.4. Dairy Products
- 10.2.3.5. Research & Development
- 10.2.3.6. Food Packaging Services
- 10.3. Market Analysis, Insights and Forecast - by Beverage
- 10.3.1. Current Market Scenario and growth influencers
- 10.3.2. Market B
- 10.3.2.1. Beer
- 10.3.2.2. Carbonated Drinks & Fruit-based Beverages
- 10.3.2.3. Bottled Water
- 10.3.2.4. Others (Sport Drinks)
- 10.4. Market Analysis, Insights and Forecast - by Personal Care
- 10.4.1. Current Market Scenario and growth influencers
- 10.4.2. Market Breakdown - by Type
- 10.4.2.1. Skin Care
- 10.4.2.2. Hair Care
- 10.4.2.3. Make up & Color Cosmetics
- 10.4.2.4. Others
- 10.1. Market Analysis, Insights and Forecast - by pharmaceutical
- 11. Asia Pacific US Contract Manufacturing Services Industry Analysis, Insights and Forecast, 2020-2032
- 11.1. Market Analysis, Insights and Forecast - by pharmaceutical
- 11.1.1. Current Market Scenario and growth influencers
- 11.1.2. Market B
- 11.1.3. Active P
- 11.1.3.1. Small molecule
- 11.1.3.2. Large Molecule
- 11.1.3.3. High Potency API (HPAPI)
- 11.1.4. Finished
- 11.1.4.1. Solid Dose Formulation
- 11.1.4.2. Liquid Dose Formulation
- 11.1.4.3. Injectable Dose Formulation
- 11.1.5. Secondary Packaging
- 11.2. Market Analysis, Insights and Forecast - by Food processing & manufacturing
- 11.2.1. Market Breakdown - by Service Type
- 11.2.2. Current Market Scenario and growth influencers
- 11.2.3. Food Manufacturing Services
- 11.2.3.1. Convenience Foods
- 11.2.3.2. Bakery Products
- 11.2.3.3. Confectionary Products
- 11.2.3.4. Dairy Products
- 11.2.3.5. Research & Development
- 11.2.3.6. Food Packaging Services
- 11.3. Market Analysis, Insights and Forecast - by Beverage
- 11.3.1. Current Market Scenario and growth influencers
- 11.3.2. Market B
- 11.3.2.1. Beer
- 11.3.2.2. Carbonated Drinks & Fruit-based Beverages
- 11.3.2.3. Bottled Water
- 11.3.2.4. Others (Sport Drinks)
- 11.4. Market Analysis, Insights and Forecast - by Personal Care
- 11.4.1. Current Market Scenario and growth influencers
- 11.4.2. Market Breakdown - by Type
- 11.4.2.1. Skin Care
- 11.4.2.2. Hair Care
- 11.4.2.3. Make up & Color Cosmetics
- 11.4.2.4. Others
- 11.1. Market Analysis, Insights and Forecast - by pharmaceutical
- 12. Competitive Analysis
- 12.1. Company Profiles
- 12.1.1 Catalent Inc
- 12.1.1.1. Company Overview
- 12.1.1.2. Products
- 12.1.1.3. Company Financials
- 12.1.1.4. SWOT Analysis
- 12.1.2 Jubilant
- 12.1.2.1. Company Overview
- 12.1.2.2. Products
- 12.1.2.3. Company Financials
- 12.1.2.4. SWOT Analysis
- 12.1.3 Lonza Group
- 12.1.3.1. Company Overview
- 12.1.3.2. Products
- 12.1.3.3. Company Financials
- 12.1.3.4. SWOT Analysis
- 12.1.4 Aenova Group
- 12.1.4.1. Company Overview
- 12.1.4.2. Products
- 12.1.4.3. Company Financials
- 12.1.4.4. SWOT Analysis
- 12.1.5 Amerilab Technologies Inc
- 12.1.5.1. Company Overview
- 12.1.5.2. Products
- 12.1.5.3. Company Financials
- 12.1.5.4. SWOT Analysis
- 12.1.6 Bernet Food & Beverage
- 12.1.6.1. Company Overview
- 12.1.6.2. Products
- 12.1.6.3. Company Financials
- 12.1.6.4. SWOT Analysis
- 12.1.7 Big Brands LLC
- 12.1.7.1. Company Overview
- 12.1.7.2. Products
- 12.1.7.3. Company Financials
- 12.1.7.4. SWOT Analysis
- 12.1.8 Delamaine Fine Foods Limited
- 12.1.8.1. Company Overview
- 12.1.8.2. Products
- 12.1.8.3. Company Financials
- 12.1.8.4. SWOT Analysis
- 12.1.9 Brooklyn Bottling
- 12.1.9.1. Company Overview
- 12.1.9.2. Products
- 12.1.9.3. Company Financials
- 12.1.9.4. SWOT Analysis
- 12.1.10 CSD Co-Packers
- 12.1.10.1. Company Overview
- 12.1.10.2. Products
- 12.1.10.3. Company Financials
- 12.1.10.4. SWOT Analysis
- 12.1.11 Southeast Bottling & Beverages
- 12.1.11.1. Company Overview
- 12.1.11.2. Products
- 12.1.11.3. Company Financials
- 12.1.11.4. SWOT Analysis
- 12.1.12 G3 Enterprises
- 12.1.12.1. Company Overview
- 12.1.12.2. Products
- 12.1.12.3. Company Financials
- 12.1.12.4. SWOT Analysis
- 12.1.13 Western Innovations
- 12.1.13.1. Company Overview
- 12.1.13.2. Products
- 12.1.13.3. Company Financials
- 12.1.13.4. SWOT Analysis
- 12.1.14 Niagara Bottling and Robinsons Breweries
- 12.1.14.1. Company Overview
- 12.1.14.2. Products
- 12.1.14.3. Company Financials
- 12.1.14.4. SWOT Analysis
- 12.1.15 KIK Custom Products
- 12.1.15.1. Company Overview
- 12.1.15.2. Products
- 12.1.15.3. Company Financials
- 12.1.15.4. SWOT Analysis
- 12.1.16 Sensible Organics
- 12.1.16.1. Company Overview
- 12.1.16.2. Products
- 12.1.16.3. Company Financials
- 12.1.16.4. SWOT Analysis
- 12.1.17 Colep
- 12.1.17.1. Company Overview
- 12.1.17.2. Products
- 12.1.17.3. Company Financials
- 12.1.17.4. SWOT Analysis
- 12.1.18 Cosmetic Essence LLC
- 12.1.18.1. Company Overview
- 12.1.18.2. Products
- 12.1.18.3. Company Financials
- 12.1.18.4. SWOT Analysis
- 12.1.19 Formula Cap*List Not Exhaustive
- 12.1.19.1. Company Overview
- 12.1.19.2. Products
- 12.1.19.3. Company Financials
- 12.1.19.4. SWOT Analysis
- 12.1.1 Catalent Inc
- 12.2. Market Entropy
- 12.2.1 Company's Key Areas Served
- 12.2.2 Recent Developments
- 12.3. Company Market Share Analysis 2025
- 12.3.1 Top 5 Companies Market Share Analysis
- 12.3.2 Top 3 Companies Market Share Analysis
- 12.4. List of Potential Customers
- 13. Research Methodology
List of Figures
- Figure 1: Global US Contract Manufacturing Services Industry Revenue Breakdown (billion, %) by Region 2025 & 2033
- Figure 2: North America US Contract Manufacturing Services Industry Revenue (billion), by pharmaceutical 2025 & 2033
- Figure 3: North America US Contract Manufacturing Services Industry Revenue Share (%), by pharmaceutical 2025 & 2033
- Figure 4: North America US Contract Manufacturing Services Industry Revenue (billion), by Food processing & manufacturing 2025 & 2033
- Figure 5: North America US Contract Manufacturing Services Industry Revenue Share (%), by Food processing & manufacturing 2025 & 2033
- Figure 6: North America US Contract Manufacturing Services Industry Revenue (billion), by Beverage 2025 & 2033
- Figure 7: North America US Contract Manufacturing Services Industry Revenue Share (%), by Beverage 2025 & 2033
- Figure 8: North America US Contract Manufacturing Services Industry Revenue (billion), by Personal Care 2025 & 2033
- Figure 9: North America US Contract Manufacturing Services Industry Revenue Share (%), by Personal Care 2025 & 2033
- Figure 10: North America US Contract Manufacturing Services Industry Revenue (billion), by Country 2025 & 2033
- Figure 11: North America US Contract Manufacturing Services Industry Revenue Share (%), by Country 2025 & 2033
- Figure 12: South America US Contract Manufacturing Services Industry Revenue (billion), by pharmaceutical 2025 & 2033
- Figure 13: South America US Contract Manufacturing Services Industry Revenue Share (%), by pharmaceutical 2025 & 2033
- Figure 14: South America US Contract Manufacturing Services Industry Revenue (billion), by Food processing & manufacturing 2025 & 2033
- Figure 15: South America US Contract Manufacturing Services Industry Revenue Share (%), by Food processing & manufacturing 2025 & 2033
- Figure 16: South America US Contract Manufacturing Services Industry Revenue (billion), by Beverage 2025 & 2033
- Figure 17: South America US Contract Manufacturing Services Industry Revenue Share (%), by Beverage 2025 & 2033
- Figure 18: South America US Contract Manufacturing Services Industry Revenue (billion), by Personal Care 2025 & 2033
- Figure 19: South America US Contract Manufacturing Services Industry Revenue Share (%), by Personal Care 2025 & 2033
- Figure 20: South America US Contract Manufacturing Services Industry Revenue (billion), by Country 2025 & 2033
- Figure 21: South America US Contract Manufacturing Services Industry Revenue Share (%), by Country 2025 & 2033
- Figure 22: Europe US Contract Manufacturing Services Industry Revenue (billion), by pharmaceutical 2025 & 2033
- Figure 23: Europe US Contract Manufacturing Services Industry Revenue Share (%), by pharmaceutical 2025 & 2033
- Figure 24: Europe US Contract Manufacturing Services Industry Revenue (billion), by Food processing & manufacturing 2025 & 2033
- Figure 25: Europe US Contract Manufacturing Services Industry Revenue Share (%), by Food processing & manufacturing 2025 & 2033
- Figure 26: Europe US Contract Manufacturing Services Industry Revenue (billion), by Beverage 2025 & 2033
- Figure 27: Europe US Contract Manufacturing Services Industry Revenue Share (%), by Beverage 2025 & 2033
- Figure 28: Europe US Contract Manufacturing Services Industry Revenue (billion), by Personal Care 2025 & 2033
- Figure 29: Europe US Contract Manufacturing Services Industry Revenue Share (%), by Personal Care 2025 & 2033
- Figure 30: Europe US Contract Manufacturing Services Industry Revenue (billion), by Country 2025 & 2033
- Figure 31: Europe US Contract Manufacturing Services Industry Revenue Share (%), by Country 2025 & 2033
- Figure 32: Middle East & Africa US Contract Manufacturing Services Industry Revenue (billion), by pharmaceutical 2025 & 2033
- Figure 33: Middle East & Africa US Contract Manufacturing Services Industry Revenue Share (%), by pharmaceutical 2025 & 2033
- Figure 34: Middle East & Africa US Contract Manufacturing Services Industry Revenue (billion), by Food processing & manufacturing 2025 & 2033
- Figure 35: Middle East & Africa US Contract Manufacturing Services Industry Revenue Share (%), by Food processing & manufacturing 2025 & 2033
- Figure 36: Middle East & Africa US Contract Manufacturing Services Industry Revenue (billion), by Beverage 2025 & 2033
- Figure 37: Middle East & Africa US Contract Manufacturing Services Industry Revenue Share (%), by Beverage 2025 & 2033
- Figure 38: Middle East & Africa US Contract Manufacturing Services Industry Revenue (billion), by Personal Care 2025 & 2033
- Figure 39: Middle East & Africa US Contract Manufacturing Services Industry Revenue Share (%), by Personal Care 2025 & 2033
- Figure 40: Middle East & Africa US Contract Manufacturing Services Industry Revenue (billion), by Country 2025 & 2033
- Figure 41: Middle East & Africa US Contract Manufacturing Services Industry Revenue Share (%), by Country 2025 & 2033
- Figure 42: Asia Pacific US Contract Manufacturing Services Industry Revenue (billion), by pharmaceutical 2025 & 2033
- Figure 43: Asia Pacific US Contract Manufacturing Services Industry Revenue Share (%), by pharmaceutical 2025 & 2033
- Figure 44: Asia Pacific US Contract Manufacturing Services Industry Revenue (billion), by Food processing & manufacturing 2025 & 2033
- Figure 45: Asia Pacific US Contract Manufacturing Services Industry Revenue Share (%), by Food processing & manufacturing 2025 & 2033
- Figure 46: Asia Pacific US Contract Manufacturing Services Industry Revenue (billion), by Beverage 2025 & 2033
- Figure 47: Asia Pacific US Contract Manufacturing Services Industry Revenue Share (%), by Beverage 2025 & 2033
- Figure 48: Asia Pacific US Contract Manufacturing Services Industry Revenue (billion), by Personal Care 2025 & 2033
- Figure 49: Asia Pacific US Contract Manufacturing Services Industry Revenue Share (%), by Personal Care 2025 & 2033
- Figure 50: Asia Pacific US Contract Manufacturing Services Industry Revenue (billion), by Country 2025 & 2033
- Figure 51: Asia Pacific US Contract Manufacturing Services Industry Revenue Share (%), by Country 2025 & 2033
List of Tables
- Table 1: Global US Contract Manufacturing Services Industry Revenue billion Forecast, by pharmaceutical 2020 & 2033
- Table 2: Global US Contract Manufacturing Services Industry Revenue billion Forecast, by Food processing & manufacturing 2020 & 2033
- Table 3: Global US Contract Manufacturing Services Industry Revenue billion Forecast, by Beverage 2020 & 2033
- Table 4: Global US Contract Manufacturing Services Industry Revenue billion Forecast, by Personal Care 2020 & 2033
- Table 5: Global US Contract Manufacturing Services Industry Revenue billion Forecast, by Region 2020 & 2033
- Table 6: Global US Contract Manufacturing Services Industry Revenue billion Forecast, by pharmaceutical 2020 & 2033
- Table 7: Global US Contract Manufacturing Services Industry Revenue billion Forecast, by Food processing & manufacturing 2020 & 2033
- Table 8: Global US Contract Manufacturing Services Industry Revenue billion Forecast, by Beverage 2020 & 2033
- Table 9: Global US Contract Manufacturing Services Industry Revenue billion Forecast, by Personal Care 2020 & 2033
- Table 10: Global US Contract Manufacturing Services Industry Revenue billion Forecast, by Country 2020 & 2033
- Table 11: United States US Contract Manufacturing Services Industry Revenue (billion) Forecast, by Application 2020 & 2033
- Table 12: Canada US Contract Manufacturing Services Industry Revenue (billion) Forecast, by Application 2020 & 2033
- Table 13: Mexico US Contract Manufacturing Services Industry Revenue (billion) Forecast, by Application 2020 & 2033
- Table 14: Global US Contract Manufacturing Services Industry Revenue billion Forecast, by pharmaceutical 2020 & 2033
- Table 15: Global US Contract Manufacturing Services Industry Revenue billion Forecast, by Food processing & manufacturing 2020 & 2033
- Table 16: Global US Contract Manufacturing Services Industry Revenue billion Forecast, by Beverage 2020 & 2033
- Table 17: Global US Contract Manufacturing Services Industry Revenue billion Forecast, by Personal Care 2020 & 2033
- Table 18: Global US Contract Manufacturing Services Industry Revenue billion Forecast, by Country 2020 & 2033
- Table 19: Brazil US Contract Manufacturing Services Industry Revenue (billion) Forecast, by Application 2020 & 2033
- Table 20: Argentina US Contract Manufacturing Services Industry Revenue (billion) Forecast, by Application 2020 & 2033
- Table 21: Rest of South America US Contract Manufacturing Services Industry Revenue (billion) Forecast, by Application 2020 & 2033
- Table 22: Global US Contract Manufacturing Services Industry Revenue billion Forecast, by pharmaceutical 2020 & 2033
- Table 23: Global US Contract Manufacturing Services Industry Revenue billion Forecast, by Food processing & manufacturing 2020 & 2033
- Table 24: Global US Contract Manufacturing Services Industry Revenue billion Forecast, by Beverage 2020 & 2033
- Table 25: Global US Contract Manufacturing Services Industry Revenue billion Forecast, by Personal Care 2020 & 2033
- Table 26: Global US Contract Manufacturing Services Industry Revenue billion Forecast, by Country 2020 & 2033
- Table 27: United Kingdom US Contract Manufacturing Services Industry Revenue (billion) Forecast, by Application 2020 & 2033
- Table 28: Germany US Contract Manufacturing Services Industry Revenue (billion) Forecast, by Application 2020 & 2033
- Table 29: France US Contract Manufacturing Services Industry Revenue (billion) Forecast, by Application 2020 & 2033
- Table 30: Italy US Contract Manufacturing Services Industry Revenue (billion) Forecast, by Application 2020 & 2033
- Table 31: Spain US Contract Manufacturing Services Industry Revenue (billion) Forecast, by Application 2020 & 2033
- Table 32: Russia US Contract Manufacturing Services Industry Revenue (billion) Forecast, by Application 2020 & 2033
- Table 33: Benelux US Contract Manufacturing Services Industry Revenue (billion) Forecast, by Application 2020 & 2033
- Table 34: Nordics US Contract Manufacturing Services Industry Revenue (billion) Forecast, by Application 2020 & 2033
- Table 35: Rest of Europe US Contract Manufacturing Services Industry Revenue (billion) Forecast, by Application 2020 & 2033
- Table 36: Global US Contract Manufacturing Services Industry Revenue billion Forecast, by pharmaceutical 2020 & 2033
- Table 37: Global US Contract Manufacturing Services Industry Revenue billion Forecast, by Food processing & manufacturing 2020 & 2033
- Table 38: Global US Contract Manufacturing Services Industry Revenue billion Forecast, by Beverage 2020 & 2033
- Table 39: Global US Contract Manufacturing Services Industry Revenue billion Forecast, by Personal Care 2020 & 2033
- Table 40: Global US Contract Manufacturing Services Industry Revenue billion Forecast, by Country 2020 & 2033
- Table 41: Turkey US Contract Manufacturing Services Industry Revenue (billion) Forecast, by Application 2020 & 2033
- Table 42: Israel US Contract Manufacturing Services Industry Revenue (billion) Forecast, by Application 2020 & 2033
- Table 43: GCC US Contract Manufacturing Services Industry Revenue (billion) Forecast, by Application 2020 & 2033
- Table 44: North Africa US Contract Manufacturing Services Industry Revenue (billion) Forecast, by Application 2020 & 2033
- Table 45: South Africa US Contract Manufacturing Services Industry Revenue (billion) Forecast, by Application 2020 & 2033
- Table 46: Rest of Middle East & Africa US Contract Manufacturing Services Industry Revenue (billion) Forecast, by Application 2020 & 2033
- Table 47: Global US Contract Manufacturing Services Industry Revenue billion Forecast, by pharmaceutical 2020 & 2033
- Table 48: Global US Contract Manufacturing Services Industry Revenue billion Forecast, by Food processing & manufacturing 2020 & 2033
- Table 49: Global US Contract Manufacturing Services Industry Revenue billion Forecast, by Beverage 2020 & 2033
- Table 50: Global US Contract Manufacturing Services Industry Revenue billion Forecast, by Personal Care 2020 & 2033
- Table 51: Global US Contract Manufacturing Services Industry Revenue billion Forecast, by Country 2020 & 2033
- Table 52: China US Contract Manufacturing Services Industry Revenue (billion) Forecast, by Application 2020 & 2033
- Table 53: India US Contract Manufacturing Services Industry Revenue (billion) Forecast, by Application 2020 & 2033
- Table 54: Japan US Contract Manufacturing Services Industry Revenue (billion) Forecast, by Application 2020 & 2033
- Table 55: South Korea US Contract Manufacturing Services Industry Revenue (billion) Forecast, by Application 2020 & 2033
- Table 56: ASEAN US Contract Manufacturing Services Industry Revenue (billion) Forecast, by Application 2020 & 2033
- Table 57: Oceania US Contract Manufacturing Services Industry Revenue (billion) Forecast, by Application 2020 & 2033
- Table 58: Rest of Asia Pacific US Contract Manufacturing Services Industry Revenue (billion) Forecast, by Application 2020 & 2033
Frequently Asked Questions
1. What is the projected Compound Annual Growth Rate (CAGR) of the US Contract Manufacturing Services Industry?
The projected CAGR is approximately 6.8%.
2. Which companies are prominent players in the US Contract Manufacturing Services Industry?
Key companies in the market include Catalent Inc, Jubilant, Lonza Group, Aenova Group, Amerilab Technologies Inc, Bernet Food & Beverage, Big Brands LLC, Delamaine Fine Foods Limited, Brooklyn Bottling, CSD Co-Packers, Southeast Bottling & Beverages, G3 Enterprises, Western Innovations, Niagara Bottling and Robinsons Breweries, KIK Custom Products, Sensible Organics, Colep, Cosmetic Essence LLC, Formula Cap*List Not Exhaustive.
3. What are the main segments of the US Contract Manufacturing Services Industry?
The market segments include pharmaceutical, Food processing & manufacturing, Beverage, Personal Care.
4. Can you provide details about the market size?
The market size is estimated to be USD 101.6 billion as of 2022.
5. What are some drivers contributing to market growth?
Evolution of service offerings has enabled organizations to increasingly rely on contract manufacturers for their production needs; Challenges due to outsourcing of manufacturing to Asian countries has played a key role in prompting organizations to rely on local contract manufacturers.
6. What are the notable trends driving market growth?
Growth of Evolution of service offerings has enabled organizations to increasingly rely on contract manufacturers for their production needs.
7. Are there any restraints impacting market growth?
Evolution of service offerings has enabled organizations to increasingly rely on contract manufacturers for their production needs; Challenges due to outsourcing of manufacturing to Asian countries has played a key role in prompting organizations to rely on local contract manufacturers.
8. Can you provide examples of recent developments in the market?
May 2022 - Lonza and Israel Biotech Fund Collaborated Framework Agreement to Support Biologics and Small Molecules Development and Manufacture for Portfolio Companies which Facilitate Access to Israeli Market for Lonza.
9. What pricing options are available for accessing the report?
Pricing options include single-user, multi-user, and enterprise licenses priced at USD 3800, USD 4500, and USD 5800 respectively.
10. Is the market size provided in terms of value or volume?
The market size is provided in terms of value, measured in billion.
11. Are there any specific market keywords associated with the report?
Yes, the market keyword associated with the report is "US Contract Manufacturing Services Industry," which aids in identifying and referencing the specific market segment covered.
12. How do I determine which pricing option suits my needs best?
The pricing options vary based on user requirements and access needs. Individual users may opt for single-user licenses, while businesses requiring broader access may choose multi-user or enterprise licenses for cost-effective access to the report.
13. Are there any additional resources or data provided in the US Contract Manufacturing Services Industry report?
While the report offers comprehensive insights, it's advisable to review the specific contents or supplementary materials provided to ascertain if additional resources or data are available.
14. How can I stay updated on further developments or reports in the US Contract Manufacturing Services Industry?
To stay informed about further developments, trends, and reports in the US Contract Manufacturing Services Industry, consider subscribing to industry newsletters, following relevant companies and organizations, or regularly checking reputable industry news sources and publications.
Methodology
Step 1 - Identification of Relevant Samples Size from Population Database


Step 2 - Approaches for Defining Global Market Size (Value, Volume* & Price*)

Note*: In applicable scenarios
Step 3 - Data Sources
Primary Research
- Web Analytics
- Survey Reports
- Research Institute
- Latest Research Reports
- Opinion Leaders
Secondary Research
- Annual Reports
- White Paper
- Latest Press Release
- Industry Association
- Paid Database
- Investor Presentations

Step 4 - Data Triangulation
Involves using different sources of information in order to increase the validity of a study
These sources are likely to be stakeholders in a program - participants, other researchers, program staff, other community members, and so on.
Then we put all data in single framework & apply various statistical tools to find out the dynamic on the market.
During the analysis stage, feedback from the stakeholder groups would be compared to determine areas of agreement as well as areas of divergence