

Key Insights
The global office real estate market, valued at $2.10 trillion in 2025, is projected to experience robust growth, exhibiting a compound annual growth rate (CAGR) exceeding 5.17% from 2025 to 2033. This expansion is driven by several key factors. The increasing urbanization and globalization trends are fueling demand for modern, efficient office spaces, particularly in major metropolitan areas. Furthermore, the ongoing shift towards hybrid work models, while initially impacting demand, is ultimately reshaping the office landscape, with a focus on collaborative workspaces and amenities that attract employees. Technological advancements, such as smart building technologies and improved workplace management systems, are also contributing to market growth by enhancing efficiency and sustainability. However, economic fluctuations and the rise of remote work remain potential restraints. The market is segmented into product types (office accommodation, equipment, and services) and applications (corporate, government, and financial institutions), with significant regional variations in growth rates driven by factors such as economic development and regulatory environments. North America and Asia-Pacific are expected to be leading regions, with strong growth in key markets like the United States, China, and India. The competitive landscape is dominated by major players such as Cushman & Wakefield, JLL, and Hines, who are constantly adapting their strategies to meet evolving market demands.
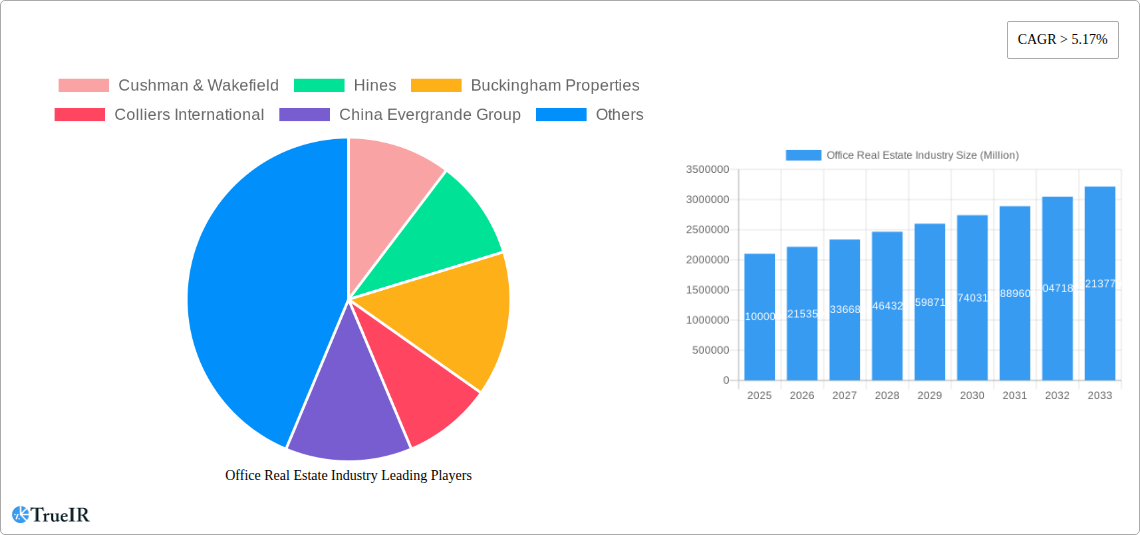
Office Real Estate Industry Market Size (In Million)
The forecast period (2025-2033) promises continued expansion, albeit at a potentially moderated pace compared to previous periods, considering the evolving work patterns. Growth will be significantly influenced by factors like the global economic climate, technological innovation, and governmental policies impacting commercial real estate. The sector will witness increased competition as firms strive to offer innovative solutions tailored to specific client needs, and the focus on sustainable and environmentally conscious building practices will become even more prominent, influencing investment decisions and shaping future market dynamics. Companies will likely continue to consolidate and diversify their portfolios, adapting to shifts in demand and incorporating cutting-edge technologies to maximize operational efficiency and attract and retain tenants.

Office Real Estate Industry Company Market Share
Dynamic Report: Office Real Estate Industry Market Analysis (2019-2033)
This comprehensive report provides a detailed analysis of the global office real estate industry, projecting a market valuation of $XX Million by 2033. The study covers the period from 2019 to 2033, with a base year of 2025 and a forecast period from 2025 to 2033. It delves into market structure, competitive dynamics, key trends, and future growth prospects, offering invaluable insights for investors, industry professionals, and strategic decision-makers.
Office Real Estate Industry Market Structure & Competitive Landscape
This section analyzes the market concentration, innovation drivers, regulatory impacts, product substitutes, end-user segmentation, and M&A trends within the office real estate industry. The global market demonstrates a moderately concentrated structure, with a Herfindahl-Hirschman Index (HHI) estimated at xx in 2025. Key players like Cushman & Wakefield, JLL, and Hines hold significant market share, influencing pricing and innovation.
Market Concentration: The HHI value of xx suggests a moderately concentrated market, with some larger players exerting significant influence. Further analysis reveals that the top 5 players control approximately xx% of the market.
Innovation Drivers: Technological advancements, such as smart building technologies and flexible workspace solutions, are driving innovation. This is further propelled by the increasing demand for sustainable and energy-efficient office spaces.
Regulatory Impacts: Varying zoning regulations, building codes, and environmental policies across different regions significantly impact market dynamics. These regulatory factors create both opportunities and challenges for market participants.
Product Substitutes: The rise of co-working spaces and remote work options present emerging substitutes for traditional office spaces, impacting demand for conventional office accommodation.
End-User Segmentation: The market caters to diverse end-users, including corporate offices, government offices, and financial institutions, each with specific needs and preferences impacting market segmentation.
M&A Trends: The office real estate sector has witnessed a considerable volume of mergers and acquisitions (M&A) activity in recent years, totaling an estimated $XX Million in deal value during 2019-2024. These M&A activities often contribute to increased market consolidation.
Office Real Estate Industry Market Trends & Opportunities
This section explores the market size growth, technological shifts, consumer preferences, and competitive dynamics impacting the office real estate sector. The global office real estate market is poised for robust growth, with a projected Compound Annual Growth Rate (CAGR) of xx% during 2025-2033. This growth is fueled by several key factors:
The increasing demand for modern, efficient, and sustainable office spaces is driving market expansion. Technological advancements, including smart building technologies and integrated workplace management systems, are enhancing operational efficiency and attracting tenants. Changing consumer preferences, favoring flexible work arrangements and collaborative workspaces, are also shaping market trends. The increasing adoption of flexible work models, including hybrid and remote work arrangements, is impacting demand for traditional office spaces. This trend necessitates adaptive strategies from real estate providers, emphasizing flexible lease terms and adaptable workspace designs. Intense competition among developers and property managers fuels innovation and ensures the delivery of high-quality office accommodations, while the focus on sustainability is further gaining momentum. Green building certifications and environmentally conscious design are becoming increasingly important considerations for tenants and investors alike. The increasing prominence of technology and data-driven decision-making enhances market efficiency and informs strategic investments.
Dominant Markets & Segments in Office Real Estate Industry
This section identifies the leading regions, countries, and segments within the office real estate market. The North American region currently holds a dominant position in the global market, driven by strong economic growth and favorable regulatory environments. Within this region, major cities like New York, San Francisco, and Chicago are key hubs for office real estate activity.
Key Growth Drivers:
- Robust Economic Growth: Strong economic performance in key regions drives demand for office spaces.
- Favorable Government Policies: Supportive regulatory frameworks stimulate investment and development.
- Infrastructure Development: Significant investments in infrastructure projects enhance connectivity and accessibility.
- Technological Advancements: Innovation drives the creation of smart and efficient office spaces.
Market Dominance Analysis: The dominance of North America reflects several factors, including its established economies, large corporate presence, and advanced infrastructure. However, emerging economies in Asia and Europe are exhibiting strong growth potential, driven by rapid urbanization and expanding business sectors. The office accommodation segment holds the largest share of the market, followed by office equipment and office services. Corporate offices constitute the largest application segment, reflecting the significant space requirements of large organizations. Government offices and financial institutions represent important, albeit smaller, segments.
Office Real Estate Industry Product Analysis
The office real estate industry offers a diverse range of products and services, encompassing office accommodation (including traditional and flexible workspaces), office equipment (furniture, technology infrastructure), and office services (property management, facility management). Technological advancements in building management systems, smart office technologies, and sustainable design are key drivers of product innovation. The market is increasingly focused on delivering flexible and adaptable workspace solutions to meet the evolving needs of tenants. Competitive advantages lie in offering premium amenities, strategic locations, and sustainable features to attract and retain tenants in a dynamic market.
Key Drivers, Barriers & Challenges in Office Real Estate Industry
Key Drivers: Technological advancements, such as smart building technology and flexible workspace solutions, are driving market growth. Strong economic growth in key regions and favorable government policies supporting real estate development also contribute significantly.
Key Challenges: Supply chain disruptions and increased material costs pose a major challenge, leading to project delays and cost overruns. Stricter environmental regulations and rising energy costs are increasing operational expenses. Intense competition among market participants creates pricing pressures and necessitates continuous innovation to maintain a competitive edge.
Growth Drivers in the Office Real Estate Industry Market
The office real estate market is experiencing growth driven by factors like technological advancements in smart building technologies and flexible workspaces, economic growth in key regions, and supportive government policies. Urbanization and population growth in major cities further fuels demand.
Challenges Impacting Office Real Estate Industry Growth
Challenges include supply chain disruptions causing delays and increased costs, stringent environmental regulations and rising energy costs increasing operational expenses, and intense competition among developers leading to pricing pressures.
Key Players Shaping the Office Real Estate Industry Market
- Cushman & Wakefield
- Hines
- Buckingham Properties
- Colliers International
- China Evergrande Group
- Delhi Land & Finance
- JLL
- Skanska
Significant Office Real Estate Industry Milestones
- 2021-Q3: Increased adoption of hybrid work models significantly impacted office space demand.
- 2022-Q1: Several major mergers and acquisitions reshaped the competitive landscape.
- 2023-Q2: Significant investment in sustainable office building technologies.
- 2024-Q4: Introduction of new flexible workspace solutions by key players.
Future Outlook for Office Real Estate Industry Market
The office real estate market is expected to experience continued growth, driven by technological advancements, urbanization, and the ongoing need for flexible workspaces. Strategic investments in sustainable building technologies and data-driven decision-making will further shape market dynamics. The focus on creating vibrant and amenity-rich office environments will be key to attracting and retaining tenants. The market will likely see further consolidation through mergers and acquisitions, with the emergence of new, innovative players.
Office Real Estate Industry Segmentation
- 1. Production Analysis
- 2. Consumption Analysis
- 3. Import Market Analysis (Value & Volume)
- 4. Export Market Analysis (Value & Volume)
- 5. Price Trend Analysis
Office Real Estate Industry Segmentation By Geography
-
1. North America
- 1.1. United States
- 1.2. Canada
- 1.3. Mexico
-
2. Europe
- 2.1. United Kingdom
- 2.2. France
- 2.3. Germany
- 2.4. Rest of Europe
-
3. Asia Pacific
- 3.1. China
- 3.2. India
- 3.3. Japan
- 3.4. South Korea
- 3.5. Rest of Asia Pacific
- 4. Middle East
-
5. United Arab Emirates
- 5.1. Saudi Arabia
- 5.2. South Africa
- 5.3. Rest of Middle East
-
6. Latin America
- 6.1. Brazil
- 6.2. Argentina
- 6.3. Rest of Latin America
- 7. Rest of the World
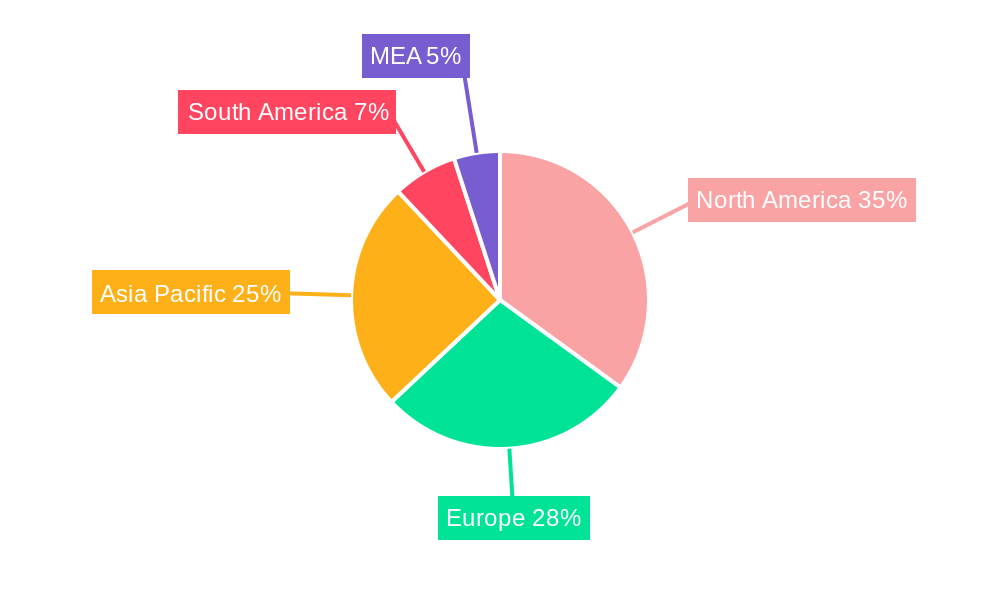
Office Real Estate Industry Regional Market Share
Geographic Coverage of Office Real Estate Industry
Office Real Estate Industry REPORT HIGHLIGHTS
| Aspects | Details |
|---|---|
| Study Period | 2020-2034 |
| Base Year | 2025 |
| Estimated Year | 2026 |
| Forecast Period | 2026-2034 |
| Historical Period | 2020-2025 |
| Growth Rate | CAGR of > 5.17% from 2020-2034 |
| Segmentation |
|
Table of Contents
- 1. Introduction
- 1.1. Research Scope
- 1.2. Market Segmentation
- 1.3. Research Objective
- 1.4. Definitions and Assumptions
- 2. Executive Summary
- 2.1. Market Snapshot
- 3. Market Dynamics
- 3.1. Market Drivers
- 3.2. Market Restrains
- 3.3. Market Trends
- 3.4. Market Opportunities
- 4. Market Factor Analysis
- 4.1. Porters Five Forces
- 4.1.1. Bargaining Power of Suppliers
- 4.1.2. Bargaining Power of Buyers
- 4.1.3. Threat of New Entrants
- 4.1.4. Threat of Substitutes
- 4.1.5. Competitive Rivalry
- 4.2. PESTEL analysis
- 4.3. BCG Analysis
- 4.3.1. Stars (High Growth, High Market Share)
- 4.3.2. Cash Cows (Low Growth, High Market Share)
- 4.3.3. Question Mark (High Growth, Low Market Share)
- 4.3.4. Dogs (Low Growth, Low Market Share)
- 4.4. Ansoff Matrix Analysis
- 4.5. Supply Chain Analysis
- 4.6. Regulatory Landscape
- 4.7. Current Market Potential and Opportunity Assessment (TAM–SAM–SOM Framework)
- 4.8. TIR Analyst Note
- 4.1. Porters Five Forces
- 5. Market Analysis, Insights and Forecast 2021-2033
- 5.1. Market Analysis, Insights and Forecast - by Production Analysis
- 5.2. Market Analysis, Insights and Forecast - by Consumption Analysis
- 5.3. Market Analysis, Insights and Forecast - by Import Market Analysis (Value & Volume)
- 5.4. Market Analysis, Insights and Forecast - by Export Market Analysis (Value & Volume)
- 5.5. Market Analysis, Insights and Forecast - by Price Trend Analysis
- 5.6. Market Analysis, Insights and Forecast - by Region
- 5.6.1. North America
- 5.6.2. Europe
- 5.6.3. Asia Pacific
- 5.6.4. Middle East
- 5.6.5. United Arab Emirates
- 5.6.6. Latin America
- 5.6.7. Rest of the World
- 6. Global Office Real Estate Industry Analysis, Insights and Forecast, 2021-2033
- 6.1. Market Analysis, Insights and Forecast - by Production Analysis
- 6.2. Market Analysis, Insights and Forecast - by Consumption Analysis
- 6.3. Market Analysis, Insights and Forecast - by Import Market Analysis (Value & Volume)
- 6.4. Market Analysis, Insights and Forecast - by Export Market Analysis (Value & Volume)
- 6.5. Market Analysis, Insights and Forecast - by Price Trend Analysis
- 7. North America Office Real Estate Industry Analysis, Insights and Forecast, 2020-2032
- 7.1. Market Analysis, Insights and Forecast - by Production Analysis
- 7.2. Market Analysis, Insights and Forecast - by Consumption Analysis
- 7.3. Market Analysis, Insights and Forecast - by Import Market Analysis (Value & Volume)
- 7.4. Market Analysis, Insights and Forecast - by Export Market Analysis (Value & Volume)
- 7.5. Market Analysis, Insights and Forecast - by Price Trend Analysis
- 8. Europe Office Real Estate Industry Analysis, Insights and Forecast, 2020-2032
- 8.1. Market Analysis, Insights and Forecast - by Production Analysis
- 8.2. Market Analysis, Insights and Forecast - by Consumption Analysis
- 8.3. Market Analysis, Insights and Forecast - by Import Market Analysis (Value & Volume)
- 8.4. Market Analysis, Insights and Forecast - by Export Market Analysis (Value & Volume)
- 8.5. Market Analysis, Insights and Forecast - by Price Trend Analysis
- 9. Asia Pacific Office Real Estate Industry Analysis, Insights and Forecast, 2020-2032
- 9.1. Market Analysis, Insights and Forecast - by Production Analysis
- 9.2. Market Analysis, Insights and Forecast - by Consumption Analysis
- 9.3. Market Analysis, Insights and Forecast - by Import Market Analysis (Value & Volume)
- 9.4. Market Analysis, Insights and Forecast - by Export Market Analysis (Value & Volume)
- 9.5. Market Analysis, Insights and Forecast - by Price Trend Analysis
- 10. Middle East Office Real Estate Industry Analysis, Insights and Forecast, 2020-2032
- 10.1. Market Analysis, Insights and Forecast - by Production Analysis
- 10.2. Market Analysis, Insights and Forecast - by Consumption Analysis
- 10.3. Market Analysis, Insights and Forecast - by Import Market Analysis (Value & Volume)
- 10.4. Market Analysis, Insights and Forecast - by Export Market Analysis (Value & Volume)
- 10.5. Market Analysis, Insights and Forecast - by Price Trend Analysis
- 11. United Arab Emirates Office Real Estate Industry Analysis, Insights and Forecast, 2020-2032
- 11.1. Market Analysis, Insights and Forecast - by Production Analysis
- 11.2. Market Analysis, Insights and Forecast - by Consumption Analysis
- 11.3. Market Analysis, Insights and Forecast - by Import Market Analysis (Value & Volume)
- 11.4. Market Analysis, Insights and Forecast - by Export Market Analysis (Value & Volume)
- 11.5. Market Analysis, Insights and Forecast - by Price Trend Analysis
- 12. Latin America Office Real Estate Industry Analysis, Insights and Forecast, 2020-2032
- 12.1. Market Analysis, Insights and Forecast - by Production Analysis
- 12.2. Market Analysis, Insights and Forecast - by Consumption Analysis
- 12.3. Market Analysis, Insights and Forecast - by Import Market Analysis (Value & Volume)
- 12.4. Market Analysis, Insights and Forecast - by Export Market Analysis (Value & Volume)
- 12.5. Market Analysis, Insights and Forecast - by Price Trend Analysis
- 13. Rest of the World Office Real Estate Industry Analysis, Insights and Forecast, 2020-2032
- 13.1. Market Analysis, Insights and Forecast - by Production Analysis
- 13.2. Market Analysis, Insights and Forecast - by Consumption Analysis
- 13.3. Market Analysis, Insights and Forecast - by Import Market Analysis (Value & Volume)
- 13.4. Market Analysis, Insights and Forecast - by Export Market Analysis (Value & Volume)
- 13.5. Market Analysis, Insights and Forecast - by Price Trend Analysis
- 14. Competitive Analysis
- 14.1. Company Profiles
- 14.1.1 Cushman & Wakefield
- 14.1.1.1. Company Overview
- 14.1.1.2. Products
- 14.1.1.3. Company Financials
- 14.1.1.4. SWOT Analysis
- 14.1.2 Hines
- 14.1.2.1. Company Overview
- 14.1.2.2. Products
- 14.1.2.3. Company Financials
- 14.1.2.4. SWOT Analysis
- 14.1.3 Buckingham Properties
- 14.1.3.1. Company Overview
- 14.1.3.2. Products
- 14.1.3.3. Company Financials
- 14.1.3.4. SWOT Analysis
- 14.1.4 Colliers International
- 14.1.4.1. Company Overview
- 14.1.4.2. Products
- 14.1.4.3. Company Financials
- 14.1.4.4. SWOT Analysis
- 14.1.5 China Evergrande Group
- 14.1.5.1. Company Overview
- 14.1.5.2. Products
- 14.1.5.3. Company Financials
- 14.1.5.4. SWOT Analysis
- 14.1.6 Delhi Land & Finance
- 14.1.6.1. Company Overview
- 14.1.6.2. Products
- 14.1.6.3. Company Financials
- 14.1.6.4. SWOT Analysis
- 14.1.7 JLL
- 14.1.7.1. Company Overview
- 14.1.7.2. Products
- 14.1.7.3. Company Financials
- 14.1.7.4. SWOT Analysis
- 14.1.8 Skanska
- 14.1.8.1. Company Overview
- 14.1.8.2. Products
- 14.1.8.3. Company Financials
- 14.1.8.4. SWOT Analysis
- 14.1.1 Cushman & Wakefield
- 14.2. Market Entropy
- 14.2.1 Company's Key Areas Served
- 14.2.2 Recent Developments
- 14.3. Company Market Share Analysis 2025
- 14.3.1 Top 5 Companies Market Share Analysis
- 14.3.2 Top 3 Companies Market Share Analysis
- 14.4. List of Potential Customers
- 15. Research Methodology
List of Figures
- Figure 1: Global Office Real Estate Industry Revenue Breakdown (Million, %) by Region 2025 & 2033
- Figure 2: North America Office Real Estate Industry Revenue (Million), by Production Analysis 2025 & 2033
- Figure 3: North America Office Real Estate Industry Revenue Share (%), by Production Analysis 2025 & 2033
- Figure 4: North America Office Real Estate Industry Revenue (Million), by Consumption Analysis 2025 & 2033
- Figure 5: North America Office Real Estate Industry Revenue Share (%), by Consumption Analysis 2025 & 2033
- Figure 6: North America Office Real Estate Industry Revenue (Million), by Import Market Analysis (Value & Volume) 2025 & 2033
- Figure 7: North America Office Real Estate Industry Revenue Share (%), by Import Market Analysis (Value & Volume) 2025 & 2033
- Figure 8: North America Office Real Estate Industry Revenue (Million), by Export Market Analysis (Value & Volume) 2025 & 2033
- Figure 9: North America Office Real Estate Industry Revenue Share (%), by Export Market Analysis (Value & Volume) 2025 & 2033
- Figure 10: North America Office Real Estate Industry Revenue (Million), by Price Trend Analysis 2025 & 2033
- Figure 11: North America Office Real Estate Industry Revenue Share (%), by Price Trend Analysis 2025 & 2033
- Figure 12: North America Office Real Estate Industry Revenue (Million), by Country 2025 & 2033
- Figure 13: North America Office Real Estate Industry Revenue Share (%), by Country 2025 & 2033
- Figure 14: Europe Office Real Estate Industry Revenue (Million), by Production Analysis 2025 & 2033
- Figure 15: Europe Office Real Estate Industry Revenue Share (%), by Production Analysis 2025 & 2033
- Figure 16: Europe Office Real Estate Industry Revenue (Million), by Consumption Analysis 2025 & 2033
- Figure 17: Europe Office Real Estate Industry Revenue Share (%), by Consumption Analysis 2025 & 2033
- Figure 18: Europe Office Real Estate Industry Revenue (Million), by Import Market Analysis (Value & Volume) 2025 & 2033
- Figure 19: Europe Office Real Estate Industry Revenue Share (%), by Import Market Analysis (Value & Volume) 2025 & 2033
- Figure 20: Europe Office Real Estate Industry Revenue (Million), by Export Market Analysis (Value & Volume) 2025 & 2033
- Figure 21: Europe Office Real Estate Industry Revenue Share (%), by Export Market Analysis (Value & Volume) 2025 & 2033
- Figure 22: Europe Office Real Estate Industry Revenue (Million), by Price Trend Analysis 2025 & 2033
- Figure 23: Europe Office Real Estate Industry Revenue Share (%), by Price Trend Analysis 2025 & 2033
- Figure 24: Europe Office Real Estate Industry Revenue (Million), by Country 2025 & 2033
- Figure 25: Europe Office Real Estate Industry Revenue Share (%), by Country 2025 & 2033
- Figure 26: Asia Pacific Office Real Estate Industry Revenue (Million), by Production Analysis 2025 & 2033
- Figure 27: Asia Pacific Office Real Estate Industry Revenue Share (%), by Production Analysis 2025 & 2033
- Figure 28: Asia Pacific Office Real Estate Industry Revenue (Million), by Consumption Analysis 2025 & 2033
- Figure 29: Asia Pacific Office Real Estate Industry Revenue Share (%), by Consumption Analysis 2025 & 2033
- Figure 30: Asia Pacific Office Real Estate Industry Revenue (Million), by Import Market Analysis (Value & Volume) 2025 & 2033
- Figure 31: Asia Pacific Office Real Estate Industry Revenue Share (%), by Import Market Analysis (Value & Volume) 2025 & 2033
- Figure 32: Asia Pacific Office Real Estate Industry Revenue (Million), by Export Market Analysis (Value & Volume) 2025 & 2033
- Figure 33: Asia Pacific Office Real Estate Industry Revenue Share (%), by Export Market Analysis (Value & Volume) 2025 & 2033
- Figure 34: Asia Pacific Office Real Estate Industry Revenue (Million), by Price Trend Analysis 2025 & 2033
- Figure 35: Asia Pacific Office Real Estate Industry Revenue Share (%), by Price Trend Analysis 2025 & 2033
- Figure 36: Asia Pacific Office Real Estate Industry Revenue (Million), by Country 2025 & 2033
- Figure 37: Asia Pacific Office Real Estate Industry Revenue Share (%), by Country 2025 & 2033
- Figure 38: Middle East Office Real Estate Industry Revenue (Million), by Production Analysis 2025 & 2033
- Figure 39: Middle East Office Real Estate Industry Revenue Share (%), by Production Analysis 2025 & 2033
- Figure 40: Middle East Office Real Estate Industry Revenue (Million), by Consumption Analysis 2025 & 2033
- Figure 41: Middle East Office Real Estate Industry Revenue Share (%), by Consumption Analysis 2025 & 2033
- Figure 42: Middle East Office Real Estate Industry Revenue (Million), by Import Market Analysis (Value & Volume) 2025 & 2033
- Figure 43: Middle East Office Real Estate Industry Revenue Share (%), by Import Market Analysis (Value & Volume) 2025 & 2033
- Figure 44: Middle East Office Real Estate Industry Revenue (Million), by Export Market Analysis (Value & Volume) 2025 & 2033
- Figure 45: Middle East Office Real Estate Industry Revenue Share (%), by Export Market Analysis (Value & Volume) 2025 & 2033
- Figure 46: Middle East Office Real Estate Industry Revenue (Million), by Price Trend Analysis 2025 & 2033
- Figure 47: Middle East Office Real Estate Industry Revenue Share (%), by Price Trend Analysis 2025 & 2033
- Figure 48: Middle East Office Real Estate Industry Revenue (Million), by Country 2025 & 2033
- Figure 49: Middle East Office Real Estate Industry Revenue Share (%), by Country 2025 & 2033
- Figure 50: United Arab Emirates Office Real Estate Industry Revenue (Million), by Production Analysis 2025 & 2033
- Figure 51: United Arab Emirates Office Real Estate Industry Revenue Share (%), by Production Analysis 2025 & 2033
- Figure 52: United Arab Emirates Office Real Estate Industry Revenue (Million), by Consumption Analysis 2025 & 2033
- Figure 53: United Arab Emirates Office Real Estate Industry Revenue Share (%), by Consumption Analysis 2025 & 2033
- Figure 54: United Arab Emirates Office Real Estate Industry Revenue (Million), by Import Market Analysis (Value & Volume) 2025 & 2033
- Figure 55: United Arab Emirates Office Real Estate Industry Revenue Share (%), by Import Market Analysis (Value & Volume) 2025 & 2033
- Figure 56: United Arab Emirates Office Real Estate Industry Revenue (Million), by Export Market Analysis (Value & Volume) 2025 & 2033
- Figure 57: United Arab Emirates Office Real Estate Industry Revenue Share (%), by Export Market Analysis (Value & Volume) 2025 & 2033
- Figure 58: United Arab Emirates Office Real Estate Industry Revenue (Million), by Price Trend Analysis 2025 & 2033
- Figure 59: United Arab Emirates Office Real Estate Industry Revenue Share (%), by Price Trend Analysis 2025 & 2033
- Figure 60: United Arab Emirates Office Real Estate Industry Revenue (Million), by Country 2025 & 2033
- Figure 61: United Arab Emirates Office Real Estate Industry Revenue Share (%), by Country 2025 & 2033
- Figure 62: Latin America Office Real Estate Industry Revenue (Million), by Production Analysis 2025 & 2033
- Figure 63: Latin America Office Real Estate Industry Revenue Share (%), by Production Analysis 2025 & 2033
- Figure 64: Latin America Office Real Estate Industry Revenue (Million), by Consumption Analysis 2025 & 2033
- Figure 65: Latin America Office Real Estate Industry Revenue Share (%), by Consumption Analysis 2025 & 2033
- Figure 66: Latin America Office Real Estate Industry Revenue (Million), by Import Market Analysis (Value & Volume) 2025 & 2033
- Figure 67: Latin America Office Real Estate Industry Revenue Share (%), by Import Market Analysis (Value & Volume) 2025 & 2033
- Figure 68: Latin America Office Real Estate Industry Revenue (Million), by Export Market Analysis (Value & Volume) 2025 & 2033
- Figure 69: Latin America Office Real Estate Industry Revenue Share (%), by Export Market Analysis (Value & Volume) 2025 & 2033
- Figure 70: Latin America Office Real Estate Industry Revenue (Million), by Price Trend Analysis 2025 & 2033
- Figure 71: Latin America Office Real Estate Industry Revenue Share (%), by Price Trend Analysis 2025 & 2033
- Figure 72: Latin America Office Real Estate Industry Revenue (Million), by Country 2025 & 2033
- Figure 73: Latin America Office Real Estate Industry Revenue Share (%), by Country 2025 & 2033
- Figure 74: Rest of the World Office Real Estate Industry Revenue (Million), by Production Analysis 2025 & 2033
- Figure 75: Rest of the World Office Real Estate Industry Revenue Share (%), by Production Analysis 2025 & 2033
- Figure 76: Rest of the World Office Real Estate Industry Revenue (Million), by Consumption Analysis 2025 & 2033
- Figure 77: Rest of the World Office Real Estate Industry Revenue Share (%), by Consumption Analysis 2025 & 2033
- Figure 78: Rest of the World Office Real Estate Industry Revenue (Million), by Import Market Analysis (Value & Volume) 2025 & 2033
- Figure 79: Rest of the World Office Real Estate Industry Revenue Share (%), by Import Market Analysis (Value & Volume) 2025 & 2033
- Figure 80: Rest of the World Office Real Estate Industry Revenue (Million), by Export Market Analysis (Value & Volume) 2025 & 2033
- Figure 81: Rest of the World Office Real Estate Industry Revenue Share (%), by Export Market Analysis (Value & Volume) 2025 & 2033
- Figure 82: Rest of the World Office Real Estate Industry Revenue (Million), by Price Trend Analysis 2025 & 2033
- Figure 83: Rest of the World Office Real Estate Industry Revenue Share (%), by Price Trend Analysis 2025 & 2033
- Figure 84: Rest of the World Office Real Estate Industry Revenue (Million), by Country 2025 & 2033
- Figure 85: Rest of the World Office Real Estate Industry Revenue Share (%), by Country 2025 & 2033
List of Tables
- Table 1: Global Office Real Estate Industry Revenue Million Forecast, by Production Analysis 2020 & 2033
- Table 2: Global Office Real Estate Industry Revenue Million Forecast, by Consumption Analysis 2020 & 2033
- Table 3: Global Office Real Estate Industry Revenue Million Forecast, by Import Market Analysis (Value & Volume) 2020 & 2033
- Table 4: Global Office Real Estate Industry Revenue Million Forecast, by Export Market Analysis (Value & Volume) 2020 & 2033
- Table 5: Global Office Real Estate Industry Revenue Million Forecast, by Price Trend Analysis 2020 & 2033
- Table 6: Global Office Real Estate Industry Revenue Million Forecast, by Region 2020 & 2033
- Table 7: Global Office Real Estate Industry Revenue Million Forecast, by Production Analysis 2020 & 2033
- Table 8: Global Office Real Estate Industry Revenue Million Forecast, by Consumption Analysis 2020 & 2033
- Table 9: Global Office Real Estate Industry Revenue Million Forecast, by Import Market Analysis (Value & Volume) 2020 & 2033
- Table 10: Global Office Real Estate Industry Revenue Million Forecast, by Export Market Analysis (Value & Volume) 2020 & 2033
- Table 11: Global Office Real Estate Industry Revenue Million Forecast, by Price Trend Analysis 2020 & 2033
- Table 12: Global Office Real Estate Industry Revenue Million Forecast, by Country 2020 & 2033
- Table 13: United States Office Real Estate Industry Revenue (Million) Forecast, by Application 2020 & 2033
- Table 14: Canada Office Real Estate Industry Revenue (Million) Forecast, by Application 2020 & 2033
- Table 15: Mexico Office Real Estate Industry Revenue (Million) Forecast, by Application 2020 & 2033
- Table 16: Global Office Real Estate Industry Revenue Million Forecast, by Production Analysis 2020 & 2033
- Table 17: Global Office Real Estate Industry Revenue Million Forecast, by Consumption Analysis 2020 & 2033
- Table 18: Global Office Real Estate Industry Revenue Million Forecast, by Import Market Analysis (Value & Volume) 2020 & 2033
- Table 19: Global Office Real Estate Industry Revenue Million Forecast, by Export Market Analysis (Value & Volume) 2020 & 2033
- Table 20: Global Office Real Estate Industry Revenue Million Forecast, by Price Trend Analysis 2020 & 2033
- Table 21: Global Office Real Estate Industry Revenue Million Forecast, by Country 2020 & 2033
- Table 22: United Kingdom Office Real Estate Industry Revenue (Million) Forecast, by Application 2020 & 2033
- Table 23: France Office Real Estate Industry Revenue (Million) Forecast, by Application 2020 & 2033
- Table 24: Germany Office Real Estate Industry Revenue (Million) Forecast, by Application 2020 & 2033
- Table 25: Rest of Europe Office Real Estate Industry Revenue (Million) Forecast, by Application 2020 & 2033
- Table 26: Global Office Real Estate Industry Revenue Million Forecast, by Production Analysis 2020 & 2033
- Table 27: Global Office Real Estate Industry Revenue Million Forecast, by Consumption Analysis 2020 & 2033
- Table 28: Global Office Real Estate Industry Revenue Million Forecast, by Import Market Analysis (Value & Volume) 2020 & 2033
- Table 29: Global Office Real Estate Industry Revenue Million Forecast, by Export Market Analysis (Value & Volume) 2020 & 2033
- Table 30: Global Office Real Estate Industry Revenue Million Forecast, by Price Trend Analysis 2020 & 2033
- Table 31: Global Office Real Estate Industry Revenue Million Forecast, by Country 2020 & 2033
- Table 32: China Office Real Estate Industry Revenue (Million) Forecast, by Application 2020 & 2033
- Table 33: India Office Real Estate Industry Revenue (Million) Forecast, by Application 2020 & 2033
- Table 34: Japan Office Real Estate Industry Revenue (Million) Forecast, by Application 2020 & 2033
- Table 35: South Korea Office Real Estate Industry Revenue (Million) Forecast, by Application 2020 & 2033
- Table 36: Rest of Asia Pacific Office Real Estate Industry Revenue (Million) Forecast, by Application 2020 & 2033
- Table 37: Global Office Real Estate Industry Revenue Million Forecast, by Production Analysis 2020 & 2033
- Table 38: Global Office Real Estate Industry Revenue Million Forecast, by Consumption Analysis 2020 & 2033
- Table 39: Global Office Real Estate Industry Revenue Million Forecast, by Import Market Analysis (Value & Volume) 2020 & 2033
- Table 40: Global Office Real Estate Industry Revenue Million Forecast, by Export Market Analysis (Value & Volume) 2020 & 2033
- Table 41: Global Office Real Estate Industry Revenue Million Forecast, by Price Trend Analysis 2020 & 2033
- Table 42: Global Office Real Estate Industry Revenue Million Forecast, by Country 2020 & 2033
- Table 43: Global Office Real Estate Industry Revenue Million Forecast, by Production Analysis 2020 & 2033
- Table 44: Global Office Real Estate Industry Revenue Million Forecast, by Consumption Analysis 2020 & 2033
- Table 45: Global Office Real Estate Industry Revenue Million Forecast, by Import Market Analysis (Value & Volume) 2020 & 2033
- Table 46: Global Office Real Estate Industry Revenue Million Forecast, by Export Market Analysis (Value & Volume) 2020 & 2033
- Table 47: Global Office Real Estate Industry Revenue Million Forecast, by Price Trend Analysis 2020 & 2033
- Table 48: Global Office Real Estate Industry Revenue Million Forecast, by Country 2020 & 2033
- Table 49: Saudi Arabia Office Real Estate Industry Revenue (Million) Forecast, by Application 2020 & 2033
- Table 50: South Africa Office Real Estate Industry Revenue (Million) Forecast, by Application 2020 & 2033
- Table 51: Rest of Middle East Office Real Estate Industry Revenue (Million) Forecast, by Application 2020 & 2033
- Table 52: Global Office Real Estate Industry Revenue Million Forecast, by Production Analysis 2020 & 2033
- Table 53: Global Office Real Estate Industry Revenue Million Forecast, by Consumption Analysis 2020 & 2033
- Table 54: Global Office Real Estate Industry Revenue Million Forecast, by Import Market Analysis (Value & Volume) 2020 & 2033
- Table 55: Global Office Real Estate Industry Revenue Million Forecast, by Export Market Analysis (Value & Volume) 2020 & 2033
- Table 56: Global Office Real Estate Industry Revenue Million Forecast, by Price Trend Analysis 2020 & 2033
- Table 57: Global Office Real Estate Industry Revenue Million Forecast, by Country 2020 & 2033
- Table 58: Brazil Office Real Estate Industry Revenue (Million) Forecast, by Application 2020 & 2033
- Table 59: Argentina Office Real Estate Industry Revenue (Million) Forecast, by Application 2020 & 2033
- Table 60: Rest of Latin America Office Real Estate Industry Revenue (Million) Forecast, by Application 2020 & 2033
- Table 61: Global Office Real Estate Industry Revenue Million Forecast, by Production Analysis 2020 & 2033
- Table 62: Global Office Real Estate Industry Revenue Million Forecast, by Consumption Analysis 2020 & 2033
- Table 63: Global Office Real Estate Industry Revenue Million Forecast, by Import Market Analysis (Value & Volume) 2020 & 2033
- Table 64: Global Office Real Estate Industry Revenue Million Forecast, by Export Market Analysis (Value & Volume) 2020 & 2033
- Table 65: Global Office Real Estate Industry Revenue Million Forecast, by Price Trend Analysis 2020 & 2033
- Table 66: Global Office Real Estate Industry Revenue Million Forecast, by Country 2020 & 2033
Frequently Asked Questions
1. What is the projected Compound Annual Growth Rate (CAGR) of the Office Real Estate Industry?
The projected CAGR is approximately > 5.17%.
2. Which companies are prominent players in the Office Real Estate Industry?
Key companies in the market include Cushman & Wakefield, Hines, Buckingham Properties, Colliers International, China Evergrande Group, Delhi Land & Finance, JLL, Skanska.
3. What are the main segments of the Office Real Estate Industry?
The market segments include Production Analysis, Consumption Analysis, Import Market Analysis (Value & Volume), Export Market Analysis (Value & Volume), Price Trend Analysis.
4. Can you provide details about the market size?
The market size is estimated to be USD 2.10 Million as of 2022.
5. What are some drivers contributing to market growth?
Office Leasing Volume is Witnessing Significant Growth; Increasing Rental Prices of Office Spaces.
6. What are the notable trends driving market growth?
Rise in Demand for Coworking Spaces.
7. Are there any restraints impacting market growth?
Remote Work and Hybrid Models; High vacancy rates can be a significant challenge in the office market.
8. Can you provide examples of recent developments in the market?
N/A
9. What pricing options are available for accessing the report?
Pricing options include single-user, multi-user, and enterprise licenses priced at USD 4750, USD 5250, and USD 8750 respectively.
10. Is the market size provided in terms of value or volume?
The market size is provided in terms of value, measured in Million.
11. Are there any specific market keywords associated with the report?
Yes, the market keyword associated with the report is "Office Real Estate Industry," which aids in identifying and referencing the specific market segment covered.
12. How do I determine which pricing option suits my needs best?
The pricing options vary based on user requirements and access needs. Individual users may opt for single-user licenses, while businesses requiring broader access may choose multi-user or enterprise licenses for cost-effective access to the report.
13. Are there any additional resources or data provided in the Office Real Estate Industry report?
While the report offers comprehensive insights, it's advisable to review the specific contents or supplementary materials provided to ascertain if additional resources or data are available.
14. How can I stay updated on further developments or reports in the Office Real Estate Industry?
To stay informed about further developments, trends, and reports in the Office Real Estate Industry, consider subscribing to industry newsletters, following relevant companies and organizations, or regularly checking reputable industry news sources and publications.
Methodology
Step 1 - Identification of Relevant Samples Size from Population Database


Step 2 - Approaches for Defining Global Market Size (Value, Volume* & Price*)

Note*: In applicable scenarios
Step 3 - Data Sources
Primary Research
- Web Analytics
- Survey Reports
- Research Institute
- Latest Research Reports
- Opinion Leaders
Secondary Research
- Annual Reports
- White Paper
- Latest Press Release
- Industry Association
- Paid Database
- Investor Presentations

Step 4 - Data Triangulation
Involves using different sources of information in order to increase the validity of a study
These sources are likely to be stakeholders in a program - participants, other researchers, program staff, other community members, and so on.
Then we put all data in single framework & apply various statistical tools to find out the dynamic on the market.
During the analysis stage, feedback from the stakeholder groups would be compared to determine areas of agreement as well as areas of divergence