

Key Insights
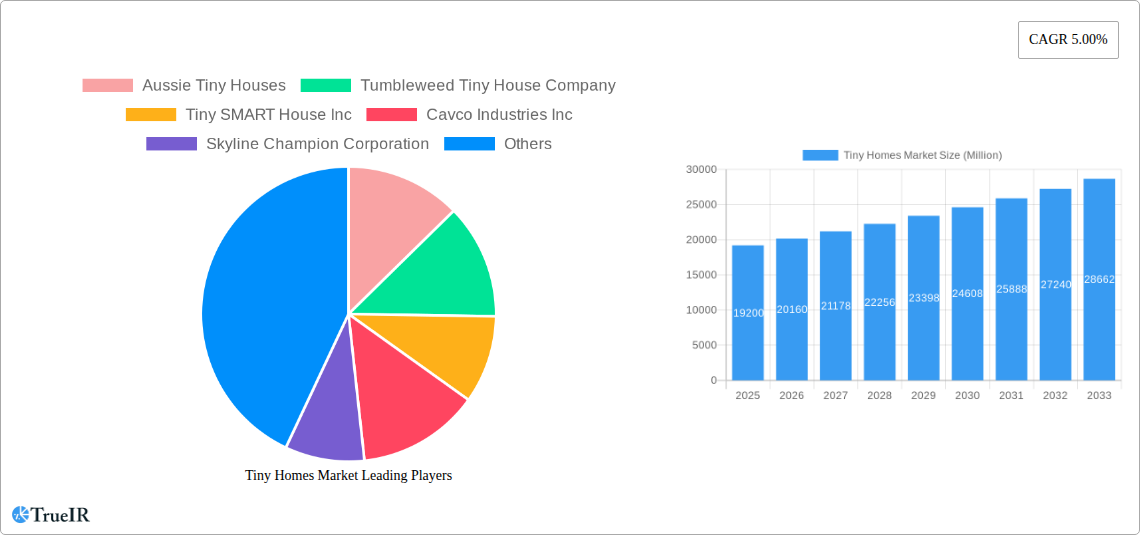
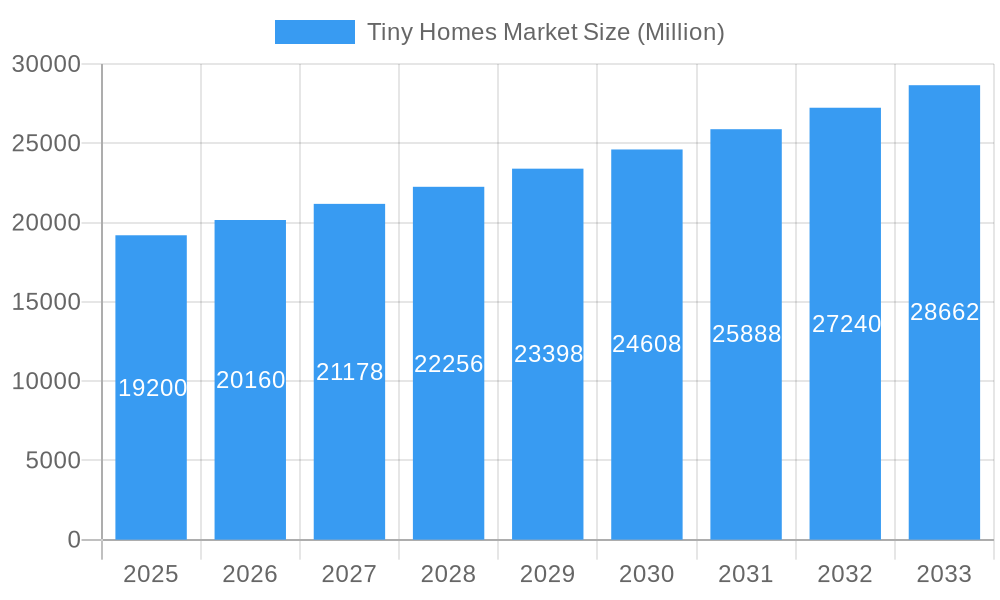
The tiny homes market, valued at $19.20 billion in 2025, is experiencing robust growth, projected to expand at a compound annual growth rate (CAGR) of 5.00% from 2025 to 2033. This surge in popularity is driven by several factors. Increasing urbanization and rising housing costs, particularly in major metropolitan areas, are compelling individuals and families to seek affordable and sustainable housing alternatives. The desire for minimalist living, environmental consciousness, and greater mobility are also significant contributing factors. Furthermore, innovative designs and technological advancements are making tiny homes more functional and appealing, expanding their application beyond residential use to encompass commercial and even some industrial settings. The market segmentation reveals a diverse landscape, with mobile tiny homes currently dominating the product type segment, followed by stationary options. In terms of size, the 130-500 sq ft segment holds the largest market share, reflecting a balance between affordability and livable space. The household segment is the primary application, but increasing adoption in the commercial sector—think unique retail spaces or guest houses—suggests significant future growth potential in this area. Key players like Aussie Tiny Houses and Tumbleweed Tiny House Company are shaping the market through design innovation and brand recognition.
Tiny Homes Market Market Size (In Billion)
The forecast period (2025-2033) suggests continued market expansion, propelled by ongoing trends towards sustainable living and the need for more affordable housing options. While potential restraints such as stringent building regulations and zoning laws in certain regions could impact growth, the overall outlook remains positive. The North American market currently leads in terms of adoption, but growing awareness and changing lifestyles in regions like Europe and Asia Pacific indicate substantial future growth opportunities in these areas. The continuing evolution of designs, incorporating advanced technologies and energy-efficient features, promises to further drive market expansion and attract a wider consumer base. Successful market players will need to focus on efficient production, innovative designs, and strategic marketing to capitalize on this expanding sector.
Tiny Homes Market Company Market Share
Tiny Homes Market: A Comprehensive Market Report (2019-2033)
This dynamic report provides a comprehensive analysis of the Tiny Homes Market, projecting a robust growth trajectory fueled by evolving consumer preferences and technological advancements. The study covers the period 2019-2033, with a focus on the estimated year 2025 and a forecast period spanning 2025-2033. The report leverages detailed market segmentation, competitive landscaping, and key industry developments to offer actionable insights for stakeholders across the value chain. With a projected market value exceeding USD xx Million by 2033, this report is an invaluable resource for businesses seeking to navigate and capitalize on the burgeoning opportunities within this dynamic sector.
Tiny Homes Market Structure & Competitive Landscape
The Tiny Homes Market is characterized by a moderately fragmented competitive landscape, with a growing number of players ranging from established manufacturers to innovative startups. While market concentration ratios remain relatively low (xx%), the industry is witnessing increasing consolidation through mergers and acquisitions (M&A). The total M&A volume in the sector reached USD xx Million in 2024.
Key Market Structure Aspects:
- Innovation Drivers: Sustainable building materials, smart home integration, and customizable designs are key innovation drivers.
- Regulatory Impacts: Zoning regulations and building codes significantly influence market growth, varying widely across regions.
- Product Substitutes: Traditional housing and alternative dwelling options present competitive pressures.
- End-User Segmentation: The market caters to diverse end-users, including households seeking affordable housing, commercial entities utilizing tiny homes for unique retail spaces, and industrial users adopting them for on-site accommodation or specialized purposes.
- M&A Trends: Increased M&A activity reflects consolidation efforts among established players and expansion strategies by larger companies looking to increase their market share.
Tiny Homes Market Trends & Opportunities
The global Tiny Homes Market is experiencing significant growth, driven by several converging factors. The market size is projected to reach USD xx Million by 2025, exhibiting a Compound Annual Growth Rate (CAGR) of xx% during the forecast period (2025-2033). This growth is fueled by rising awareness of environmental sustainability, a preference for minimalist lifestyles, and the increasing affordability of tiny homes compared to conventional housing.
Market Dynamics:
- Market Size Growth: The market is experiencing a rapid expansion, particularly in developed countries and urban areas facing housing shortages.
- Technological Shifts: Advancements in building materials, construction techniques, and smart home technology are driving product innovation and efficiency gains.
- Consumer Preferences: Growing interest in sustainable living, affordability, and flexible living spaces is boosting demand for tiny homes.
- Competitive Dynamics: Increased competition is driving innovation and price optimization, benefiting consumers. Market penetration rates are expected to increase significantly during the forecast period, reaching xx% by 2033.
Dominant Markets & Segments in Tiny Homes Market
The Tiny Homes Market exhibits significant regional variations in growth and market dominance. While North America and Europe currently hold a substantial market share, Asia Pacific is emerging as a high-growth region. In terms of market segments, the following show promising growth potential:
Key Growth Drivers:
- Household Segment: This segment dominates the market, driven by increasing demand for affordable and sustainable housing solutions.
- Mobile Tiny Homes: Portability and flexibility are key features driving popularity in this segment.
- 130-500 Sq. Ft. Segment: This segment strikes a balance between affordability and living space, attracting a large consumer base.
Market Dominance Analysis:
- Region: North America currently holds the largest market share, driven by high adoption rates and favorable regulatory environments. However, the Asia Pacific region is expected to experience the highest growth rate during the forecast period.
- Country: The United States currently leads in market size, followed by Canada and certain European countries.
- Segment: The Household segment, within the 130-500 sq. ft. range, represents the most significant revenue contributor. Growth is driven by factors such as increased awareness of environmental concerns, rising housing costs in urban areas and the appeal of a simpler lifestyle.
Tiny Homes Market Product Analysis
Tiny homes are increasingly incorporating advanced technologies, such as smart home integration and energy-efficient designs. Manufacturers are focusing on creating highly customizable and modular designs to cater to diverse consumer preferences. This strategy encompasses mobile and stationary models, across various sizes and functionalities. The competitive advantage lies in offering innovative features, superior build quality, and exceptional customer service.
Key Drivers, Barriers & Challenges in Tiny Homes Market
Key Drivers:
- Affordability: Tiny homes offer a significantly more affordable housing solution compared to traditional homes.
- Sustainability: Growing environmental consciousness fuels the demand for eco-friendly and sustainable housing options.
- Technological Advancements: Innovations in design, materials, and construction techniques enhance efficiency and appeal.
Challenges & Restraints:
- Regulatory Hurdles: Varied and often restrictive zoning laws and building codes pose significant obstacles to market growth. This results in delays and added costs for developers, thereby impacting the final product price.
- Supply Chain Issues: Disruptions in the supply chain for building materials can impact production timelines and increase costs. This can be particularly impactful on a highly customized product such as tiny homes. These issues have added approximately xx% to the cost of materials in the past year.
- Competitive Pressures: Increased competition is driving down profit margins and requiring continuous innovation to stay ahead.
Growth Drivers in the Tiny Homes Market Market
The Tiny Homes Market's growth is propelled by affordability, sustainability concerns, and technological advancements leading to improved designs and energy efficiency. Favorable government incentives and supportive regulations in certain regions further contribute to market expansion.
Challenges Impacting Tiny Homes Market Growth
Significant challenges include inconsistent and restrictive zoning regulations across different regions, impacting market penetration. Supply chain vulnerabilities and fluctuating material costs pose additional challenges. Intense competition requires continuous innovation to maintain a competitive edge.
Key Players Shaping the Tiny Homes Market Market
- Aussie Tiny Houses
- Tumbleweed Tiny House Company
- Tiny SMART House Inc
- Cavco Industries Inc
- Skyline Champion Corporation
- Mustard Seed Tiny Homes LLC
- CargoHome
- Mini Mansions Tiny Home Builders LLC
- Berkshire Hathaway Inc
- Nestron
Significant Tiny Homes Market Industry Milestones
- February 2023: Sentosa Development Corporation launched low-carbon tiny houses on Lazarus Island, Singapore, marking a significant step towards sustainable housing solutions.
- February 2023: The USD 14 Million mixed-use project in Cedar Hill, Texas, by Jim Lake Companies, integrating tiny homes with retail spaces, showcases the growing versatility of tiny homes in commercial applications.
- February 2023: A new residential complex in Meriden, Connecticut, featuring tiny homes ranging from 384 to 480 square feet, demonstrates the increasing acceptance of downsizing and alternative housing models.
Future Outlook for Tiny Homes Market Market
The Tiny Homes Market is poised for continued growth, driven by sustained demand for affordable and sustainable housing. Strategic partnerships, technological innovations, and expansion into new geographical markets present significant opportunities for growth. The market's potential is considerable, with projections indicating substantial expansion in the coming years.
Tiny Homes Market Segmentation
-
1. Product Type
- 1.1. Mobile Tiny Homes
- 1.2. Stationary Tiny Homes
-
2. Area
- 2.1. Less Than 130 Sq. Ft.
- 2.2. 130-500 Sq. Ft.
- 2.3. More Than 500 Sq. Ft.
-
3. Application
- 3.1. Household
- 3.2. Commercial
- 3.3. Industrial
- 3.4. Others
Tiny Homes Market Segmentation By Geography
- 1. North America
- 2. Europe
- 3. Asia Pacific
- 4. South America
- 5. Middle East
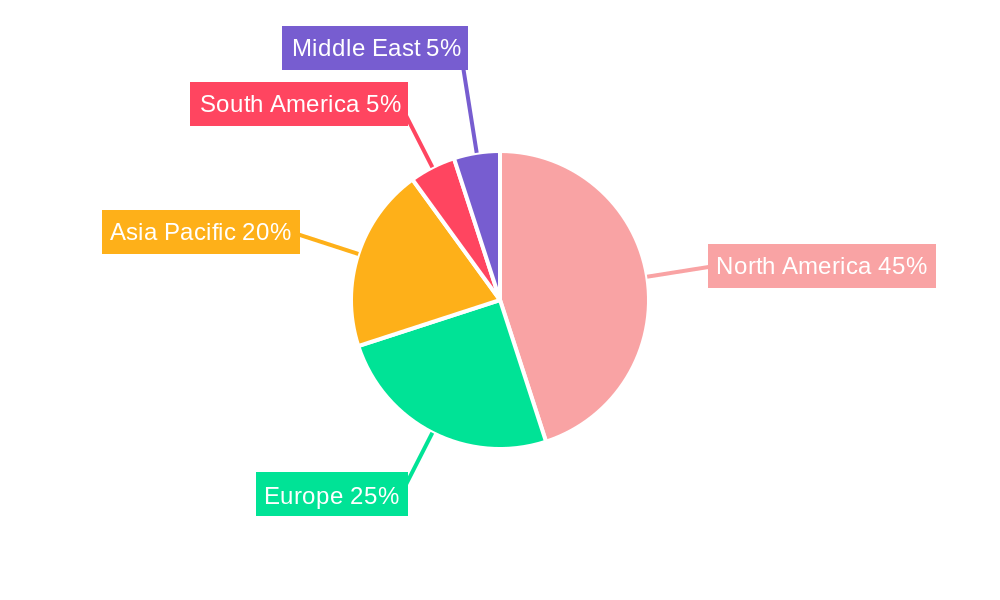
Tiny Homes Market Regional Market Share
Geographic Coverage of Tiny Homes Market
Tiny Homes Market REPORT HIGHLIGHTS
| Aspects | Details |
|---|---|
| Study Period | 2020-2034 |
| Base Year | 2025 |
| Estimated Year | 2026 |
| Forecast Period | 2026-2034 |
| Historical Period | 2020-2025 |
| Growth Rate | CAGR of 5.00% from 2020-2034 |
| Segmentation |
|
Table of Contents
- 1. Introduction
- 1.1. Research Scope
- 1.2. Market Segmentation
- 1.3. Research Objective
- 1.4. Definitions and Assumptions
- 2. Executive Summary
- 2.1. Market Snapshot
- 3. Market Dynamics
- 3.1. Market Drivers
- 3.2. Market Restrains
- 3.3. Market Trends
- 3.4. Market Opportunities
- 4. Market Factor Analysis
- 4.1. Porters Five Forces
- 4.1.1. Bargaining Power of Suppliers
- 4.1.2. Bargaining Power of Buyers
- 4.1.3. Threat of New Entrants
- 4.1.4. Threat of Substitutes
- 4.1.5. Competitive Rivalry
- 4.2. PESTEL analysis
- 4.3. BCG Analysis
- 4.3.1. Stars (High Growth, High Market Share)
- 4.3.2. Cash Cows (Low Growth, High Market Share)
- 4.3.3. Question Mark (High Growth, Low Market Share)
- 4.3.4. Dogs (Low Growth, Low Market Share)
- 4.4. Ansoff Matrix Analysis
- 4.5. Supply Chain Analysis
- 4.6. Regulatory Landscape
- 4.7. Current Market Potential and Opportunity Assessment (TAM–SAM–SOM Framework)
- 4.8. TIR Analyst Note
- 4.1. Porters Five Forces
- 5. Market Analysis, Insights and Forecast 2021-2033
- 5.1. Market Analysis, Insights and Forecast - by Product Type
- 5.1.1. Mobile Tiny Homes
- 5.1.2. Stationary Tiny Homes
- 5.2. Market Analysis, Insights and Forecast - by Area
- 5.2.1. Less Than 130 Sq. Ft.
- 5.2.2. 130-500 Sq. Ft.
- 5.2.3. More Than 500 Sq. Ft.
- 5.3. Market Analysis, Insights and Forecast - by Application
- 5.3.1. Household
- 5.3.2. Commercial
- 5.3.3. Industrial
- 5.3.4. Others
- 5.4. Market Analysis, Insights and Forecast - by Region
- 5.4.1. North America
- 5.4.2. Europe
- 5.4.3. Asia Pacific
- 5.4.4. South America
- 5.4.5. Middle East
- 5.1. Market Analysis, Insights and Forecast - by Product Type
- 6. Global Tiny Homes Market Analysis, Insights and Forecast, 2021-2033
- 6.1. Market Analysis, Insights and Forecast - by Product Type
- 6.1.1. Mobile Tiny Homes
- 6.1.2. Stationary Tiny Homes
- 6.2. Market Analysis, Insights and Forecast - by Area
- 6.2.1. Less Than 130 Sq. Ft.
- 6.2.2. 130-500 Sq. Ft.
- 6.2.3. More Than 500 Sq. Ft.
- 6.3. Market Analysis, Insights and Forecast - by Application
- 6.3.1. Household
- 6.3.2. Commercial
- 6.3.3. Industrial
- 6.3.4. Others
- 6.1. Market Analysis, Insights and Forecast - by Product Type
- 7. North America Tiny Homes Market Analysis, Insights and Forecast, 2020-2032
- 7.1. Market Analysis, Insights and Forecast - by Product Type
- 7.1.1. Mobile Tiny Homes
- 7.1.2. Stationary Tiny Homes
- 7.2. Market Analysis, Insights and Forecast - by Area
- 7.2.1. Less Than 130 Sq. Ft.
- 7.2.2. 130-500 Sq. Ft.
- 7.2.3. More Than 500 Sq. Ft.
- 7.3. Market Analysis, Insights and Forecast - by Application
- 7.3.1. Household
- 7.3.2. Commercial
- 7.3.3. Industrial
- 7.3.4. Others
- 7.1. Market Analysis, Insights and Forecast - by Product Type
- 8. Europe Tiny Homes Market Analysis, Insights and Forecast, 2020-2032
- 8.1. Market Analysis, Insights and Forecast - by Product Type
- 8.1.1. Mobile Tiny Homes
- 8.1.2. Stationary Tiny Homes
- 8.2. Market Analysis, Insights and Forecast - by Area
- 8.2.1. Less Than 130 Sq. Ft.
- 8.2.2. 130-500 Sq. Ft.
- 8.2.3. More Than 500 Sq. Ft.
- 8.3. Market Analysis, Insights and Forecast - by Application
- 8.3.1. Household
- 8.3.2. Commercial
- 8.3.3. Industrial
- 8.3.4. Others
- 8.1. Market Analysis, Insights and Forecast - by Product Type
- 9. Asia Pacific Tiny Homes Market Analysis, Insights and Forecast, 2020-2032
- 9.1. Market Analysis, Insights and Forecast - by Product Type
- 9.1.1. Mobile Tiny Homes
- 9.1.2. Stationary Tiny Homes
- 9.2. Market Analysis, Insights and Forecast - by Area
- 9.2.1. Less Than 130 Sq. Ft.
- 9.2.2. 130-500 Sq. Ft.
- 9.2.3. More Than 500 Sq. Ft.
- 9.3. Market Analysis, Insights and Forecast - by Application
- 9.3.1. Household
- 9.3.2. Commercial
- 9.3.3. Industrial
- 9.3.4. Others
- 9.1. Market Analysis, Insights and Forecast - by Product Type
- 10. South America Tiny Homes Market Analysis, Insights and Forecast, 2020-2032
- 10.1. Market Analysis, Insights and Forecast - by Product Type
- 10.1.1. Mobile Tiny Homes
- 10.1.2. Stationary Tiny Homes
- 10.2. Market Analysis, Insights and Forecast - by Area
- 10.2.1. Less Than 130 Sq. Ft.
- 10.2.2. 130-500 Sq. Ft.
- 10.2.3. More Than 500 Sq. Ft.
- 10.3. Market Analysis, Insights and Forecast - by Application
- 10.3.1. Household
- 10.3.2. Commercial
- 10.3.3. Industrial
- 10.3.4. Others
- 10.1. Market Analysis, Insights and Forecast - by Product Type
- 11. Middle East Tiny Homes Market Analysis, Insights and Forecast, 2020-2032
- 11.1. Market Analysis, Insights and Forecast - by Product Type
- 11.1.1. Mobile Tiny Homes
- 11.1.2. Stationary Tiny Homes
- 11.2. Market Analysis, Insights and Forecast - by Area
- 11.2.1. Less Than 130 Sq. Ft.
- 11.2.2. 130-500 Sq. Ft.
- 11.2.3. More Than 500 Sq. Ft.
- 11.3. Market Analysis, Insights and Forecast - by Application
- 11.3.1. Household
- 11.3.2. Commercial
- 11.3.3. Industrial
- 11.3.4. Others
- 11.1. Market Analysis, Insights and Forecast - by Product Type
- 12. Competitive Analysis
- 12.1. Company Profiles
- 12.1.1 Aussie Tiny Houses
- 12.1.1.1. Company Overview
- 12.1.1.2. Products
- 12.1.1.3. Company Financials
- 12.1.1.4. SWOT Analysis
- 12.1.2 Tumbleweed Tiny House Company
- 12.1.2.1. Company Overview
- 12.1.2.2. Products
- 12.1.2.3. Company Financials
- 12.1.2.4. SWOT Analysis
- 12.1.3 Tiny SMART House Inc
- 12.1.3.1. Company Overview
- 12.1.3.2. Products
- 12.1.3.3. Company Financials
- 12.1.3.4. SWOT Analysis
- 12.1.4 Cavco Industries Inc
- 12.1.4.1. Company Overview
- 12.1.4.2. Products
- 12.1.4.3. Company Financials
- 12.1.4.4. SWOT Analysis
- 12.1.5 Skyline Champion Corporation
- 12.1.5.1. Company Overview
- 12.1.5.2. Products
- 12.1.5.3. Company Financials
- 12.1.5.4. SWOT Analysis
- 12.1.6 Mustard Seed Tiny Homes LLC
- 12.1.6.1. Company Overview
- 12.1.6.2. Products
- 12.1.6.3. Company Financials
- 12.1.6.4. SWOT Analysis
- 12.1.7 CargoHome
- 12.1.7.1. Company Overview
- 12.1.7.2. Products
- 12.1.7.3. Company Financials
- 12.1.7.4. SWOT Analysis
- 12.1.8 Mini Mansions Tiny Home Builders LLC
- 12.1.8.1. Company Overview
- 12.1.8.2. Products
- 12.1.8.3. Company Financials
- 12.1.8.4. SWOT Analysis
- 12.1.9 Berkshire Hathaway Inc
- 12.1.9.1. Company Overview
- 12.1.9.2. Products
- 12.1.9.3. Company Financials
- 12.1.9.4. SWOT Analysis
- 12.1.10 Nestron**List Not Exhaustive
- 12.1.10.1. Company Overview
- 12.1.10.2. Products
- 12.1.10.3. Company Financials
- 12.1.10.4. SWOT Analysis
- 12.1.1 Aussie Tiny Houses
- 12.2. Market Entropy
- 12.2.1 Company's Key Areas Served
- 12.2.2 Recent Developments
- 12.3. Company Market Share Analysis 2025
- 12.3.1 Top 5 Companies Market Share Analysis
- 12.3.2 Top 3 Companies Market Share Analysis
- 12.4. List of Potential Customers
- 13. Research Methodology
List of Figures
- Figure 1: Global Tiny Homes Market Revenue Breakdown (Million, %) by Region 2025 & 2033
- Figure 2: North America Tiny Homes Market Revenue (Million), by Product Type 2025 & 2033
- Figure 3: North America Tiny Homes Market Revenue Share (%), by Product Type 2025 & 2033
- Figure 4: North America Tiny Homes Market Revenue (Million), by Area 2025 & 2033
- Figure 5: North America Tiny Homes Market Revenue Share (%), by Area 2025 & 2033
- Figure 6: North America Tiny Homes Market Revenue (Million), by Application 2025 & 2033
- Figure 7: North America Tiny Homes Market Revenue Share (%), by Application 2025 & 2033
- Figure 8: North America Tiny Homes Market Revenue (Million), by Country 2025 & 2033
- Figure 9: North America Tiny Homes Market Revenue Share (%), by Country 2025 & 2033
- Figure 10: Europe Tiny Homes Market Revenue (Million), by Product Type 2025 & 2033
- Figure 11: Europe Tiny Homes Market Revenue Share (%), by Product Type 2025 & 2033
- Figure 12: Europe Tiny Homes Market Revenue (Million), by Area 2025 & 2033
- Figure 13: Europe Tiny Homes Market Revenue Share (%), by Area 2025 & 2033
- Figure 14: Europe Tiny Homes Market Revenue (Million), by Application 2025 & 2033
- Figure 15: Europe Tiny Homes Market Revenue Share (%), by Application 2025 & 2033
- Figure 16: Europe Tiny Homes Market Revenue (Million), by Country 2025 & 2033
- Figure 17: Europe Tiny Homes Market Revenue Share (%), by Country 2025 & 2033
- Figure 18: Asia Pacific Tiny Homes Market Revenue (Million), by Product Type 2025 & 2033
- Figure 19: Asia Pacific Tiny Homes Market Revenue Share (%), by Product Type 2025 & 2033
- Figure 20: Asia Pacific Tiny Homes Market Revenue (Million), by Area 2025 & 2033
- Figure 21: Asia Pacific Tiny Homes Market Revenue Share (%), by Area 2025 & 2033
- Figure 22: Asia Pacific Tiny Homes Market Revenue (Million), by Application 2025 & 2033
- Figure 23: Asia Pacific Tiny Homes Market Revenue Share (%), by Application 2025 & 2033
- Figure 24: Asia Pacific Tiny Homes Market Revenue (Million), by Country 2025 & 2033
- Figure 25: Asia Pacific Tiny Homes Market Revenue Share (%), by Country 2025 & 2033
- Figure 26: South America Tiny Homes Market Revenue (Million), by Product Type 2025 & 2033
- Figure 27: South America Tiny Homes Market Revenue Share (%), by Product Type 2025 & 2033
- Figure 28: South America Tiny Homes Market Revenue (Million), by Area 2025 & 2033
- Figure 29: South America Tiny Homes Market Revenue Share (%), by Area 2025 & 2033
- Figure 30: South America Tiny Homes Market Revenue (Million), by Application 2025 & 2033
- Figure 31: South America Tiny Homes Market Revenue Share (%), by Application 2025 & 2033
- Figure 32: South America Tiny Homes Market Revenue (Million), by Country 2025 & 2033
- Figure 33: South America Tiny Homes Market Revenue Share (%), by Country 2025 & 2033
- Figure 34: Middle East Tiny Homes Market Revenue (Million), by Product Type 2025 & 2033
- Figure 35: Middle East Tiny Homes Market Revenue Share (%), by Product Type 2025 & 2033
- Figure 36: Middle East Tiny Homes Market Revenue (Million), by Area 2025 & 2033
- Figure 37: Middle East Tiny Homes Market Revenue Share (%), by Area 2025 & 2033
- Figure 38: Middle East Tiny Homes Market Revenue (Million), by Application 2025 & 2033
- Figure 39: Middle East Tiny Homes Market Revenue Share (%), by Application 2025 & 2033
- Figure 40: Middle East Tiny Homes Market Revenue (Million), by Country 2025 & 2033
- Figure 41: Middle East Tiny Homes Market Revenue Share (%), by Country 2025 & 2033
List of Tables
- Table 1: Global Tiny Homes Market Revenue Million Forecast, by Product Type 2020 & 2033
- Table 2: Global Tiny Homes Market Revenue Million Forecast, by Area 2020 & 2033
- Table 3: Global Tiny Homes Market Revenue Million Forecast, by Application 2020 & 2033
- Table 4: Global Tiny Homes Market Revenue Million Forecast, by Region 2020 & 2033
- Table 5: Global Tiny Homes Market Revenue Million Forecast, by Product Type 2020 & 2033
- Table 6: Global Tiny Homes Market Revenue Million Forecast, by Area 2020 & 2033
- Table 7: Global Tiny Homes Market Revenue Million Forecast, by Application 2020 & 2033
- Table 8: Global Tiny Homes Market Revenue Million Forecast, by Country 2020 & 2033
- Table 9: Global Tiny Homes Market Revenue Million Forecast, by Product Type 2020 & 2033
- Table 10: Global Tiny Homes Market Revenue Million Forecast, by Area 2020 & 2033
- Table 11: Global Tiny Homes Market Revenue Million Forecast, by Application 2020 & 2033
- Table 12: Global Tiny Homes Market Revenue Million Forecast, by Country 2020 & 2033
- Table 13: Global Tiny Homes Market Revenue Million Forecast, by Product Type 2020 & 2033
- Table 14: Global Tiny Homes Market Revenue Million Forecast, by Area 2020 & 2033
- Table 15: Global Tiny Homes Market Revenue Million Forecast, by Application 2020 & 2033
- Table 16: Global Tiny Homes Market Revenue Million Forecast, by Country 2020 & 2033
- Table 17: Global Tiny Homes Market Revenue Million Forecast, by Product Type 2020 & 2033
- Table 18: Global Tiny Homes Market Revenue Million Forecast, by Area 2020 & 2033
- Table 19: Global Tiny Homes Market Revenue Million Forecast, by Application 2020 & 2033
- Table 20: Global Tiny Homes Market Revenue Million Forecast, by Country 2020 & 2033
- Table 21: Global Tiny Homes Market Revenue Million Forecast, by Product Type 2020 & 2033
- Table 22: Global Tiny Homes Market Revenue Million Forecast, by Area 2020 & 2033
- Table 23: Global Tiny Homes Market Revenue Million Forecast, by Application 2020 & 2033
- Table 24: Global Tiny Homes Market Revenue Million Forecast, by Country 2020 & 2033
Frequently Asked Questions
1. What is the projected Compound Annual Growth Rate (CAGR) of the Tiny Homes Market?
The projected CAGR is approximately 5.00%.
2. Which companies are prominent players in the Tiny Homes Market?
Key companies in the market include Aussie Tiny Houses, Tumbleweed Tiny House Company, Tiny SMART House Inc, Cavco Industries Inc, Skyline Champion Corporation, Mustard Seed Tiny Homes LLC, CargoHome, Mini Mansions Tiny Home Builders LLC, Berkshire Hathaway Inc, Nestron**List Not Exhaustive.
3. What are the main segments of the Tiny Homes Market?
The market segments include Product Type, Area, Application.
4. Can you provide details about the market size?
The market size is estimated to be USD 19.20 Million as of 2022.
5. What are some drivers contributing to market growth?
4.; Increase In Tourism Industry4.; Sustainability and Environmental Concerns.
6. What are the notable trends driving market growth?
Household Segment Anticipated to Hold Major Share Due to Increasing Demand for Affordable Housing.
7. Are there any restraints impacting market growth?
4.; Financial Constraints4.; High Maintenance.
8. Can you provide examples of recent developments in the market?
February 2023: Sentosa Development Corporation launched low-carbon tiny houses on Lazarus Island for the first time. These tiny homes measure between 170 square feet. Tiny homes are designed in an open-plan concept consisting of a bedroom, kitchenette, living area, and outdoor deck.
9. What pricing options are available for accessing the report?
Pricing options include single-user, multi-user, and enterprise licenses priced at USD 4750, USD 5250, and USD 8750 respectively.
10. Is the market size provided in terms of value or volume?
The market size is provided in terms of value, measured in Million.
11. Are there any specific market keywords associated with the report?
Yes, the market keyword associated with the report is "Tiny Homes Market," which aids in identifying and referencing the specific market segment covered.
12. How do I determine which pricing option suits my needs best?
The pricing options vary based on user requirements and access needs. Individual users may opt for single-user licenses, while businesses requiring broader access may choose multi-user or enterprise licenses for cost-effective access to the report.
13. Are there any additional resources or data provided in the Tiny Homes Market report?
While the report offers comprehensive insights, it's advisable to review the specific contents or supplementary materials provided to ascertain if additional resources or data are available.
14. How can I stay updated on further developments or reports in the Tiny Homes Market?
To stay informed about further developments, trends, and reports in the Tiny Homes Market, consider subscribing to industry newsletters, following relevant companies and organizations, or regularly checking reputable industry news sources and publications.
Methodology
Step 1 - Identification of Relevant Samples Size from Population Database


Step 2 - Approaches for Defining Global Market Size (Value, Volume* & Price*)

Note*: In applicable scenarios
Step 3 - Data Sources
Primary Research
- Web Analytics
- Survey Reports
- Research Institute
- Latest Research Reports
- Opinion Leaders
Secondary Research
- Annual Reports
- White Paper
- Latest Press Release
- Industry Association
- Paid Database
- Investor Presentations

Step 4 - Data Triangulation
Involves using different sources of information in order to increase the validity of a study
These sources are likely to be stakeholders in a program - participants, other researchers, program staff, other community members, and so on.
Then we put all data in single framework & apply various statistical tools to find out the dynamic on the market.
During the analysis stage, feedback from the stakeholder groups would be compared to determine areas of agreement as well as areas of divergence