

Key Insights
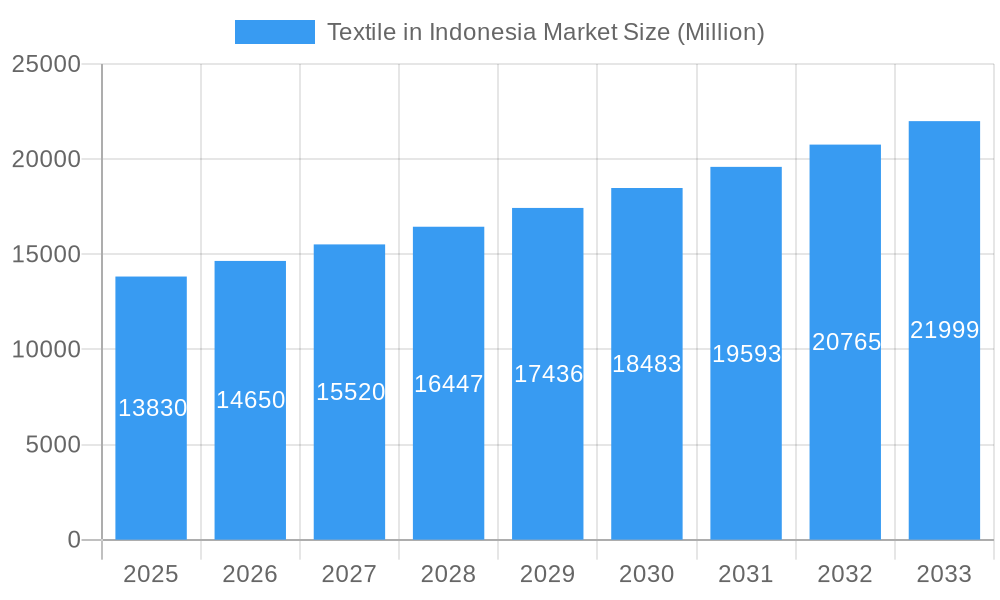
The Indonesian textile market, valued at $13.83 billion in 2025, exhibits robust growth potential, projected to expand at a Compound Annual Growth Rate (CAGR) exceeding 5.54% from 2025 to 2033. This growth is fueled by several key factors. Firstly, Indonesia's burgeoning domestic consumption, driven by a large and growing population with increasing disposable incomes, significantly boosts demand for textiles across various segments, including apparel, home furnishings, and industrial applications. Secondly, the government's initiatives to support the textile industry through infrastructure development, investment incentives, and skill development programs further enhance the market's trajectory. Moreover, the rising popularity of Indonesian fashion brands both domestically and internationally contributes to increased production and exports. However, the market faces challenges such as competition from cheaper imports, fluctuations in raw material prices (particularly cotton), and the need for continuous technological upgrades to enhance efficiency and competitiveness. Major players like PT Ever Shine Tex Tbk, PT Trisula Textile Industries Tbk, and PT Sri Rejeki Isman Tbk are key contributors to the market's dynamism, constantly innovating to meet evolving consumer preferences and global standards. The market segmentation likely includes various textile types (cotton, synthetic, etc.), end-use applications (apparel, home textiles, industrial fabrics), and manufacturing processes (woven, knitted, etc.). The regional distribution of the market within Indonesia itself is likely uneven, with concentrations in major manufacturing hubs.
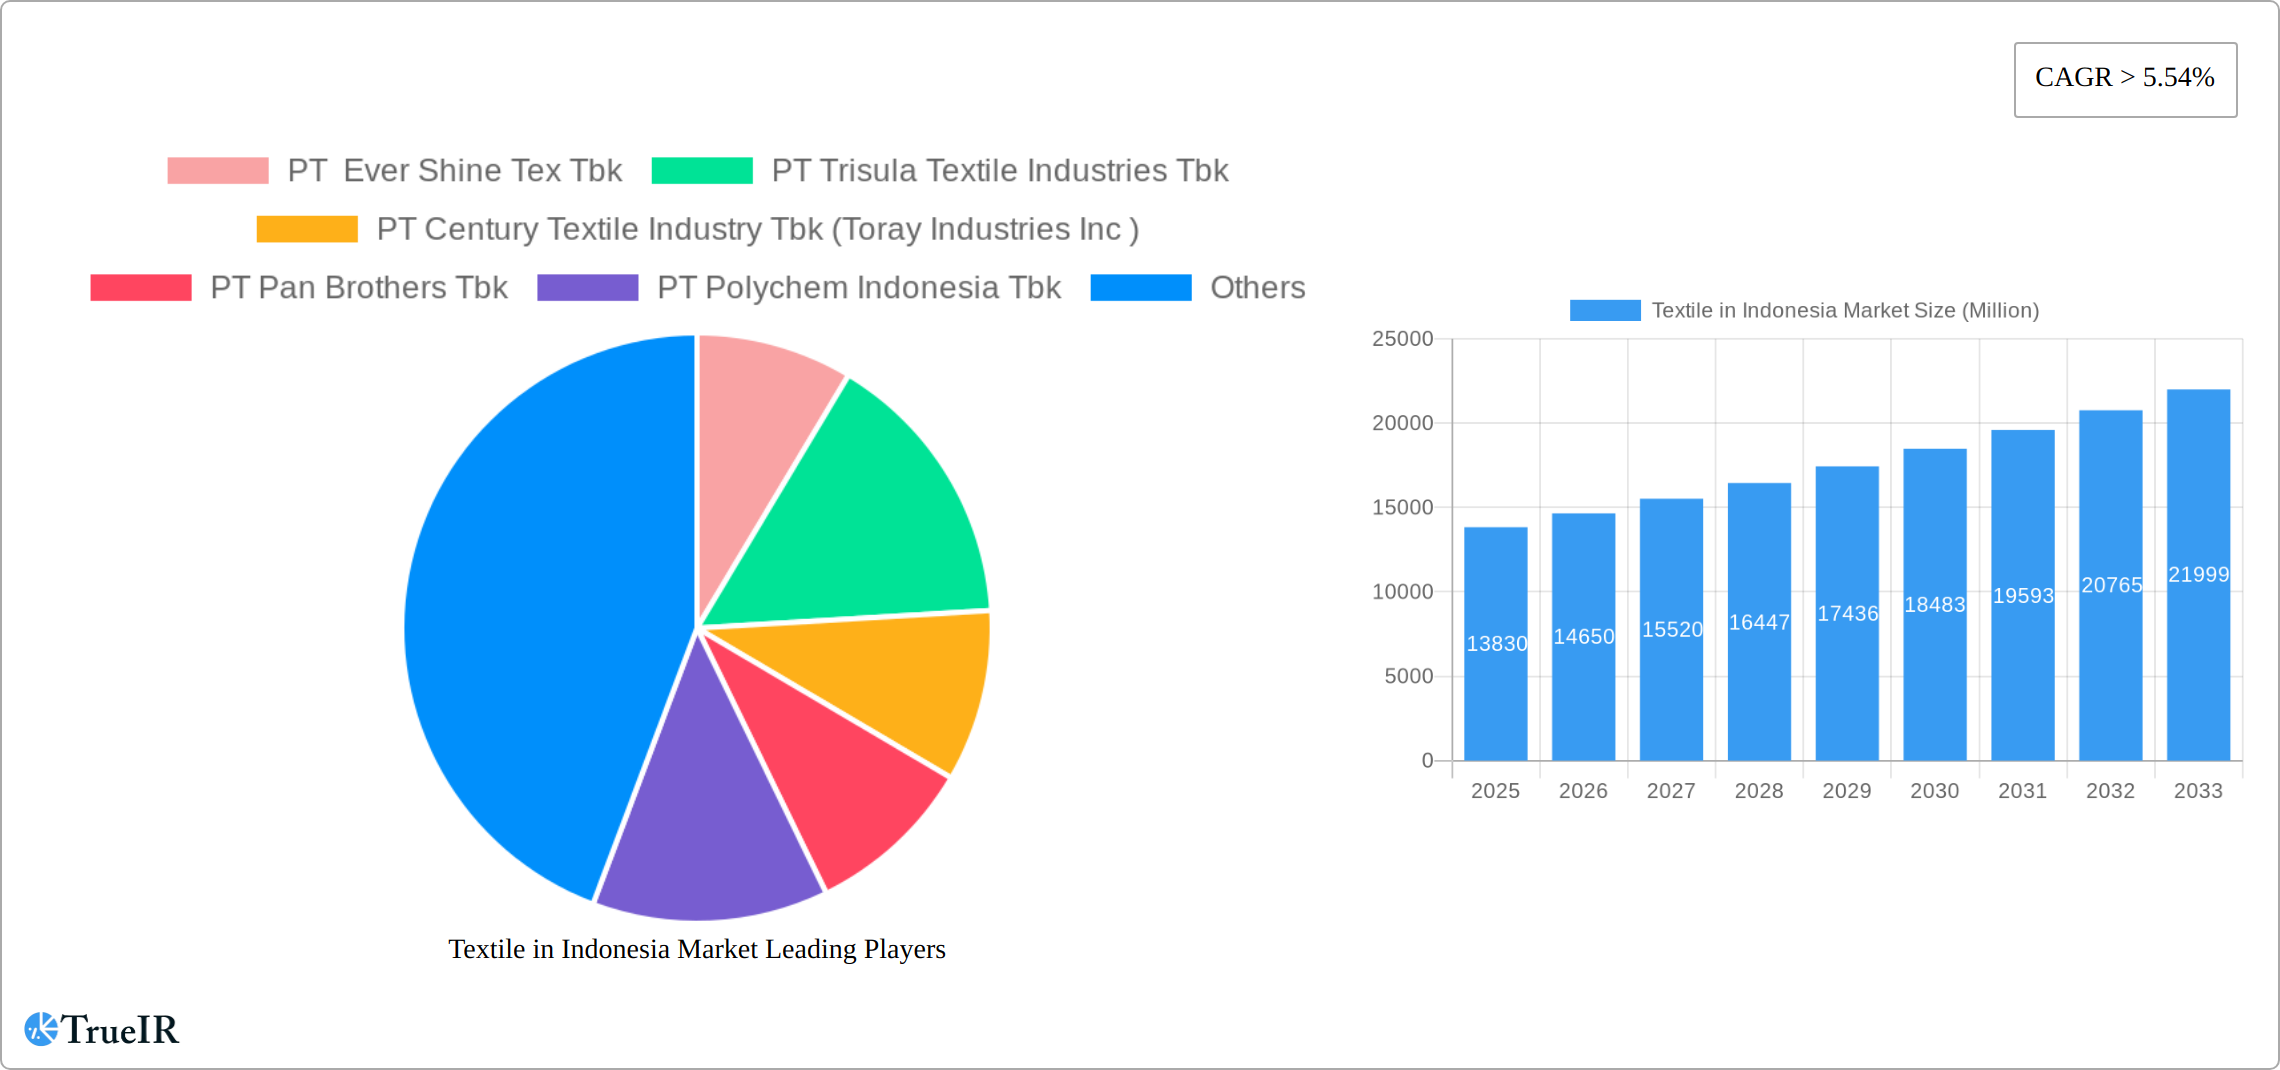
Textile in Indonesia Market Market Size (In Billion)
The forecast period (2025-2033) anticipates continued expansion, albeit with potential variations year-on-year depending on macroeconomic conditions and global trade dynamics. Sustained growth requires ongoing investment in research and development to embrace sustainable practices and advanced technologies. Addressing challenges related to labor costs and environmental regulations will be crucial for maintaining long-term competitiveness. The Indonesian textile market presents a compelling investment opportunity for both domestic and international players, though a thorough understanding of the specific segments and related challenges is essential for success. Further analysis of regional data and specific market segments would provide a more precise picture of future growth prospects.
Textile in Indonesia Market Company Market Share
Indonesia Textile Market Report: 2019-2033
This comprehensive report provides an in-depth analysis of the Indonesian textile market, encompassing market size, competitive landscape, growth drivers, challenges, and future outlook. With a study period spanning 2019-2033, a base year of 2025, and a forecast period of 2025-2033, this report is an essential resource for industry professionals, investors, and policymakers. The report leverages millions of data points and incorporates the latest industry developments, including significant partnerships and expansions.
Textile in Indonesia Market Market Structure & Competitive Landscape
The Indonesian textile market presents a moderately concentrated structure, with several significant players holding sway over specific niches. Our 2024 Herfindahl-Hirschman Index (HHI) estimate of xx underscores a moderately competitive environment. Key drivers of innovation include advancements in textile manufacturing technologies (automation, digital printing, and sophisticated weaving techniques), a growing emphasis on sustainable and ethical production practices, and a surge in demand for specialized textiles catering to diverse applications. Government regulations, encompassing labor laws and stringent environmental standards, significantly influence market dynamics. The competitive landscape is further shaped by the presence of product substitutes, including synthetic materials and imported textiles. Market segmentation is defined by fiber type (cotton, synthetic, blended, and natural fibers like silk and rayon), textile type (woven, knitted, non-woven, and lace), and end-use applications (apparel, home textiles, industrial textiles, and technical textiles). Mergers and acquisitions (M&A) activity exhibited moderate levels in recent years, with approximately xx Million USD in recorded transactions between 2019 and 2024, indicating consolidation and strategic expansion within the sector.
- Market Concentration: Moderately concentrated, with an estimated HHI of xx in 2024.
- Innovation Drivers: Technological advancements (automation, digital printing), sustainable production, demand for specialized and high-performance textiles.
- Regulatory Impacts: Labor laws and environmental regulations significantly influence market operations and production costs.
- Product Substitutes: Synthetic materials and imported textiles present competitive challenges.
- End-User Segmentation: Apparel, home textiles, industrial textiles, and a growing technical textiles segment.
- M&A Trends: Moderate activity, with approximately xx Million USD in transactions (2019-2024), reflecting strategic industry consolidation.
Textile in Indonesia Market Market Trends & Opportunities
The Indonesian textile market is experiencing robust growth, propelled by a burgeoning population, increasing disposable incomes, and a rise in domestic consumption. The market size is projected to reach xx Million USD by 2025, demonstrating a Compound Annual Growth Rate (CAGR) of xx% during the forecast period (2025-2033). Significant technological shifts, including widespread automation and the integration of digital technologies across the supply chain, are enhancing production efficiency and elevating product quality. A noticeable shift in consumer preferences towards sustainable and ethically sourced textiles is driving demand for eco-friendly materials and manufacturing practices. The competitive landscape is defined by factors such as strategic pricing, product differentiation, and robust brand building. Market penetration for specialized textiles, including technical textiles and performance fabrics designed for specific industries (e.g., automotive, medical), is gradually increasing, presenting lucrative opportunities for growth and innovation.
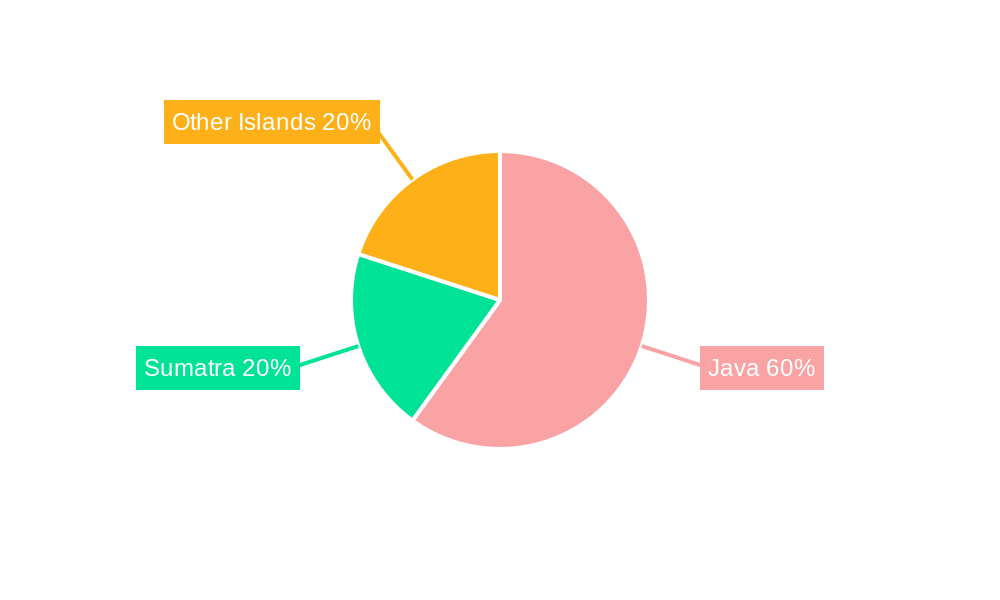
Dominant Markets & Segments in Textile in Indonesia Market
The apparel segment reigns supreme in the Indonesian textile market, accounting for approximately xx% of the total market value in 2024. Java Island maintains its position as the leading region for textile production and consumption, underpinned by its well-established infrastructure, a readily available skilled workforce, and its proximity to major consumption centers. This geographic concentration highlights the importance of logistical efficiency and access to markets.
- Key Growth Drivers for Apparel Segment:
- Robust domestic demand fueled by a growing population and rising middle-class incomes.
- A rising preference for fashionable and comfortable clothing, driving demand for diverse styles and fabrics.
- The expansion of the e-commerce sector, providing wider market access and accelerating sales growth.
- Market Dominance Analysis: Java Island's established infrastructure, skilled workforce, and strategic location solidify its dominant position in the textile industry.
Textile in Indonesia Market Product Analysis
Product innovation focuses on developing high-performance fabrics, sustainable materials, and technologically advanced textiles. Applications span diverse sectors, including apparel, home furnishings, and industrial uses. Competitive advantages stem from factors such as cost-effectiveness, quality, innovation, and brand reputation. Recent advancements in digital printing and fabric finishing technologies have enhanced product aesthetics and functionality.
Key Drivers, Barriers & Challenges in Textile in Indonesia Market
Key Drivers: Rising domestic consumption, increasing government support for the textile industry, and technological advancements drive market growth. Government initiatives promoting sustainable practices further stimulate the sector.
Challenges: Fluctuations in raw material prices, intense competition from imports, and infrastructure limitations present significant challenges. Regulatory complexities and supply chain disruptions also impact market dynamics. The impact of these challenges is estimated to reduce market growth by approximately xx% annually.
Growth Drivers in the Textile in Indonesia Market Market
Technological advancements, particularly in automation and digitalization, are streamlining production processes and enhancing overall efficiency, reducing costs and improving quality. Government initiatives designed to foster growth within the textile industry, such as tax incentives and investment subsidies, significantly contribute to market expansion. The increasing consumer preference for sustainable and ethically sourced textiles presents a major growth driver, pushing manufacturers to adopt eco-friendly practices and transparent supply chains. Furthermore, the increasing demand from regional and global brands seeking manufacturing partnerships is a significant factor contributing to Indonesia's textile sector growth.
Challenges Impacting Textile in Indonesia Market Growth
Supply chain disruptions caused by global events, such as pandemics or geopolitical instability, create uncertainty and increase costs. Intense competition from cheaper imports puts pressure on domestic producers. Environmental regulations necessitate investments in sustainable practices, which can be costly for smaller firms.
Key Players Shaping the Textile in Indonesia Market Market
- PT Ever Shine Tex Tbk
- PT Trisula Textile Industries Tbk
- PT Century Textile Industry Tbk (Toray Industries Inc)
- PT Pan Brothers Tbk
- PT Polychem Indonesia Tbk
- PT Sri Rejeki Isman Tbk
- PT Indo Kordsa Tbk
- PT Tifico Fiber Indonesia Tbk
- PT Panasia Group
- PT Asia Pacific Fibers Tbk
- PT Tyfountex Indonesia
- PT Eratex Djaja Tbk
- PT Argo Pantes Tbk
- Indorama Corporation (PT Indo-Rama Synthetics Tbk)
- 63 Other Companies
Significant Textile in Indonesia Market Industry Milestones
- October 2023: Renewcell's partnership with Southeast Asian Circulose Suppliers, including Indonesian companies, strengthens the circular economy within the Indonesian textile sector. This boosts the availability of sustainable materials and aligns with growing consumer demand for eco-friendly products.
- November 2023: WHP Global's licensing agreement with PT MAP expands the reach of the EXPRESS brand in Indonesia, signifying increased foreign investment and potential market growth in the apparel segment.
Future Outlook for Textile in Indonesia Market Market
The Indonesian textile market is poised for continued growth, driven by rising domestic consumption, technological innovation, and government support. Strategic opportunities exist in developing sustainable and high-value-added textile products, leveraging the country's abundant workforce and strategic location. The market's potential is substantial, with significant room for expansion in specialized textile segments.
Textile in Indonesia Market Segmentation
-
1. Application
- 1.1. Clothing
- 1.2. Industrial/Technical
- 1.3. Household
- 1.4. Other Applications
-
2. Material
- 2.1. Cotton
- 2.2. Jute
- 2.3. Silk
- 2.4. Synthetics
- 2.5. Wool
- 2.6. Other Materials
-
3. Process
- 3.1. Woven
- 3.2. Non-woven
Textile in Indonesia Market Segmentation By Geography
-
1. North America
- 1.1. United States
- 1.2. Canada
- 1.3. Mexico
-
2. South America
- 2.1. Brazil
- 2.2. Argentina
- 2.3. Rest of South America
-
3. Europe
- 3.1. United Kingdom
- 3.2. Germany
- 3.3. France
- 3.4. Italy
- 3.5. Spain
- 3.6. Russia
- 3.7. Benelux
- 3.8. Nordics
- 3.9. Rest of Europe
-
4. Middle East & Africa
- 4.1. Turkey
- 4.2. Israel
- 4.3. GCC
- 4.4. North Africa
- 4.5. South Africa
- 4.6. Rest of Middle East & Africa
-
5. Asia Pacific
- 5.1. China
- 5.2. India
- 5.3. Japan
- 5.4. South Korea
- 5.5. ASEAN
- 5.6. Oceania
- 5.7. Rest of Asia Pacific
Textile in Indonesia Market Regional Market Share
Geographic Coverage of Textile in Indonesia Market
Textile in Indonesia Market REPORT HIGHLIGHTS
| Aspects | Details |
|---|---|
| Study Period | 2020-2034 |
| Base Year | 2025 |
| Estimated Year | 2026 |
| Forecast Period | 2026-2034 |
| Historical Period | 2020-2025 |
| Growth Rate | CAGR of > 5.54% from 2020-2034 |
| Segmentation |
|
Table of Contents
- 1. Introduction
- 1.1. Research Scope
- 1.2. Market Segmentation
- 1.3. Research Objective
- 1.4. Definitions and Assumptions
- 2. Executive Summary
- 2.1. Market Snapshot
- 3. Market Dynamics
- 3.1. Market Drivers
- 3.2. Market Restrains
- 3.3. Market Trends
- 3.4. Market Opportunities
- 4. Market Factor Analysis
- 4.1. Porters Five Forces
- 4.1.1. Bargaining Power of Suppliers
- 4.1.2. Bargaining Power of Buyers
- 4.1.3. Threat of New Entrants
- 4.1.4. Threat of Substitutes
- 4.1.5. Competitive Rivalry
- 4.2. PESTEL analysis
- 4.3. BCG Analysis
- 4.3.1. Stars (High Growth, High Market Share)
- 4.3.2. Cash Cows (Low Growth, High Market Share)
- 4.3.3. Question Mark (High Growth, Low Market Share)
- 4.3.4. Dogs (Low Growth, Low Market Share)
- 4.4. Ansoff Matrix Analysis
- 4.5. Supply Chain Analysis
- 4.6. Regulatory Landscape
- 4.7. Current Market Potential and Opportunity Assessment (TAM–SAM–SOM Framework)
- 4.8. TIR Analyst Note
- 4.1. Porters Five Forces
- 5. Market Analysis, Insights and Forecast 2021-2033
- 5.1. Market Analysis, Insights and Forecast - by Application
- 5.1.1. Clothing
- 5.1.2. Industrial/Technical
- 5.1.3. Household
- 5.1.4. Other Applications
- 5.2. Market Analysis, Insights and Forecast - by Material
- 5.2.1. Cotton
- 5.2.2. Jute
- 5.2.3. Silk
- 5.2.4. Synthetics
- 5.2.5. Wool
- 5.2.6. Other Materials
- 5.3. Market Analysis, Insights and Forecast - by Process
- 5.3.1. Woven
- 5.3.2. Non-woven
- 5.4. Market Analysis, Insights and Forecast - by Region
- 5.4.1. North America
- 5.4.2. South America
- 5.4.3. Europe
- 5.4.4. Middle East & Africa
- 5.4.5. Asia Pacific
- 5.1. Market Analysis, Insights and Forecast - by Application
- 6. Global Textile in Indonesia Market Analysis, Insights and Forecast, 2021-2033
- 6.1. Market Analysis, Insights and Forecast - by Application
- 6.1.1. Clothing
- 6.1.2. Industrial/Technical
- 6.1.3. Household
- 6.1.4. Other Applications
- 6.2. Market Analysis, Insights and Forecast - by Material
- 6.2.1. Cotton
- 6.2.2. Jute
- 6.2.3. Silk
- 6.2.4. Synthetics
- 6.2.5. Wool
- 6.2.6. Other Materials
- 6.3. Market Analysis, Insights and Forecast - by Process
- 6.3.1. Woven
- 6.3.2. Non-woven
- 6.1. Market Analysis, Insights and Forecast - by Application
- 7. North America Textile in Indonesia Market Analysis, Insights and Forecast, 2020-2032
- 7.1. Market Analysis, Insights and Forecast - by Application
- 7.1.1. Clothing
- 7.1.2. Industrial/Technical
- 7.1.3. Household
- 7.1.4. Other Applications
- 7.2. Market Analysis, Insights and Forecast - by Material
- 7.2.1. Cotton
- 7.2.2. Jute
- 7.2.3. Silk
- 7.2.4. Synthetics
- 7.2.5. Wool
- 7.2.6. Other Materials
- 7.3. Market Analysis, Insights and Forecast - by Process
- 7.3.1. Woven
- 7.3.2. Non-woven
- 7.1. Market Analysis, Insights and Forecast - by Application
- 8. South America Textile in Indonesia Market Analysis, Insights and Forecast, 2020-2032
- 8.1. Market Analysis, Insights and Forecast - by Application
- 8.1.1. Clothing
- 8.1.2. Industrial/Technical
- 8.1.3. Household
- 8.1.4. Other Applications
- 8.2. Market Analysis, Insights and Forecast - by Material
- 8.2.1. Cotton
- 8.2.2. Jute
- 8.2.3. Silk
- 8.2.4. Synthetics
- 8.2.5. Wool
- 8.2.6. Other Materials
- 8.3. Market Analysis, Insights and Forecast - by Process
- 8.3.1. Woven
- 8.3.2. Non-woven
- 8.1. Market Analysis, Insights and Forecast - by Application
- 9. Europe Textile in Indonesia Market Analysis, Insights and Forecast, 2020-2032
- 9.1. Market Analysis, Insights and Forecast - by Application
- 9.1.1. Clothing
- 9.1.2. Industrial/Technical
- 9.1.3. Household
- 9.1.4. Other Applications
- 9.2. Market Analysis, Insights and Forecast - by Material
- 9.2.1. Cotton
- 9.2.2. Jute
- 9.2.3. Silk
- 9.2.4. Synthetics
- 9.2.5. Wool
- 9.2.6. Other Materials
- 9.3. Market Analysis, Insights and Forecast - by Process
- 9.3.1. Woven
- 9.3.2. Non-woven
- 9.1. Market Analysis, Insights and Forecast - by Application
- 10. Middle East & Africa Textile in Indonesia Market Analysis, Insights and Forecast, 2020-2032
- 10.1. Market Analysis, Insights and Forecast - by Application
- 10.1.1. Clothing
- 10.1.2. Industrial/Technical
- 10.1.3. Household
- 10.1.4. Other Applications
- 10.2. Market Analysis, Insights and Forecast - by Material
- 10.2.1. Cotton
- 10.2.2. Jute
- 10.2.3. Silk
- 10.2.4. Synthetics
- 10.2.5. Wool
- 10.2.6. Other Materials
- 10.3. Market Analysis, Insights and Forecast - by Process
- 10.3.1. Woven
- 10.3.2. Non-woven
- 10.1. Market Analysis, Insights and Forecast - by Application
- 11. Asia Pacific Textile in Indonesia Market Analysis, Insights and Forecast, 2020-2032
- 11.1. Market Analysis, Insights and Forecast - by Application
- 11.1.1. Clothing
- 11.1.2. Industrial/Technical
- 11.1.3. Household
- 11.1.4. Other Applications
- 11.2. Market Analysis, Insights and Forecast - by Material
- 11.2.1. Cotton
- 11.2.2. Jute
- 11.2.3. Silk
- 11.2.4. Synthetics
- 11.2.5. Wool
- 11.2.6. Other Materials
- 11.3. Market Analysis, Insights and Forecast - by Process
- 11.3.1. Woven
- 11.3.2. Non-woven
- 11.1. Market Analysis, Insights and Forecast - by Application
- 12. Competitive Analysis
- 12.1. Company Profiles
- 12.1.1 PT Ever Shine Tex Tbk
- 12.1.1.1. Company Overview
- 12.1.1.2. Products
- 12.1.1.3. Company Financials
- 12.1.1.4. SWOT Analysis
- 12.1.2 PT Trisula Textile Industries Tbk
- 12.1.2.1. Company Overview
- 12.1.2.2. Products
- 12.1.2.3. Company Financials
- 12.1.2.4. SWOT Analysis
- 12.1.3 PT Century Textile Industry Tbk (Toray Industries Inc )
- 12.1.3.1. Company Overview
- 12.1.3.2. Products
- 12.1.3.3. Company Financials
- 12.1.3.4. SWOT Analysis
- 12.1.4 PT Pan Brothers Tbk
- 12.1.4.1. Company Overview
- 12.1.4.2. Products
- 12.1.4.3. Company Financials
- 12.1.4.4. SWOT Analysis
- 12.1.5 PT Polychem Indonesia Tbk
- 12.1.5.1. Company Overview
- 12.1.5.2. Products
- 12.1.5.3. Company Financials
- 12.1.5.4. SWOT Analysis
- 12.1.6 PT Sri Rejeki Isman Tbk
- 12.1.6.1. Company Overview
- 12.1.6.2. Products
- 12.1.6.3. Company Financials
- 12.1.6.4. SWOT Analysis
- 12.1.7 PT Indo Kordsa Tbk
- 12.1.7.1. Company Overview
- 12.1.7.2. Products
- 12.1.7.3. Company Financials
- 12.1.7.4. SWOT Analysis
- 12.1.8 PT Tifico Fiber Indonesia Tbk
- 12.1.8.1. Company Overview
- 12.1.8.2. Products
- 12.1.8.3. Company Financials
- 12.1.8.4. SWOT Analysis
- 12.1.9 PT Panasia Group
- 12.1.9.1. Company Overview
- 12.1.9.2. Products
- 12.1.9.3. Company Financials
- 12.1.9.4. SWOT Analysis
- 12.1.10 PT Asia Pacific Fibers Tbk
- 12.1.10.1. Company Overview
- 12.1.10.2. Products
- 12.1.10.3. Company Financials
- 12.1.10.4. SWOT Analysis
- 12.1.11 PT Tyfountex Indonesia
- 12.1.11.1. Company Overview
- 12.1.11.2. Products
- 12.1.11.3. Company Financials
- 12.1.11.4. SWOT Analysis
- 12.1.12 PT Eratex Djaja Tbk
- 12.1.12.1. Company Overview
- 12.1.12.2. Products
- 12.1.12.3. Company Financials
- 12.1.12.4. SWOT Analysis
- 12.1.13 PT Argo Pantes Tbk
- 12.1.13.1. Company Overview
- 12.1.13.2. Products
- 12.1.13.3. Company Financials
- 12.1.13.4. SWOT Analysis
- 12.1.14 Indorama Corporation (PT Indo-Rama Synthetics Tbk)**List Not Exhaustive 6 3 Other Companie
- 12.1.14.1. Company Overview
- 12.1.14.2. Products
- 12.1.14.3. Company Financials
- 12.1.14.4. SWOT Analysis
- 12.1.1 PT Ever Shine Tex Tbk
- 12.2. Market Entropy
- 12.2.1 Company's Key Areas Served
- 12.2.2 Recent Developments
- 12.3. Company Market Share Analysis 2025
- 12.3.1 Top 5 Companies Market Share Analysis
- 12.3.2 Top 3 Companies Market Share Analysis
- 12.4. List of Potential Customers
- 13. Research Methodology
List of Figures
- Figure 1: Global Textile in Indonesia Market Revenue Breakdown (Million, %) by Region 2025 & 2033
- Figure 2: Global Textile in Indonesia Market Volume Breakdown (Billion, %) by Region 2025 & 2033
- Figure 3: North America Textile in Indonesia Market Revenue (Million), by Application 2025 & 2033
- Figure 4: North America Textile in Indonesia Market Volume (Billion), by Application 2025 & 2033
- Figure 5: North America Textile in Indonesia Market Revenue Share (%), by Application 2025 & 2033
- Figure 6: North America Textile in Indonesia Market Volume Share (%), by Application 2025 & 2033
- Figure 7: North America Textile in Indonesia Market Revenue (Million), by Material 2025 & 2033
- Figure 8: North America Textile in Indonesia Market Volume (Billion), by Material 2025 & 2033
- Figure 9: North America Textile in Indonesia Market Revenue Share (%), by Material 2025 & 2033
- Figure 10: North America Textile in Indonesia Market Volume Share (%), by Material 2025 & 2033
- Figure 11: North America Textile in Indonesia Market Revenue (Million), by Process 2025 & 2033
- Figure 12: North America Textile in Indonesia Market Volume (Billion), by Process 2025 & 2033
- Figure 13: North America Textile in Indonesia Market Revenue Share (%), by Process 2025 & 2033
- Figure 14: North America Textile in Indonesia Market Volume Share (%), by Process 2025 & 2033
- Figure 15: North America Textile in Indonesia Market Revenue (Million), by Country 2025 & 2033
- Figure 16: North America Textile in Indonesia Market Volume (Billion), by Country 2025 & 2033
- Figure 17: North America Textile in Indonesia Market Revenue Share (%), by Country 2025 & 2033
- Figure 18: North America Textile in Indonesia Market Volume Share (%), by Country 2025 & 2033
- Figure 19: South America Textile in Indonesia Market Revenue (Million), by Application 2025 & 2033
- Figure 20: South America Textile in Indonesia Market Volume (Billion), by Application 2025 & 2033
- Figure 21: South America Textile in Indonesia Market Revenue Share (%), by Application 2025 & 2033
- Figure 22: South America Textile in Indonesia Market Volume Share (%), by Application 2025 & 2033
- Figure 23: South America Textile in Indonesia Market Revenue (Million), by Material 2025 & 2033
- Figure 24: South America Textile in Indonesia Market Volume (Billion), by Material 2025 & 2033
- Figure 25: South America Textile in Indonesia Market Revenue Share (%), by Material 2025 & 2033
- Figure 26: South America Textile in Indonesia Market Volume Share (%), by Material 2025 & 2033
- Figure 27: South America Textile in Indonesia Market Revenue (Million), by Process 2025 & 2033
- Figure 28: South America Textile in Indonesia Market Volume (Billion), by Process 2025 & 2033
- Figure 29: South America Textile in Indonesia Market Revenue Share (%), by Process 2025 & 2033
- Figure 30: South America Textile in Indonesia Market Volume Share (%), by Process 2025 & 2033
- Figure 31: South America Textile in Indonesia Market Revenue (Million), by Country 2025 & 2033
- Figure 32: South America Textile in Indonesia Market Volume (Billion), by Country 2025 & 2033
- Figure 33: South America Textile in Indonesia Market Revenue Share (%), by Country 2025 & 2033
- Figure 34: South America Textile in Indonesia Market Volume Share (%), by Country 2025 & 2033
- Figure 35: Europe Textile in Indonesia Market Revenue (Million), by Application 2025 & 2033
- Figure 36: Europe Textile in Indonesia Market Volume (Billion), by Application 2025 & 2033
- Figure 37: Europe Textile in Indonesia Market Revenue Share (%), by Application 2025 & 2033
- Figure 38: Europe Textile in Indonesia Market Volume Share (%), by Application 2025 & 2033
- Figure 39: Europe Textile in Indonesia Market Revenue (Million), by Material 2025 & 2033
- Figure 40: Europe Textile in Indonesia Market Volume (Billion), by Material 2025 & 2033
- Figure 41: Europe Textile in Indonesia Market Revenue Share (%), by Material 2025 & 2033
- Figure 42: Europe Textile in Indonesia Market Volume Share (%), by Material 2025 & 2033
- Figure 43: Europe Textile in Indonesia Market Revenue (Million), by Process 2025 & 2033
- Figure 44: Europe Textile in Indonesia Market Volume (Billion), by Process 2025 & 2033
- Figure 45: Europe Textile in Indonesia Market Revenue Share (%), by Process 2025 & 2033
- Figure 46: Europe Textile in Indonesia Market Volume Share (%), by Process 2025 & 2033
- Figure 47: Europe Textile in Indonesia Market Revenue (Million), by Country 2025 & 2033
- Figure 48: Europe Textile in Indonesia Market Volume (Billion), by Country 2025 & 2033
- Figure 49: Europe Textile in Indonesia Market Revenue Share (%), by Country 2025 & 2033
- Figure 50: Europe Textile in Indonesia Market Volume Share (%), by Country 2025 & 2033
- Figure 51: Middle East & Africa Textile in Indonesia Market Revenue (Million), by Application 2025 & 2033
- Figure 52: Middle East & Africa Textile in Indonesia Market Volume (Billion), by Application 2025 & 2033
- Figure 53: Middle East & Africa Textile in Indonesia Market Revenue Share (%), by Application 2025 & 2033
- Figure 54: Middle East & Africa Textile in Indonesia Market Volume Share (%), by Application 2025 & 2033
- Figure 55: Middle East & Africa Textile in Indonesia Market Revenue (Million), by Material 2025 & 2033
- Figure 56: Middle East & Africa Textile in Indonesia Market Volume (Billion), by Material 2025 & 2033
- Figure 57: Middle East & Africa Textile in Indonesia Market Revenue Share (%), by Material 2025 & 2033
- Figure 58: Middle East & Africa Textile in Indonesia Market Volume Share (%), by Material 2025 & 2033
- Figure 59: Middle East & Africa Textile in Indonesia Market Revenue (Million), by Process 2025 & 2033
- Figure 60: Middle East & Africa Textile in Indonesia Market Volume (Billion), by Process 2025 & 2033
- Figure 61: Middle East & Africa Textile in Indonesia Market Revenue Share (%), by Process 2025 & 2033
- Figure 62: Middle East & Africa Textile in Indonesia Market Volume Share (%), by Process 2025 & 2033
- Figure 63: Middle East & Africa Textile in Indonesia Market Revenue (Million), by Country 2025 & 2033
- Figure 64: Middle East & Africa Textile in Indonesia Market Volume (Billion), by Country 2025 & 2033
- Figure 65: Middle East & Africa Textile in Indonesia Market Revenue Share (%), by Country 2025 & 2033
- Figure 66: Middle East & Africa Textile in Indonesia Market Volume Share (%), by Country 2025 & 2033
- Figure 67: Asia Pacific Textile in Indonesia Market Revenue (Million), by Application 2025 & 2033
- Figure 68: Asia Pacific Textile in Indonesia Market Volume (Billion), by Application 2025 & 2033
- Figure 69: Asia Pacific Textile in Indonesia Market Revenue Share (%), by Application 2025 & 2033
- Figure 70: Asia Pacific Textile in Indonesia Market Volume Share (%), by Application 2025 & 2033
- Figure 71: Asia Pacific Textile in Indonesia Market Revenue (Million), by Material 2025 & 2033
- Figure 72: Asia Pacific Textile in Indonesia Market Volume (Billion), by Material 2025 & 2033
- Figure 73: Asia Pacific Textile in Indonesia Market Revenue Share (%), by Material 2025 & 2033
- Figure 74: Asia Pacific Textile in Indonesia Market Volume Share (%), by Material 2025 & 2033
- Figure 75: Asia Pacific Textile in Indonesia Market Revenue (Million), by Process 2025 & 2033
- Figure 76: Asia Pacific Textile in Indonesia Market Volume (Billion), by Process 2025 & 2033
- Figure 77: Asia Pacific Textile in Indonesia Market Revenue Share (%), by Process 2025 & 2033
- Figure 78: Asia Pacific Textile in Indonesia Market Volume Share (%), by Process 2025 & 2033
- Figure 79: Asia Pacific Textile in Indonesia Market Revenue (Million), by Country 2025 & 2033
- Figure 80: Asia Pacific Textile in Indonesia Market Volume (Billion), by Country 2025 & 2033
- Figure 81: Asia Pacific Textile in Indonesia Market Revenue Share (%), by Country 2025 & 2033
- Figure 82: Asia Pacific Textile in Indonesia Market Volume Share (%), by Country 2025 & 2033
List of Tables
- Table 1: Global Textile in Indonesia Market Revenue Million Forecast, by Application 2020 & 2033
- Table 2: Global Textile in Indonesia Market Volume Billion Forecast, by Application 2020 & 2033
- Table 3: Global Textile in Indonesia Market Revenue Million Forecast, by Material 2020 & 2033
- Table 4: Global Textile in Indonesia Market Volume Billion Forecast, by Material 2020 & 2033
- Table 5: Global Textile in Indonesia Market Revenue Million Forecast, by Process 2020 & 2033
- Table 6: Global Textile in Indonesia Market Volume Billion Forecast, by Process 2020 & 2033
- Table 7: Global Textile in Indonesia Market Revenue Million Forecast, by Region 2020 & 2033
- Table 8: Global Textile in Indonesia Market Volume Billion Forecast, by Region 2020 & 2033
- Table 9: Global Textile in Indonesia Market Revenue Million Forecast, by Application 2020 & 2033
- Table 10: Global Textile in Indonesia Market Volume Billion Forecast, by Application 2020 & 2033
- Table 11: Global Textile in Indonesia Market Revenue Million Forecast, by Material 2020 & 2033
- Table 12: Global Textile in Indonesia Market Volume Billion Forecast, by Material 2020 & 2033
- Table 13: Global Textile in Indonesia Market Revenue Million Forecast, by Process 2020 & 2033
- Table 14: Global Textile in Indonesia Market Volume Billion Forecast, by Process 2020 & 2033
- Table 15: Global Textile in Indonesia Market Revenue Million Forecast, by Country 2020 & 2033
- Table 16: Global Textile in Indonesia Market Volume Billion Forecast, by Country 2020 & 2033
- Table 17: United States Textile in Indonesia Market Revenue (Million) Forecast, by Application 2020 & 2033
- Table 18: United States Textile in Indonesia Market Volume (Billion) Forecast, by Application 2020 & 2033
- Table 19: Canada Textile in Indonesia Market Revenue (Million) Forecast, by Application 2020 & 2033
- Table 20: Canada Textile in Indonesia Market Volume (Billion) Forecast, by Application 2020 & 2033
- Table 21: Mexico Textile in Indonesia Market Revenue (Million) Forecast, by Application 2020 & 2033
- Table 22: Mexico Textile in Indonesia Market Volume (Billion) Forecast, by Application 2020 & 2033
- Table 23: Global Textile in Indonesia Market Revenue Million Forecast, by Application 2020 & 2033
- Table 24: Global Textile in Indonesia Market Volume Billion Forecast, by Application 2020 & 2033
- Table 25: Global Textile in Indonesia Market Revenue Million Forecast, by Material 2020 & 2033
- Table 26: Global Textile in Indonesia Market Volume Billion Forecast, by Material 2020 & 2033
- Table 27: Global Textile in Indonesia Market Revenue Million Forecast, by Process 2020 & 2033
- Table 28: Global Textile in Indonesia Market Volume Billion Forecast, by Process 2020 & 2033
- Table 29: Global Textile in Indonesia Market Revenue Million Forecast, by Country 2020 & 2033
- Table 30: Global Textile in Indonesia Market Volume Billion Forecast, by Country 2020 & 2033
- Table 31: Brazil Textile in Indonesia Market Revenue (Million) Forecast, by Application 2020 & 2033
- Table 32: Brazil Textile in Indonesia Market Volume (Billion) Forecast, by Application 2020 & 2033
- Table 33: Argentina Textile in Indonesia Market Revenue (Million) Forecast, by Application 2020 & 2033
- Table 34: Argentina Textile in Indonesia Market Volume (Billion) Forecast, by Application 2020 & 2033
- Table 35: Rest of South America Textile in Indonesia Market Revenue (Million) Forecast, by Application 2020 & 2033
- Table 36: Rest of South America Textile in Indonesia Market Volume (Billion) Forecast, by Application 2020 & 2033
- Table 37: Global Textile in Indonesia Market Revenue Million Forecast, by Application 2020 & 2033
- Table 38: Global Textile in Indonesia Market Volume Billion Forecast, by Application 2020 & 2033
- Table 39: Global Textile in Indonesia Market Revenue Million Forecast, by Material 2020 & 2033
- Table 40: Global Textile in Indonesia Market Volume Billion Forecast, by Material 2020 & 2033
- Table 41: Global Textile in Indonesia Market Revenue Million Forecast, by Process 2020 & 2033
- Table 42: Global Textile in Indonesia Market Volume Billion Forecast, by Process 2020 & 2033
- Table 43: Global Textile in Indonesia Market Revenue Million Forecast, by Country 2020 & 2033
- Table 44: Global Textile in Indonesia Market Volume Billion Forecast, by Country 2020 & 2033
- Table 45: United Kingdom Textile in Indonesia Market Revenue (Million) Forecast, by Application 2020 & 2033
- Table 46: United Kingdom Textile in Indonesia Market Volume (Billion) Forecast, by Application 2020 & 2033
- Table 47: Germany Textile in Indonesia Market Revenue (Million) Forecast, by Application 2020 & 2033
- Table 48: Germany Textile in Indonesia Market Volume (Billion) Forecast, by Application 2020 & 2033
- Table 49: France Textile in Indonesia Market Revenue (Million) Forecast, by Application 2020 & 2033
- Table 50: France Textile in Indonesia Market Volume (Billion) Forecast, by Application 2020 & 2033
- Table 51: Italy Textile in Indonesia Market Revenue (Million) Forecast, by Application 2020 & 2033
- Table 52: Italy Textile in Indonesia Market Volume (Billion) Forecast, by Application 2020 & 2033
- Table 53: Spain Textile in Indonesia Market Revenue (Million) Forecast, by Application 2020 & 2033
- Table 54: Spain Textile in Indonesia Market Volume (Billion) Forecast, by Application 2020 & 2033
- Table 55: Russia Textile in Indonesia Market Revenue (Million) Forecast, by Application 2020 & 2033
- Table 56: Russia Textile in Indonesia Market Volume (Billion) Forecast, by Application 2020 & 2033
- Table 57: Benelux Textile in Indonesia Market Revenue (Million) Forecast, by Application 2020 & 2033
- Table 58: Benelux Textile in Indonesia Market Volume (Billion) Forecast, by Application 2020 & 2033
- Table 59: Nordics Textile in Indonesia Market Revenue (Million) Forecast, by Application 2020 & 2033
- Table 60: Nordics Textile in Indonesia Market Volume (Billion) Forecast, by Application 2020 & 2033
- Table 61: Rest of Europe Textile in Indonesia Market Revenue (Million) Forecast, by Application 2020 & 2033
- Table 62: Rest of Europe Textile in Indonesia Market Volume (Billion) Forecast, by Application 2020 & 2033
- Table 63: Global Textile in Indonesia Market Revenue Million Forecast, by Application 2020 & 2033
- Table 64: Global Textile in Indonesia Market Volume Billion Forecast, by Application 2020 & 2033
- Table 65: Global Textile in Indonesia Market Revenue Million Forecast, by Material 2020 & 2033
- Table 66: Global Textile in Indonesia Market Volume Billion Forecast, by Material 2020 & 2033
- Table 67: Global Textile in Indonesia Market Revenue Million Forecast, by Process 2020 & 2033
- Table 68: Global Textile in Indonesia Market Volume Billion Forecast, by Process 2020 & 2033
- Table 69: Global Textile in Indonesia Market Revenue Million Forecast, by Country 2020 & 2033
- Table 70: Global Textile in Indonesia Market Volume Billion Forecast, by Country 2020 & 2033
- Table 71: Turkey Textile in Indonesia Market Revenue (Million) Forecast, by Application 2020 & 2033
- Table 72: Turkey Textile in Indonesia Market Volume (Billion) Forecast, by Application 2020 & 2033
- Table 73: Israel Textile in Indonesia Market Revenue (Million) Forecast, by Application 2020 & 2033
- Table 74: Israel Textile in Indonesia Market Volume (Billion) Forecast, by Application 2020 & 2033
- Table 75: GCC Textile in Indonesia Market Revenue (Million) Forecast, by Application 2020 & 2033
- Table 76: GCC Textile in Indonesia Market Volume (Billion) Forecast, by Application 2020 & 2033
- Table 77: North Africa Textile in Indonesia Market Revenue (Million) Forecast, by Application 2020 & 2033
- Table 78: North Africa Textile in Indonesia Market Volume (Billion) Forecast, by Application 2020 & 2033
- Table 79: South Africa Textile in Indonesia Market Revenue (Million) Forecast, by Application 2020 & 2033
- Table 80: South Africa Textile in Indonesia Market Volume (Billion) Forecast, by Application 2020 & 2033
- Table 81: Rest of Middle East & Africa Textile in Indonesia Market Revenue (Million) Forecast, by Application 2020 & 2033
- Table 82: Rest of Middle East & Africa Textile in Indonesia Market Volume (Billion) Forecast, by Application 2020 & 2033
- Table 83: Global Textile in Indonesia Market Revenue Million Forecast, by Application 2020 & 2033
- Table 84: Global Textile in Indonesia Market Volume Billion Forecast, by Application 2020 & 2033
- Table 85: Global Textile in Indonesia Market Revenue Million Forecast, by Material 2020 & 2033
- Table 86: Global Textile in Indonesia Market Volume Billion Forecast, by Material 2020 & 2033
- Table 87: Global Textile in Indonesia Market Revenue Million Forecast, by Process 2020 & 2033
- Table 88: Global Textile in Indonesia Market Volume Billion Forecast, by Process 2020 & 2033
- Table 89: Global Textile in Indonesia Market Revenue Million Forecast, by Country 2020 & 2033
- Table 90: Global Textile in Indonesia Market Volume Billion Forecast, by Country 2020 & 2033
- Table 91: China Textile in Indonesia Market Revenue (Million) Forecast, by Application 2020 & 2033
- Table 92: China Textile in Indonesia Market Volume (Billion) Forecast, by Application 2020 & 2033
- Table 93: India Textile in Indonesia Market Revenue (Million) Forecast, by Application 2020 & 2033
- Table 94: India Textile in Indonesia Market Volume (Billion) Forecast, by Application 2020 & 2033
- Table 95: Japan Textile in Indonesia Market Revenue (Million) Forecast, by Application 2020 & 2033
- Table 96: Japan Textile in Indonesia Market Volume (Billion) Forecast, by Application 2020 & 2033
- Table 97: South Korea Textile in Indonesia Market Revenue (Million) Forecast, by Application 2020 & 2033
- Table 98: South Korea Textile in Indonesia Market Volume (Billion) Forecast, by Application 2020 & 2033
- Table 99: ASEAN Textile in Indonesia Market Revenue (Million) Forecast, by Application 2020 & 2033
- Table 100: ASEAN Textile in Indonesia Market Volume (Billion) Forecast, by Application 2020 & 2033
- Table 101: Oceania Textile in Indonesia Market Revenue (Million) Forecast, by Application 2020 & 2033
- Table 102: Oceania Textile in Indonesia Market Volume (Billion) Forecast, by Application 2020 & 2033
- Table 103: Rest of Asia Pacific Textile in Indonesia Market Revenue (Million) Forecast, by Application 2020 & 2033
- Table 104: Rest of Asia Pacific Textile in Indonesia Market Volume (Billion) Forecast, by Application 2020 & 2033
Frequently Asked Questions
1. What is the projected Compound Annual Growth Rate (CAGR) of the Textile in Indonesia Market?
The projected CAGR is approximately > 5.54%.
2. Which companies are prominent players in the Textile in Indonesia Market?
Key companies in the market include PT Ever Shine Tex Tbk, PT Trisula Textile Industries Tbk, PT Century Textile Industry Tbk (Toray Industries Inc ), PT Pan Brothers Tbk, PT Polychem Indonesia Tbk, PT Sri Rejeki Isman Tbk, PT Indo Kordsa Tbk, PT Tifico Fiber Indonesia Tbk, PT Panasia Group, PT Asia Pacific Fibers Tbk, PT Tyfountex Indonesia, PT Eratex Djaja Tbk, PT Argo Pantes Tbk, Indorama Corporation (PT Indo-Rama Synthetics Tbk)**List Not Exhaustive 6 3 Other Companie.
3. What are the main segments of the Textile in Indonesia Market?
The market segments include Application, Material, Process.
4. Can you provide details about the market size?
The market size is estimated to be USD 13.83 Million as of 2022.
5. What are some drivers contributing to market growth?
4.; Growing domestic market4.; Government support driving the market.
6. What are the notable trends driving market growth?
Indonesian Cotton Imports Set to Rise in 2024.
7. Are there any restraints impacting market growth?
4.; Growing domestic market4.; Government support driving the market.
8. Can you provide examples of recent developments in the market?
November 2023: WHP Global, a leading brand management firm, has inked significant licensing agreements to expand the reach of the iconic EXPRESS brand. The deals include partnerships with PT MAP in Indonesia, Kemsa in Paraguay, and a strategic collaboration with IB Group in Mexico, further solidifying the brand's foothold in these markets.
9. What pricing options are available for accessing the report?
Pricing options include single-user, multi-user, and enterprise licenses priced at USD 3800, USD 4500, and USD 5800 respectively.
10. Is the market size provided in terms of value or volume?
The market size is provided in terms of value, measured in Million and volume, measured in Billion.
11. Are there any specific market keywords associated with the report?
Yes, the market keyword associated with the report is "Textile in Indonesia Market," which aids in identifying and referencing the specific market segment covered.
12. How do I determine which pricing option suits my needs best?
The pricing options vary based on user requirements and access needs. Individual users may opt for single-user licenses, while businesses requiring broader access may choose multi-user or enterprise licenses for cost-effective access to the report.
13. Are there any additional resources or data provided in the Textile in Indonesia Market report?
While the report offers comprehensive insights, it's advisable to review the specific contents or supplementary materials provided to ascertain if additional resources or data are available.
14. How can I stay updated on further developments or reports in the Textile in Indonesia Market?
To stay informed about further developments, trends, and reports in the Textile in Indonesia Market, consider subscribing to industry newsletters, following relevant companies and organizations, or regularly checking reputable industry news sources and publications.
Methodology
Step 1 - Identification of Relevant Samples Size from Population Database


Step 2 - Approaches for Defining Global Market Size (Value, Volume* & Price*)

Note*: In applicable scenarios
Step 3 - Data Sources
Primary Research
- Web Analytics
- Survey Reports
- Research Institute
- Latest Research Reports
- Opinion Leaders
Secondary Research
- Annual Reports
- White Paper
- Latest Press Release
- Industry Association
- Paid Database
- Investor Presentations

Step 4 - Data Triangulation
Involves using different sources of information in order to increase the validity of a study
These sources are likely to be stakeholders in a program - participants, other researchers, program staff, other community members, and so on.
Then we put all data in single framework & apply various statistical tools to find out the dynamic on the market.
During the analysis stage, feedback from the stakeholder groups would be compared to determine areas of agreement as well as areas of divergence