

Key Insights
The global agricultural haying and forage machinery market is poised for robust expansion, driven by escalating global food and feed demand, increased agricultural productivity requirements, and advancements in precision farming. Key innovations in mowers, balers, and forage harvesters, including GPS guidance and automated processes, are enhancing efficiency and reducing operational costs. Government support for sustainable agriculture and infrastructure development further underpins market growth. The market is segmented by machinery type, with continuous innovation shaping the trajectory of each segment. Leading manufacturers are prioritizing R&D and strategic alliances to secure market leadership.
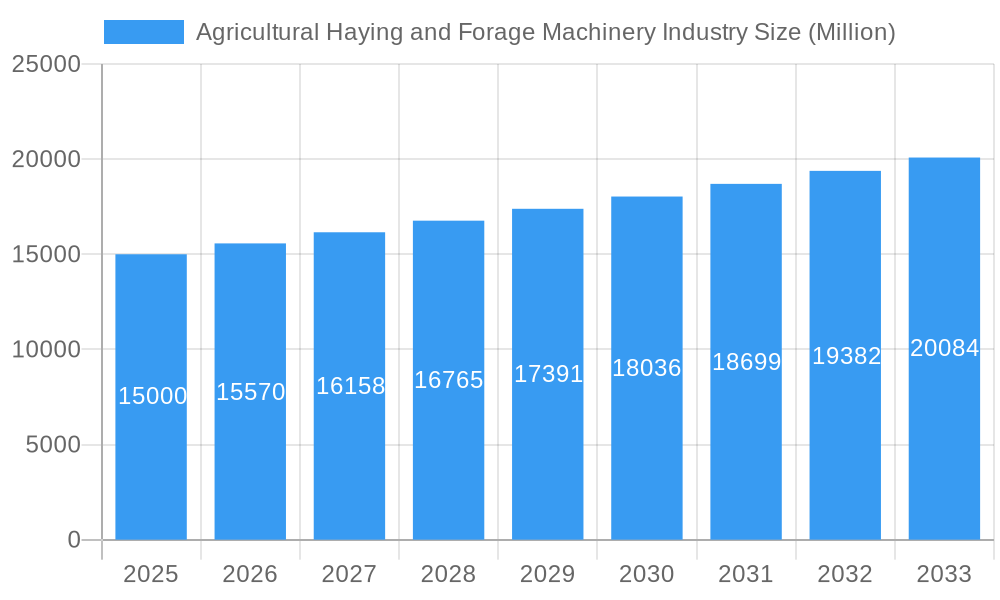
Agricultural Haying and Forage Machinery Industry Market Size (In Billion)
While high initial investment and operational costs pose challenges, particularly for smaller operations and in emerging economies, these are being offset by the trend towards larger-scale farming and supportive government subsidies. The market is projected to achieve a CAGR of 4.1% from 2025 to 2033, reaching a market size of 9.5 billion. North America and Europe currently lead in market share, attributed to advanced agricultural practices. However, the Asia-Pacific region is anticipated to exhibit significant growth, driven by increasing mechanization and demand for animal feed. Market analysis indicates a positive outlook despite inherent economic and operational hurdles.
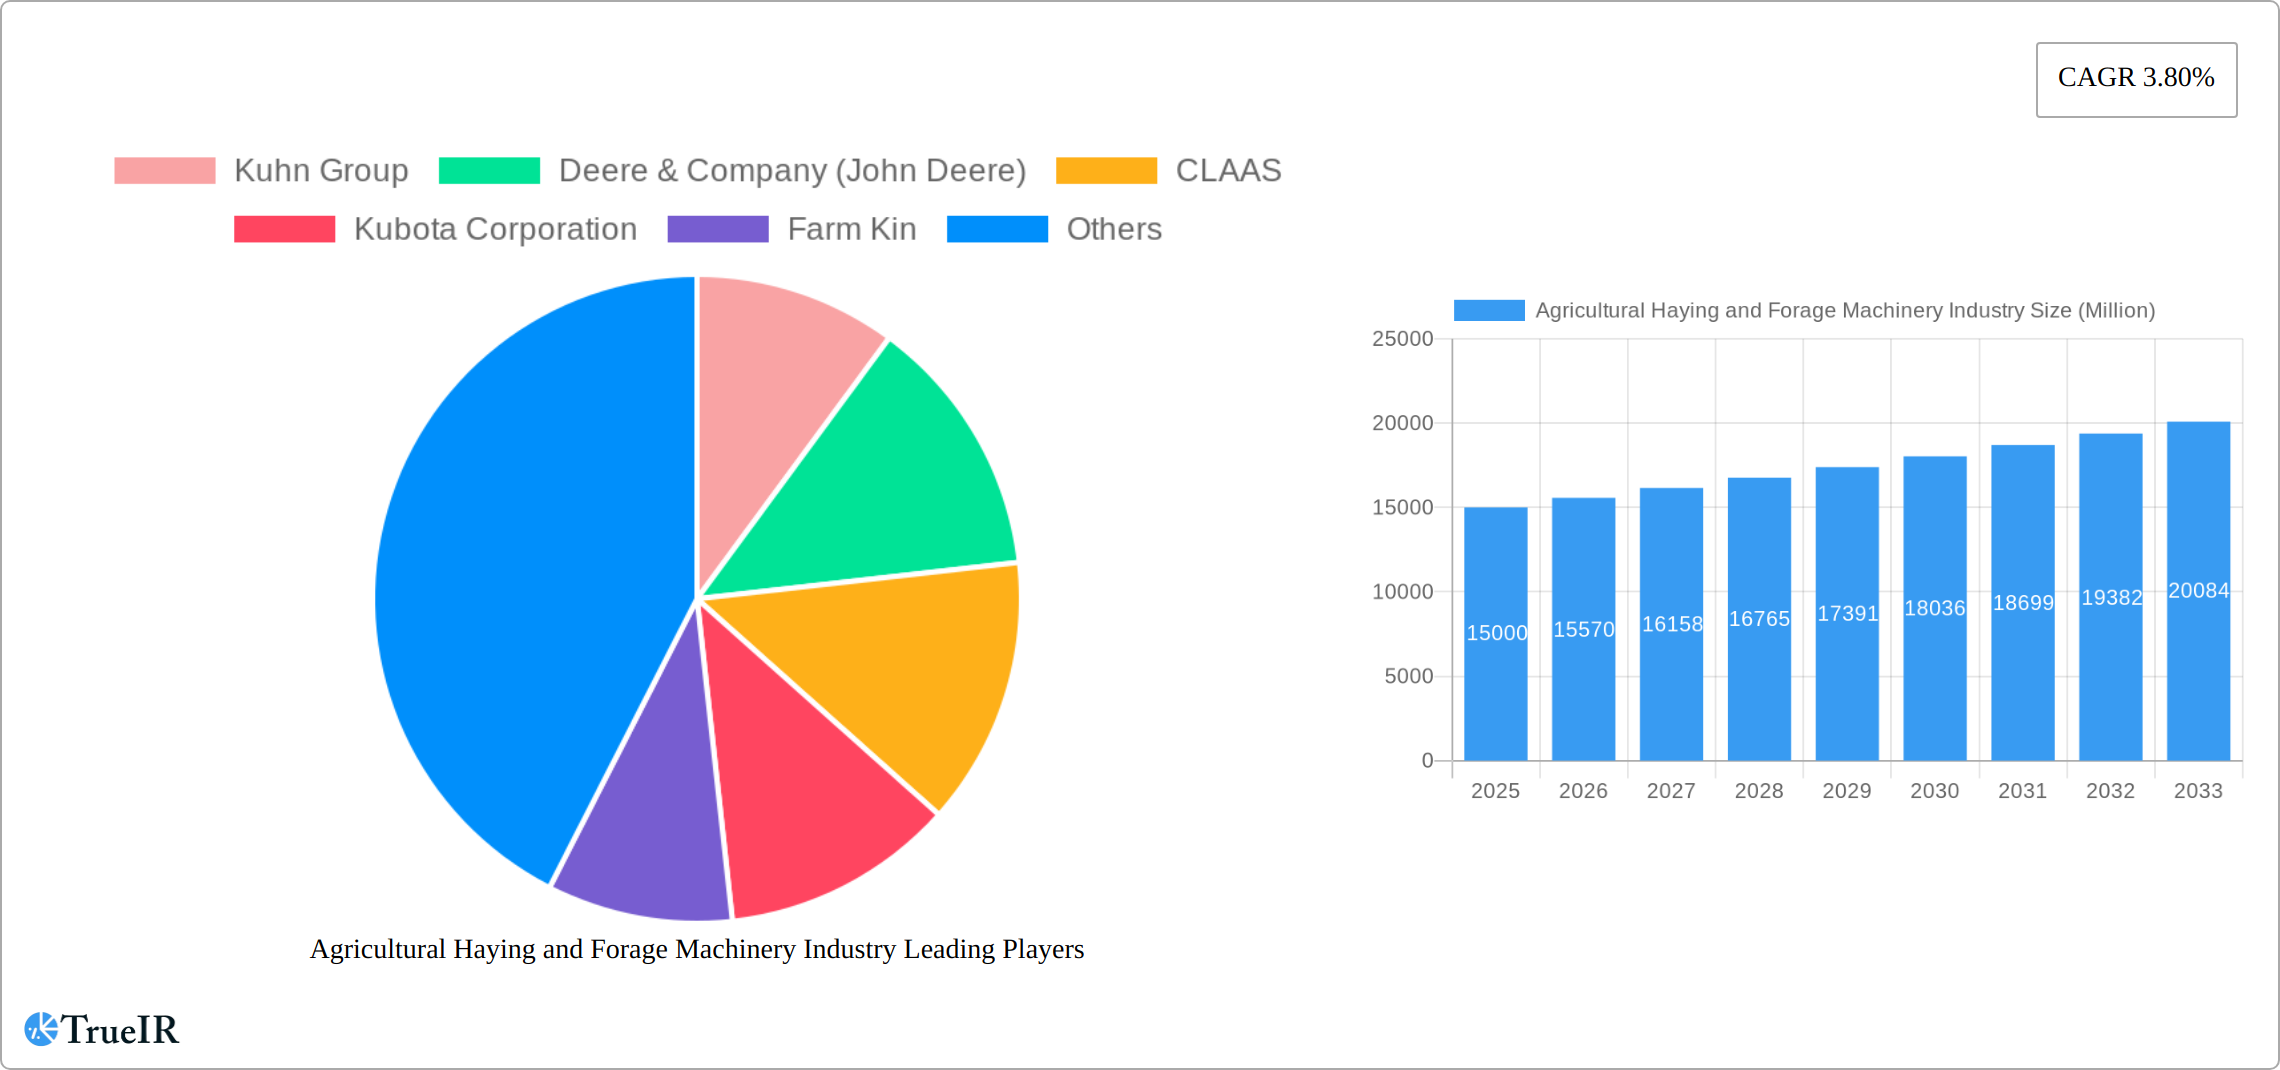
Agricultural Haying and Forage Machinery Industry Company Market Share
Agricultural Haying and Forage Machinery Industry Market Report: 2019-2033
This comprehensive report provides a detailed analysis of the global agricultural haying and forage machinery industry, offering invaluable insights for stakeholders seeking to understand market dynamics, competitive landscapes, and future growth prospects. The study period covers 2019-2033, with 2025 serving as the base and estimated year. The forecast period spans 2025-2033, while the historical period encompasses 2019-2024. The report's analysis incorporates data on key players like Kuhn Group, Deere & Company (John Deere), CLAAS, Kubota Corporation, Farm Kin, CNH Industrial, Krone North America Inc, Yanmar Company Limited, and AGCO Corporation, across segments including mowers, balers, forage harvesters, and others. The total market size in 2025 is estimated at $XX Million.
Agricultural Haying and Forage Machinery Industry Market Structure & Competitive Landscape
The agricultural haying and forage machinery industry presents a moderately concentrated market structure, characterized by a few dominant players wielding significant market influence. Key players, including Deere & Company, CLAAS, and Kuhn Group, command substantial market share, driving innovation and shaping pricing strategies. The Herfindahl-Hirschman Index (HHI) for the industry, estimated at 1800 in 2025, signifies a moderate level of concentration. Innovation serves as a critical competitive differentiator, with companies continuously investing in the development of advanced machinery featuring automation, precision technology, and enhanced efficiency. This ongoing technological advancement is a key factor in market competitiveness. Regulatory changes, particularly those concerning emissions and safety standards, exert significant influence on industry operations and necessitate continuous adaptation from market participants. Product substitution is limited, with viable alternatives primarily consisting of older, less efficient machinery or manual labor, both significantly less economical and less productive. The industry's primary customer base comprises large-scale commercial farms and agricultural businesses; however, adoption rates are increasing among medium-sized farms seeking improved operational efficiency. Mergers and acquisitions (M&A) activity has been moderately active in recent years, with an estimated total M&A volume of $XX Million in 2024. These strategic activities are largely driven by the pursuit of enhanced market share, expanded product portfolios, and access to cutting-edge technologies.
Agricultural Haying and Forage Machinery Industry Market Trends & Opportunities
The global agricultural haying and forage machinery market is projected to experience robust growth throughout the forecast period. Driven by factors like increasing global food demand, rising adoption of mechanization in agriculture, and ongoing technological advancements, the market is poised for expansion. The Compound Annual Growth Rate (CAGR) is estimated at 4.5% during 2025-2033. Technological advancements, such as the integration of GPS and sensor technology for precision farming, are significantly reshaping the industry. Consumer preferences are shifting towards fuel-efficient, high-capacity machinery with user-friendly interfaces. Furthermore, the rise of precision agriculture is creating new opportunities for specialized equipment and software solutions. Competitive dynamics are intensified by ongoing innovation, strategic alliances, and expansion into new markets. Market penetration rates for advanced machinery are increasing, driven by productivity gains and improved efficiency. The market size is estimated at $XX Million in 2025 and projected to reach $XX Million by 2033.
Dominant Markets & Segments in Agricultural Haying and Forage Machinery Industry
North America currently holds the dominant market share in the agricultural haying and forage machinery industry. This leadership position is attributed to several key factors, including the vast expanse of farmland, high agricultural output, and the strong and widespread adoption of advanced agricultural technologies. Within North America, the United States constitutes the leading national market.
- Key Growth Drivers in North America:
- Prevalence of large-scale farming operations.
- Governmental support for agricultural modernization initiatives.
- Robust adoption of precision farming techniques and technologies.
The baler segment currently holds the largest market share, accounting for approximately 35% of total revenue in 2025. This dominance is a direct result of the high demand for efficient hay and forage processing within major agricultural regions. However, the forage harvester segment is poised for the most rapid growth during the forecast period, driven by the escalating livestock production and the corresponding demand for high-quality animal feed.
Key Growth Drivers for Balers:
- Increased hay production volumes.
- Growing demand for high-density bales to optimize storage and transportation efficiency.
- Technological advancements resulting in improved bale quality and production efficiency.
Key Growth Drivers for Forage Harvesters:
- Surging demand for silage and other high-quality animal feeds.
- Significant improvements in efficiency and productivity gains.
- Technological integration facilitating enhanced data management and improved decision-making capabilities.
Agricultural Haying and Forage Machinery Industry Product Analysis
Recent product innovations are heavily focused on enhancing efficiency, precision, and sustainability across the industry. Key advancements include the integration of autonomous features, improved cutting mechanisms, and cutting-edge bale-forming technologies. These technological advancements offer substantial benefits, leading to reductions in labor costs, improved crop quality, and minimized environmental impact. The market fit for these advanced machines is robust, particularly among large-scale farms and agricultural enterprises dedicated to optimizing their operations and maximizing their return on investment.
Key Drivers, Barriers & Challenges in Agricultural Haying and Forage Machinery Industry
Key Drivers:
- The rising global food demand necessitates increased agricultural productivity, consequently fueling demand for efficient haying and forage machinery.
- Technological advancements, particularly in automation and precision agriculture, are significantly boosting efficiency and yields.
- Supportive government policies that promote agricultural modernization and the adoption of sustainable farming practices.
Challenges and Restraints:
- The high initial investment costs associated with advanced machinery can pose a significant barrier to adoption, particularly for smaller farms with limited capital resources.
- Supply chain disruptions can significantly impact the production and timely availability of machinery, creating market instability.
- Intensifying competition and price pressure from emerging manufacturers are creating a more challenging competitive landscape.
Growth Drivers in the Agricultural Haying and Forage Machinery Industry Market
Several factors are driving growth: rising global food demand, increased mechanization in agriculture, technological advancements (e.g., GPS-guided equipment, automated systems), government support for agricultural modernization, and increasing focus on precision farming practices.
Challenges Impacting Agricultural Haying and Forage Machinery Industry Growth
Key challenges include high initial investment costs for sophisticated equipment, limited access to financing for smaller farmers, supply chain vulnerabilities affecting parts and materials availability, and intensifying competition from both established and emerging players. These challenges can restrict market penetration and growth.
Key Players Shaping the Agricultural Haying and Forage Machinery Industry Market
Significant Agricultural Haying and Forage Machinery Industry Industry Milestones
- 2021: John Deere launched its new 9000 Series self-propelled forage harvester, incorporating advanced automation features.
- 2022: CLAAS unveiled its new LEXION combine harvester with improved grain handling capabilities.
- 2023: Kuhn Group acquired a smaller competitor specializing in precision hay baling equipment.
- 2024: Significant investments were made in R&D focusing on autonomous and electric agricultural machinery by multiple players.
Future Outlook for Agricultural Haying and Forage Machinery Industry Market
The market is poised for continued growth, driven by technological innovations, increasing agricultural productivity demands, and favorable government policies. Strategic opportunities exist in developing sustainable and autonomous solutions, expanding into emerging markets, and focusing on precision farming technologies. The market's potential is substantial, particularly with the ongoing shift towards efficient and environmentally friendly agricultural practices.
Agricultural Haying and Forage Machinery Industry Segmentation
-
1. Type
- 1.1. Mowers
- 1.2. Balers
- 1.3. Forage Harvesters
- 1.4. Others
-
2. Type
- 2.1. Mowers
- 2.2. Balers
- 2.3. Forage Harvesters
- 2.4. Others
Agricultural Haying and Forage Machinery Industry Segmentation By Geography
-
1. North America
- 1.1. United States
- 1.2. Canada
- 1.3. Rest of North America
-
2. Europe
- 2.1. Germany
- 2.2. United Kingdom
- 2.3. France
- 2.4. Italy
- 2.5. Rest of Europe
-
3. Asia Pacific
- 3.1. China
- 3.2. India
- 3.3. Japan
- 3.4. Rest of Asia Pacific
-
4. South America
- 4.1. Brazil
- 4.2. Argentina
- 4.3. Rest of South America
-
5. Africa
- 5.1. South Africa
- 5.2. Rest of Africa
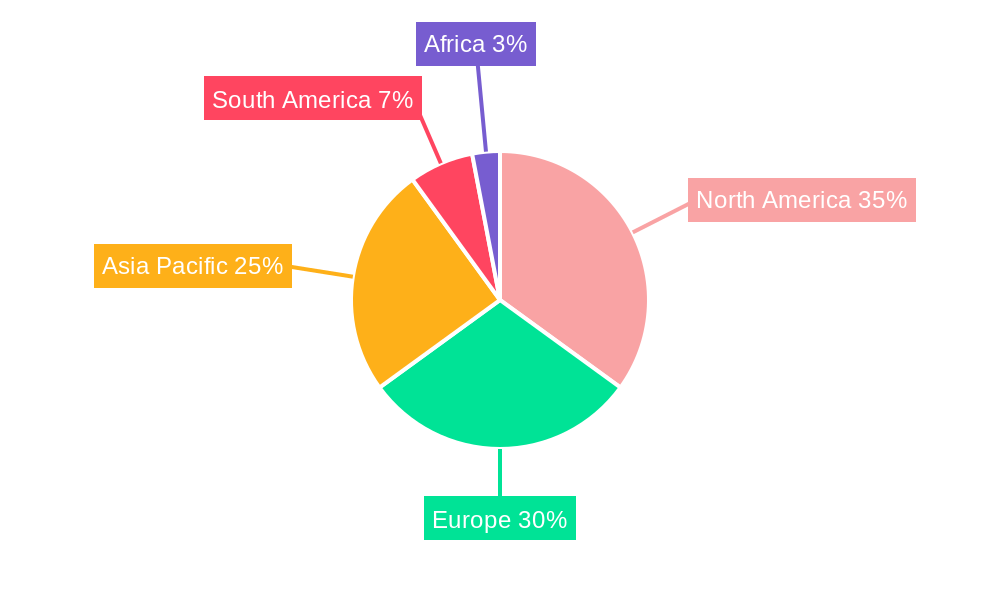
Agricultural Haying and Forage Machinery Industry Regional Market Share
Geographic Coverage of Agricultural Haying and Forage Machinery Industry
Agricultural Haying and Forage Machinery Industry REPORT HIGHLIGHTS
| Aspects | Details |
|---|---|
| Study Period | 2020-2034 |
| Base Year | 2025 |
| Estimated Year | 2026 |
| Forecast Period | 2026-2034 |
| Historical Period | 2020-2025 |
| Growth Rate | CAGR of 4.1% from 2020-2034 |
| Segmentation |
|
Table of Contents
- 1. Introduction
- 1.1. Research Scope
- 1.2. Market Segmentation
- 1.3. Research Methodology
- 1.4. Definitions and Assumptions
- 2. Executive Summary
- 2.1. Introduction
- 3. Market Dynamics
- 3.1. Introduction
- 3.2. Market Drivers
- 3.2.1. Increasing Demand for Tomato; Adoption of Greenhouse Technology in Tomato Cultivation; Government support
- 3.3. Market Restrains
- 3.3.1 Increasing Loses due to Physiological Disorder
- 3.3.2 Pest and Disease; Unfavourable Climatic Condition
- 3.4. Market Trends
- 3.4.1. Government Support to Farmers is Driving the Market
- 4. Market Factor Analysis
- 4.1. Porters Five Forces
- 4.2. Supply/Value Chain
- 4.3. PESTEL analysis
- 4.4. Market Entropy
- 4.5. Patent/Trademark Analysis
- 5. Global Agricultural Haying and Forage Machinery Industry Analysis, Insights and Forecast, 2020-2032
- 5.1. Market Analysis, Insights and Forecast - by Type
- 5.1.1. Mowers
- 5.1.2. Balers
- 5.1.3. Forage Harvesters
- 5.1.4. Others
- 5.2. Market Analysis, Insights and Forecast - by Type
- 5.2.1. Mowers
- 5.2.2. Balers
- 5.2.3. Forage Harvesters
- 5.2.4. Others
- 5.3. Market Analysis, Insights and Forecast - by Region
- 5.3.1. North America
- 5.3.2. Europe
- 5.3.3. Asia Pacific
- 5.3.4. South America
- 5.3.5. Africa
- 5.1. Market Analysis, Insights and Forecast - by Type
- 6. North America Agricultural Haying and Forage Machinery Industry Analysis, Insights and Forecast, 2020-2032
- 6.1. Market Analysis, Insights and Forecast - by Type
- 6.1.1. Mowers
- 6.1.2. Balers
- 6.1.3. Forage Harvesters
- 6.1.4. Others
- 6.2. Market Analysis, Insights and Forecast - by Type
- 6.2.1. Mowers
- 6.2.2. Balers
- 6.2.3. Forage Harvesters
- 6.2.4. Others
- 6.1. Market Analysis, Insights and Forecast - by Type
- 7. Europe Agricultural Haying and Forage Machinery Industry Analysis, Insights and Forecast, 2020-2032
- 7.1. Market Analysis, Insights and Forecast - by Type
- 7.1.1. Mowers
- 7.1.2. Balers
- 7.1.3. Forage Harvesters
- 7.1.4. Others
- 7.2. Market Analysis, Insights and Forecast - by Type
- 7.2.1. Mowers
- 7.2.2. Balers
- 7.2.3. Forage Harvesters
- 7.2.4. Others
- 7.1. Market Analysis, Insights and Forecast - by Type
- 8. Asia Pacific Agricultural Haying and Forage Machinery Industry Analysis, Insights and Forecast, 2020-2032
- 8.1. Market Analysis, Insights and Forecast - by Type
- 8.1.1. Mowers
- 8.1.2. Balers
- 8.1.3. Forage Harvesters
- 8.1.4. Others
- 8.2. Market Analysis, Insights and Forecast - by Type
- 8.2.1. Mowers
- 8.2.2. Balers
- 8.2.3. Forage Harvesters
- 8.2.4. Others
- 8.1. Market Analysis, Insights and Forecast - by Type
- 9. South America Agricultural Haying and Forage Machinery Industry Analysis, Insights and Forecast, 2020-2032
- 9.1. Market Analysis, Insights and Forecast - by Type
- 9.1.1. Mowers
- 9.1.2. Balers
- 9.1.3. Forage Harvesters
- 9.1.4. Others
- 9.2. Market Analysis, Insights and Forecast - by Type
- 9.2.1. Mowers
- 9.2.2. Balers
- 9.2.3. Forage Harvesters
- 9.2.4. Others
- 9.1. Market Analysis, Insights and Forecast - by Type
- 10. Africa Agricultural Haying and Forage Machinery Industry Analysis, Insights and Forecast, 2020-2032
- 10.1. Market Analysis, Insights and Forecast - by Type
- 10.1.1. Mowers
- 10.1.2. Balers
- 10.1.3. Forage Harvesters
- 10.1.4. Others
- 10.2. Market Analysis, Insights and Forecast - by Type
- 10.2.1. Mowers
- 10.2.2. Balers
- 10.2.3. Forage Harvesters
- 10.2.4. Others
- 10.1. Market Analysis, Insights and Forecast - by Type
- 11. Competitive Analysis
- 11.1. Global Market Share Analysis 2025
- 11.2. Company Profiles
- 11.2.1 Kuhn Group
- 11.2.1.1. Overview
- 11.2.1.2. Products
- 11.2.1.3. SWOT Analysis
- 11.2.1.4. Recent Developments
- 11.2.1.5. Financials (Based on Availability)
- 11.2.2 Deere & Company (John Deere)
- 11.2.2.1. Overview
- 11.2.2.2. Products
- 11.2.2.3. SWOT Analysis
- 11.2.2.4. Recent Developments
- 11.2.2.5. Financials (Based on Availability)
- 11.2.3 CLAAS
- 11.2.3.1. Overview
- 11.2.3.2. Products
- 11.2.3.3. SWOT Analysis
- 11.2.3.4. Recent Developments
- 11.2.3.5. Financials (Based on Availability)
- 11.2.4 Kubota Corporation
- 11.2.4.1. Overview
- 11.2.4.2. Products
- 11.2.4.3. SWOT Analysis
- 11.2.4.4. Recent Developments
- 11.2.4.5. Financials (Based on Availability)
- 11.2.5 Farm Kin
- 11.2.5.1. Overview
- 11.2.5.2. Products
- 11.2.5.3. SWOT Analysis
- 11.2.5.4. Recent Developments
- 11.2.5.5. Financials (Based on Availability)
- 11.2.6 CNH Industrial
- 11.2.6.1. Overview
- 11.2.6.2. Products
- 11.2.6.3. SWOT Analysis
- 11.2.6.4. Recent Developments
- 11.2.6.5. Financials (Based on Availability)
- 11.2.7 Krone North America Inc
- 11.2.7.1. Overview
- 11.2.7.2. Products
- 11.2.7.3. SWOT Analysis
- 11.2.7.4. Recent Developments
- 11.2.7.5. Financials (Based on Availability)
- 11.2.8 Yanmar Company Limited
- 11.2.8.1. Overview
- 11.2.8.2. Products
- 11.2.8.3. SWOT Analysis
- 11.2.8.4. Recent Developments
- 11.2.8.5. Financials (Based on Availability)
- 11.2.9 AGCO Corporation
- 11.2.9.1. Overview
- 11.2.9.2. Products
- 11.2.9.3. SWOT Analysis
- 11.2.9.4. Recent Developments
- 11.2.9.5. Financials (Based on Availability)
- 11.2.1 Kuhn Group
List of Figures
- Figure 1: Global Agricultural Haying and Forage Machinery Industry Revenue Breakdown (billion, %) by Region 2025 & 2033
- Figure 2: North America Agricultural Haying and Forage Machinery Industry Revenue (billion), by Type 2025 & 2033
- Figure 3: North America Agricultural Haying and Forage Machinery Industry Revenue Share (%), by Type 2025 & 2033
- Figure 4: North America Agricultural Haying and Forage Machinery Industry Revenue (billion), by Type 2025 & 2033
- Figure 5: North America Agricultural Haying and Forage Machinery Industry Revenue Share (%), by Type 2025 & 2033
- Figure 6: North America Agricultural Haying and Forage Machinery Industry Revenue (billion), by Country 2025 & 2033
- Figure 7: North America Agricultural Haying and Forage Machinery Industry Revenue Share (%), by Country 2025 & 2033
- Figure 8: Europe Agricultural Haying and Forage Machinery Industry Revenue (billion), by Type 2025 & 2033
- Figure 9: Europe Agricultural Haying and Forage Machinery Industry Revenue Share (%), by Type 2025 & 2033
- Figure 10: Europe Agricultural Haying and Forage Machinery Industry Revenue (billion), by Type 2025 & 2033
- Figure 11: Europe Agricultural Haying and Forage Machinery Industry Revenue Share (%), by Type 2025 & 2033
- Figure 12: Europe Agricultural Haying and Forage Machinery Industry Revenue (billion), by Country 2025 & 2033
- Figure 13: Europe Agricultural Haying and Forage Machinery Industry Revenue Share (%), by Country 2025 & 2033
- Figure 14: Asia Pacific Agricultural Haying and Forage Machinery Industry Revenue (billion), by Type 2025 & 2033
- Figure 15: Asia Pacific Agricultural Haying and Forage Machinery Industry Revenue Share (%), by Type 2025 & 2033
- Figure 16: Asia Pacific Agricultural Haying and Forage Machinery Industry Revenue (billion), by Type 2025 & 2033
- Figure 17: Asia Pacific Agricultural Haying and Forage Machinery Industry Revenue Share (%), by Type 2025 & 2033
- Figure 18: Asia Pacific Agricultural Haying and Forage Machinery Industry Revenue (billion), by Country 2025 & 2033
- Figure 19: Asia Pacific Agricultural Haying and Forage Machinery Industry Revenue Share (%), by Country 2025 & 2033
- Figure 20: South America Agricultural Haying and Forage Machinery Industry Revenue (billion), by Type 2025 & 2033
- Figure 21: South America Agricultural Haying and Forage Machinery Industry Revenue Share (%), by Type 2025 & 2033
- Figure 22: South America Agricultural Haying and Forage Machinery Industry Revenue (billion), by Type 2025 & 2033
- Figure 23: South America Agricultural Haying and Forage Machinery Industry Revenue Share (%), by Type 2025 & 2033
- Figure 24: South America Agricultural Haying and Forage Machinery Industry Revenue (billion), by Country 2025 & 2033
- Figure 25: South America Agricultural Haying and Forage Machinery Industry Revenue Share (%), by Country 2025 & 2033
- Figure 26: Africa Agricultural Haying and Forage Machinery Industry Revenue (billion), by Type 2025 & 2033
- Figure 27: Africa Agricultural Haying and Forage Machinery Industry Revenue Share (%), by Type 2025 & 2033
- Figure 28: Africa Agricultural Haying and Forage Machinery Industry Revenue (billion), by Type 2025 & 2033
- Figure 29: Africa Agricultural Haying and Forage Machinery Industry Revenue Share (%), by Type 2025 & 2033
- Figure 30: Africa Agricultural Haying and Forage Machinery Industry Revenue (billion), by Country 2025 & 2033
- Figure 31: Africa Agricultural Haying and Forage Machinery Industry Revenue Share (%), by Country 2025 & 2033
List of Tables
- Table 1: Global Agricultural Haying and Forage Machinery Industry Revenue billion Forecast, by Type 2020 & 2033
- Table 2: Global Agricultural Haying and Forage Machinery Industry Revenue billion Forecast, by Type 2020 & 2033
- Table 3: Global Agricultural Haying and Forage Machinery Industry Revenue billion Forecast, by Region 2020 & 2033
- Table 4: Global Agricultural Haying and Forage Machinery Industry Revenue billion Forecast, by Type 2020 & 2033
- Table 5: Global Agricultural Haying and Forage Machinery Industry Revenue billion Forecast, by Type 2020 & 2033
- Table 6: Global Agricultural Haying and Forage Machinery Industry Revenue billion Forecast, by Country 2020 & 2033
- Table 7: United States Agricultural Haying and Forage Machinery Industry Revenue (billion) Forecast, by Application 2020 & 2033
- Table 8: Canada Agricultural Haying and Forage Machinery Industry Revenue (billion) Forecast, by Application 2020 & 2033
- Table 9: Rest of North America Agricultural Haying and Forage Machinery Industry Revenue (billion) Forecast, by Application 2020 & 2033
- Table 10: Global Agricultural Haying and Forage Machinery Industry Revenue billion Forecast, by Type 2020 & 2033
- Table 11: Global Agricultural Haying and Forage Machinery Industry Revenue billion Forecast, by Type 2020 & 2033
- Table 12: Global Agricultural Haying and Forage Machinery Industry Revenue billion Forecast, by Country 2020 & 2033
- Table 13: Germany Agricultural Haying and Forage Machinery Industry Revenue (billion) Forecast, by Application 2020 & 2033
- Table 14: United Kingdom Agricultural Haying and Forage Machinery Industry Revenue (billion) Forecast, by Application 2020 & 2033
- Table 15: France Agricultural Haying and Forage Machinery Industry Revenue (billion) Forecast, by Application 2020 & 2033
- Table 16: Italy Agricultural Haying and Forage Machinery Industry Revenue (billion) Forecast, by Application 2020 & 2033
- Table 17: Rest of Europe Agricultural Haying and Forage Machinery Industry Revenue (billion) Forecast, by Application 2020 & 2033
- Table 18: Global Agricultural Haying and Forage Machinery Industry Revenue billion Forecast, by Type 2020 & 2033
- Table 19: Global Agricultural Haying and Forage Machinery Industry Revenue billion Forecast, by Type 2020 & 2033
- Table 20: Global Agricultural Haying and Forage Machinery Industry Revenue billion Forecast, by Country 2020 & 2033
- Table 21: China Agricultural Haying and Forage Machinery Industry Revenue (billion) Forecast, by Application 2020 & 2033
- Table 22: India Agricultural Haying and Forage Machinery Industry Revenue (billion) Forecast, by Application 2020 & 2033
- Table 23: Japan Agricultural Haying and Forage Machinery Industry Revenue (billion) Forecast, by Application 2020 & 2033
- Table 24: Rest of Asia Pacific Agricultural Haying and Forage Machinery Industry Revenue (billion) Forecast, by Application 2020 & 2033
- Table 25: Global Agricultural Haying and Forage Machinery Industry Revenue billion Forecast, by Type 2020 & 2033
- Table 26: Global Agricultural Haying and Forage Machinery Industry Revenue billion Forecast, by Type 2020 & 2033
- Table 27: Global Agricultural Haying and Forage Machinery Industry Revenue billion Forecast, by Country 2020 & 2033
- Table 28: Brazil Agricultural Haying and Forage Machinery Industry Revenue (billion) Forecast, by Application 2020 & 2033
- Table 29: Argentina Agricultural Haying and Forage Machinery Industry Revenue (billion) Forecast, by Application 2020 & 2033
- Table 30: Rest of South America Agricultural Haying and Forage Machinery Industry Revenue (billion) Forecast, by Application 2020 & 2033
- Table 31: Global Agricultural Haying and Forage Machinery Industry Revenue billion Forecast, by Type 2020 & 2033
- Table 32: Global Agricultural Haying and Forage Machinery Industry Revenue billion Forecast, by Type 2020 & 2033
- Table 33: Global Agricultural Haying and Forage Machinery Industry Revenue billion Forecast, by Country 2020 & 2033
- Table 34: South Africa Agricultural Haying and Forage Machinery Industry Revenue (billion) Forecast, by Application 2020 & 2033
- Table 35: Rest of Africa Agricultural Haying and Forage Machinery Industry Revenue (billion) Forecast, by Application 2020 & 2033
Frequently Asked Questions
1. What is the projected Compound Annual Growth Rate (CAGR) of the Agricultural Haying and Forage Machinery Industry?
The projected CAGR is approximately 4.1%.
2. Which companies are prominent players in the Agricultural Haying and Forage Machinery Industry?
Key companies in the market include Kuhn Group, Deere & Company (John Deere), CLAAS, Kubota Corporation, Farm Kin, CNH Industrial, Krone North America Inc, Yanmar Company Limited, AGCO Corporation.
3. What are the main segments of the Agricultural Haying and Forage Machinery Industry?
The market segments include Type, Type.
4. Can you provide details about the market size?
The market size is estimated to be USD 9.5 billion as of 2022.
5. What are some drivers contributing to market growth?
Increasing Demand for Tomato; Adoption of Greenhouse Technology in Tomato Cultivation; Government support.
6. What are the notable trends driving market growth?
Government Support to Farmers is Driving the Market.
7. Are there any restraints impacting market growth?
Increasing Loses due to Physiological Disorder. Pest and Disease; Unfavourable Climatic Condition.
8. Can you provide examples of recent developments in the market?
N/A
9. What pricing options are available for accessing the report?
Pricing options include single-user, multi-user, and enterprise licenses priced at USD 4750, USD 5250, and USD 8750 respectively.
10. Is the market size provided in terms of value or volume?
The market size is provided in terms of value, measured in billion.
11. Are there any specific market keywords associated with the report?
Yes, the market keyword associated with the report is "Agricultural Haying and Forage Machinery Industry," which aids in identifying and referencing the specific market segment covered.
12. How do I determine which pricing option suits my needs best?
The pricing options vary based on user requirements and access needs. Individual users may opt for single-user licenses, while businesses requiring broader access may choose multi-user or enterprise licenses for cost-effective access to the report.
13. Are there any additional resources or data provided in the Agricultural Haying and Forage Machinery Industry report?
While the report offers comprehensive insights, it's advisable to review the specific contents or supplementary materials provided to ascertain if additional resources or data are available.
14. How can I stay updated on further developments or reports in the Agricultural Haying and Forage Machinery Industry?
To stay informed about further developments, trends, and reports in the Agricultural Haying and Forage Machinery Industry, consider subscribing to industry newsletters, following relevant companies and organizations, or regularly checking reputable industry news sources and publications.
Methodology
Step 1 - Identification of Relevant Samples Size from Population Database


Step 2 - Approaches for Defining Global Market Size (Value, Volume* & Price*)

Note*: In applicable scenarios
Step 3 - Data Sources
Primary Research
- Web Analytics
- Survey Reports
- Research Institute
- Latest Research Reports
- Opinion Leaders
Secondary Research
- Annual Reports
- White Paper
- Latest Press Release
- Industry Association
- Paid Database
- Investor Presentations

Step 4 - Data Triangulation
Involves using different sources of information in order to increase the validity of a study
These sources are likely to be stakeholders in a program - participants, other researchers, program staff, other community members, and so on.
Then we put all data in single framework & apply various statistical tools to find out the dynamic on the market.
During the analysis stage, feedback from the stakeholder groups would be compared to determine areas of agreement as well as areas of divergence