

Key Insights
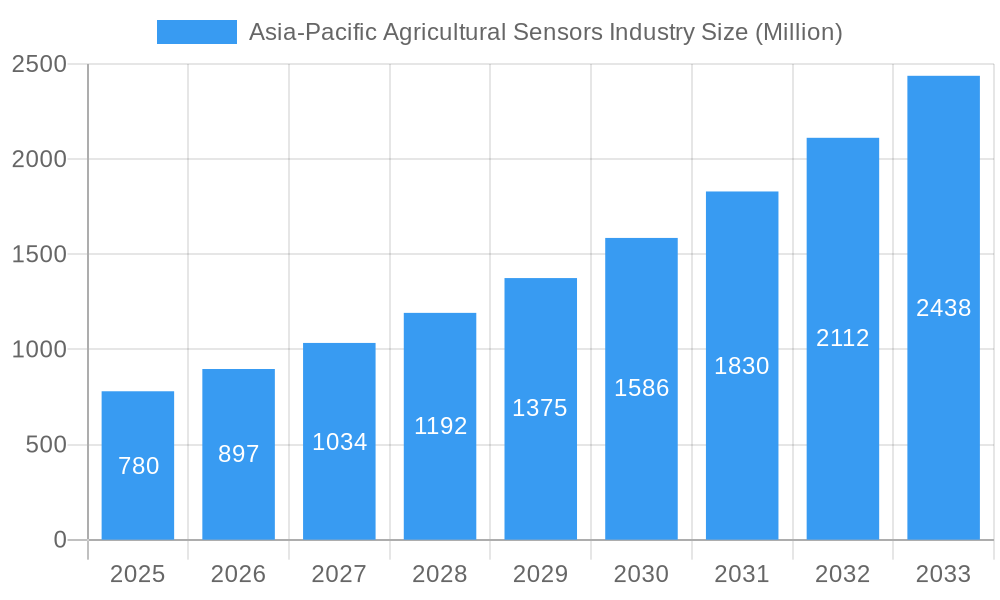
The Asia-Pacific agricultural sensors market, valued at $0.78 billion in 2025, is poised for significant growth, exhibiting a Compound Annual Growth Rate (CAGR) of 15.40% from 2025 to 2033. This robust expansion is driven by several key factors. Firstly, the increasing adoption of precision agriculture techniques across the region necessitates advanced sensor technologies for optimized resource management (water, fertilizer, pesticides). Secondly, government initiatives promoting technological advancements in farming, coupled with rising farmer awareness of the benefits of data-driven agriculture, are fueling market demand. Thirdly, the region's diverse agricultural landscape and substantial arable land offer immense potential for sensor deployment across various crops and livestock. The market segmentation reveals that pressure sensors, temperature sensors, and location sensors currently hold significant market share, with optical sensors and other types showing considerable potential for future growth. Key players like Caipos GmbH, Konica Minolta Inc., and Trimble Inc. are actively contributing to innovation and market expansion. However, high initial investment costs associated with sensor technology and the digital literacy gap among some farmers pose challenges to widespread adoption. Nevertheless, the overall market outlook remains positive, fueled by continuous technological advancements, increasing government support, and the growing need for enhanced agricultural productivity and sustainability in the face of climate change.
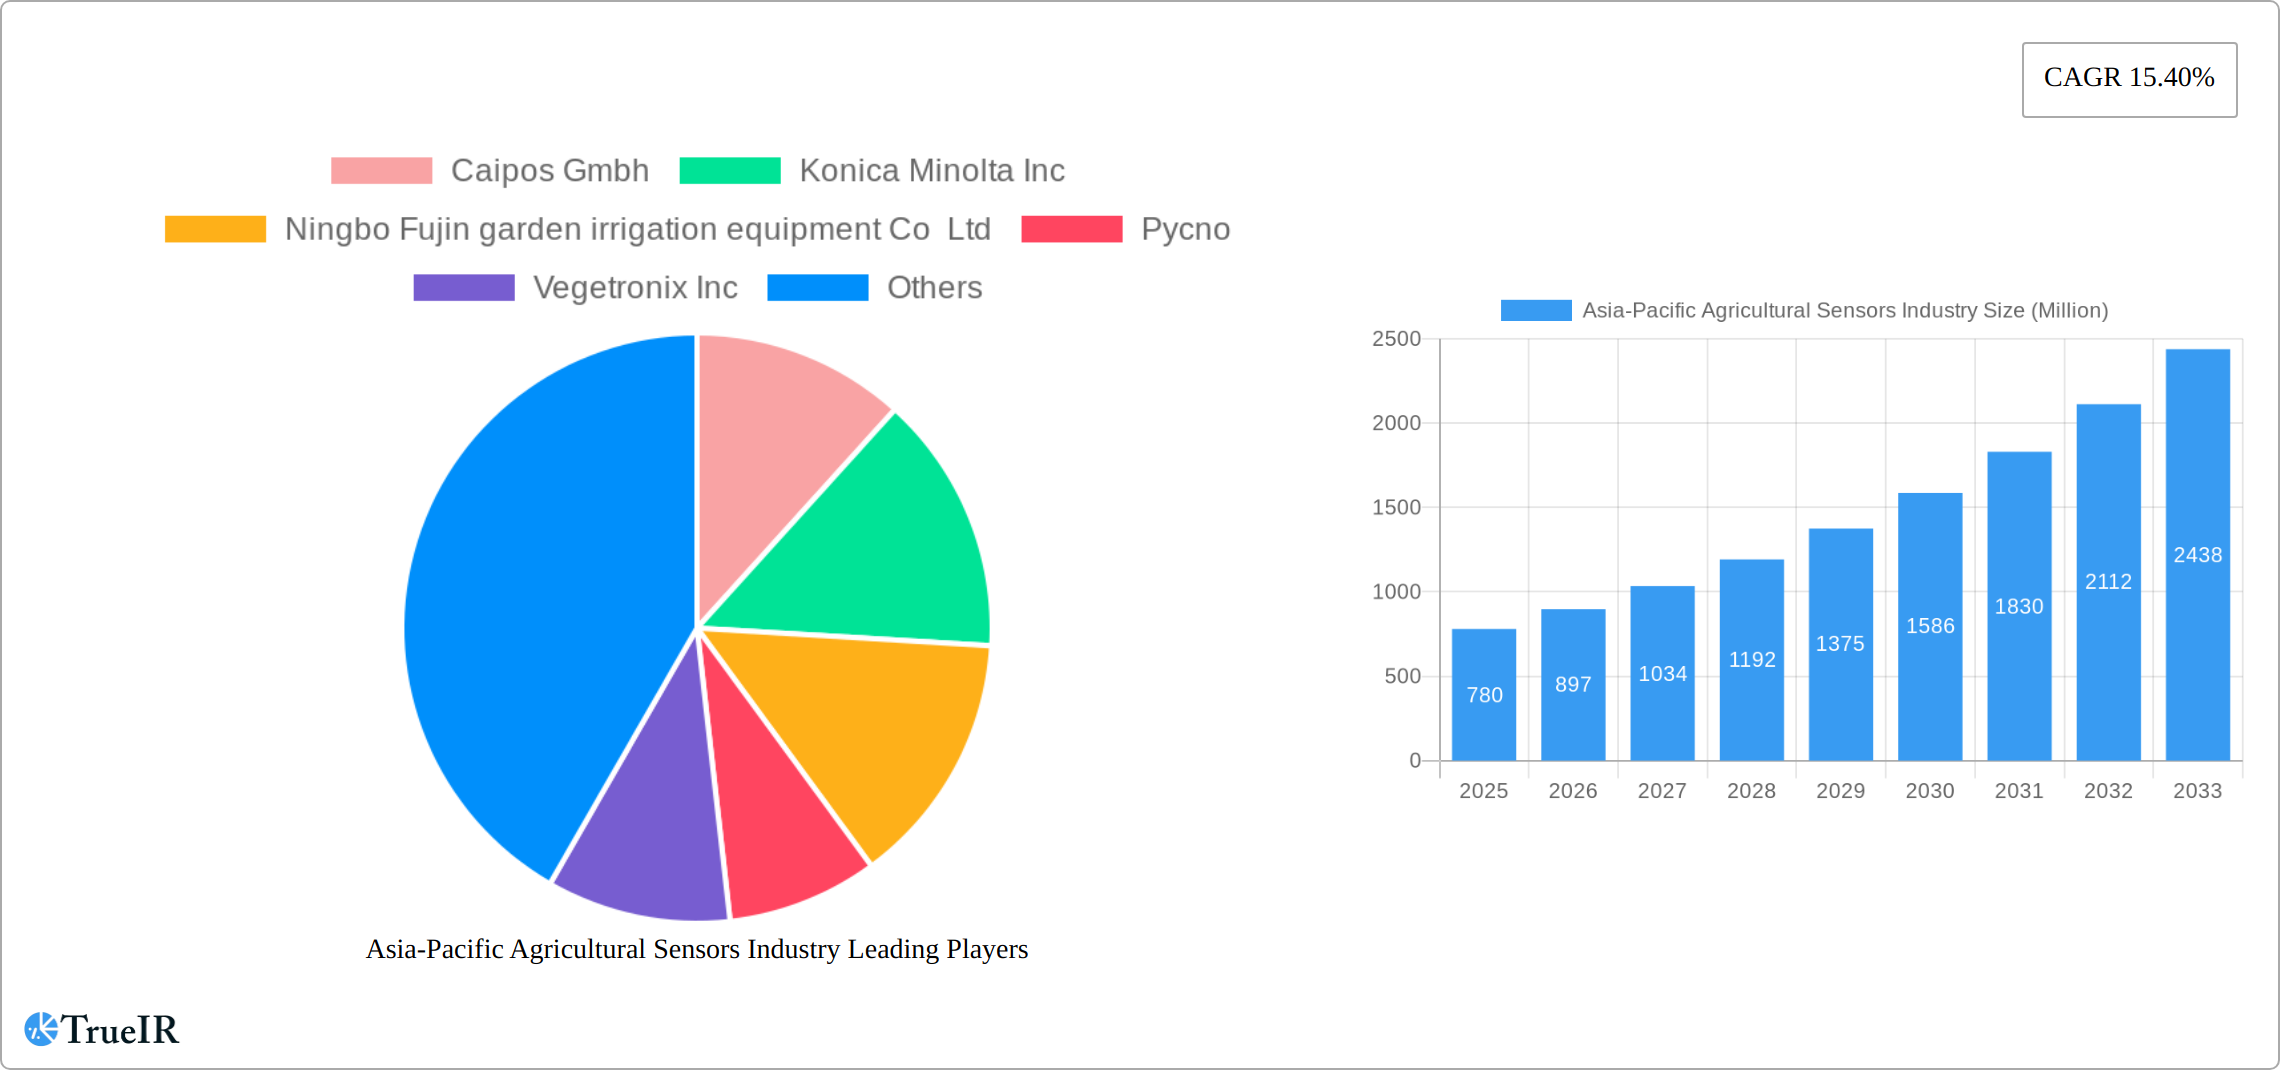
Asia-Pacific Agricultural Sensors Industry Market Size (In Million)
The Asia-Pacific region's dominance is primarily attributed to the large agricultural sector in countries like China, India, and Japan. These countries' substantial investments in agricultural modernization and the increasing adoption of precision farming practices create a favorable environment for sensor technology integration. Furthermore, the presence of established agricultural sensor manufacturers and a developing ecosystem of technology providers within the region contribute to the market's rapid growth. Specific segments within the market are experiencing varying growth trajectories. For example, the demand for optical sensors is experiencing accelerated growth driven by the increased need for remote sensing applications in crop monitoring and yield prediction. The continuous innovation in sensor technology, offering greater accuracy, durability, and affordability, will play a crucial role in overcoming existing restraints and driving further market expansion throughout the forecast period.
Asia-Pacific Agricultural Sensors Industry Company Market Share
Asia-Pacific Agricultural Sensors Industry Market Report: 2019-2033
This comprehensive report provides a detailed analysis of the Asia-Pacific agricultural sensors industry, offering invaluable insights for stakeholders seeking to understand market dynamics, competitive landscapes, and future growth opportunities. The report covers the period 2019-2033, with a focus on the estimated year 2025 and a forecast period of 2025-2033. The market is segmented by sensor type (Pressure Sensors, Temperature Sensors, Location Sensors, Optical Sensors, Other Types), providing a granular view of segment-specific trends and growth drivers. Market size is projected in Millions of USD.
Asia-Pacific Agricultural Sensors Industry Market Structure & Competitive Landscape
The Asia-Pacific agricultural sensors market exhibits a moderately concentrated structure, with a few major players holding significant market share. The Herfindahl-Hirschman Index (HHI) in 2025 is estimated at xx, indicating a moderately competitive landscape. Innovation is a key driver, with companies continuously developing advanced sensor technologies to improve precision agriculture practices. Regulatory frameworks, such as those promoting sustainable agriculture and data privacy, exert a notable influence. Product substitutes, including traditional farming methods and less sophisticated monitoring systems, pose a challenge. The market shows significant end-user segmentation across various farm sizes and crop types. M&A activity remains relatively low, with an estimated xx Million USD worth of transactions in 2024, suggesting a strategic focus on organic growth rather than consolidation.
- Market Concentration: HHI estimated at xx in 2025.
- Innovation Drivers: Advancements in sensor technology, AI-driven analytics, and IoT integration.
- Regulatory Impacts: Government initiatives promoting precision agriculture and data security.
- Product Substitutes: Traditional farming practices and basic monitoring tools.
- End-User Segmentation: Diverse farm sizes and crop types create varied demand.
- M&A Trends: Low M&A activity in recent years, with an estimated xx Million USD in transactions in 2024.
Asia-Pacific Agricultural Sensors Industry Market Trends & Opportunities
The Asia-Pacific agricultural sensors market is experiencing robust growth, driven by increasing demand for efficient and sustainable farming practices. The market size is estimated at xx Million USD in 2025, exhibiting a CAGR of xx% from 2025 to 2033. Technological advancements, such as the integration of AI and IoT in sensor networks, are significantly impacting market dynamics. Consumer preferences are shifting towards precision agriculture techniques that enhance crop yields and reduce resource consumption. Competitive dynamics are characterized by innovation, strategic partnerships, and a focus on providing comprehensive data analytics solutions. Market penetration rates are gradually increasing, particularly in regions with advanced agricultural infrastructure. The rising adoption of precision agriculture techniques across the region creates significant opportunities for growth.
Dominant Markets & Segments in Asia-Pacific Agricultural Sensors Industry
China and India stand as the titans of the Asia-Pacific agricultural sensors industry, collectively anticipated to command an impressive xx% of the total market value by 2025. Among the diverse array of sensor technologies, optical sensors continue to lead, propelled by their indispensable role in a multitude of precision agriculture applications that enhance efficiency and yield.
- Key Growth Drivers in China: Robust government backing for agricultural modernization, coupled with continuous technological innovation and substantial investments in smart farming initiatives, are propelling China's market dominance.
- Key Growth Drivers in India: The escalating adoption of precision agriculture techniques across India, spurred by increasing government focus on modernizing its vast agricultural sector through supportive policies and subsidies, is driving significant market expansion.
- Optical Sensors Dominance: Their unparalleled versatility in tasks such as real-time crop health monitoring, accurate yield forecasting, early disease and pest detection, and precise nutrient management solidifies their leading position.
Detailed Analysis: China's sheer agricultural scale and its proactive governmental commitment to fostering technological advancements in farming have cemented its leading position. India, with its immense agrarian population and a growing realization of the benefits offered by precision farming, is experiencing rapid market acceleration. The inherent adaptability and wide-ranging utility of optical sensors, enabling sophisticated applications like advanced remote sensing for field analysis and predictive yield modeling, have been instrumental in their widespread integration throughout the Asia-Pacific region.
Asia-Pacific Agricultural Sensors Industry Product Analysis
The Asia-Pacific agricultural sensors market is characterized by a dynamic landscape of continuous product innovation, with a relentless focus on engineering sensors that are not only more precise and reliable but also increasingly cost-effective and durable for the demanding agricultural environment. These advancements are meticulously tailored to address critical precision farming needs, including intelligent irrigation management, comprehensive soil health analysis, and proactive disease and pest identification. Leading competitive advantages in this sector are increasingly defined by superior accuracy, long-term operational reliability in diverse conditions, seamless integration capabilities with existing farm management software, and the provision of intuitive data analytics platforms that empower farmers with actionable insights.
Key Drivers, Barriers & Challenges in Asia-Pacific Agricultural Sensors Industry
Key Drivers: The confluence of rapid technological advancements, particularly the integration of the Internet of Things (IoT) and Artificial Intelligence (AI), coupled with supportive government policies actively promoting precision farming adoption and a growing global imperative for sustainable agricultural practices, are the primary catalysts for market expansion. Tangible examples include government subsidies aimed at reducing the initial financial burden of sensor acquisition and substantial investments in agricultural research and development to foster innovation.
Challenges: Significant hurdles remain, including the substantial initial investment costs associated with sophisticated sensor systems, a persistent digital literacy gap among a segment of the farming community, and the inherent complexity involved in integrating diverse sensor data streams with legacy farm management systems. Furthermore, disruptions within the global supply chain, particularly concerning critical sensor components, present considerable operational challenges. Regulatory uncertainties surrounding data privacy, ownership, and standardization can also impede broader market penetration. The intense competitive pressure exerted by well-established industry incumbents, alongside the strategic entry of agile new players, further intensifies the market dynamics.
Growth Drivers in the Asia-Pacific Agricultural Sensors Industry Market
The Asia-Pacific agricultural sensors market is experiencing robust growth, primarily fueled by transformative technological advancements, proactive and supportive government policies, and the escalating global demand for more efficient, sustainable, and resilient farming practices. Notably, the seamless integration of cutting-edge AI and IoT technologies into comprehensive agricultural sensor networks is unlocking unprecedented opportunities for data-driven decision-making. Government-led initiatives, offering attractive subsidies for the adoption of advanced sensor technology, and concerted efforts to develop and enhance robust agricultural infrastructure are further accelerating market expansion and adoption rates across the region.
Challenges Impacting Asia-Pacific Agricultural Sensors Industry Growth
High initial investment costs, digital literacy gaps among farmers, and the integration complexities of sensor data with existing farm management systems pose significant challenges. Supply chain vulnerabilities, particularly concerning raw materials and components, also restrain market growth. Furthermore, regulatory uncertainties, particularly in data privacy and security, can impede market expansion.
Key Players Shaping the Asia-Pacific Agricultural Sensors Industry Market
- Caipos GmbH
- Konica Minolta Inc
- Ningbo Fujin garden irrigation equipment Co Ltd
- Pycno
- Vegetronix Inc
- TekBox Digital Solutions Vietnam Co Ltd
- Libelium Comunicaciones Distribuidas Sl
- Trimble Inc
Significant Asia-Pacific Agricultural Sensors Industry Milestones
- 2022-Q4: Launch of a new generation of optical sensors by Vegetronix Inc.
- 2023-Q1: Partnership between Caipos GmbH and a major agricultural technology company in China.
- 2023-Q3: Government of India announces funding for precision agriculture initiatives.
- 2024-Q2: Konica Minolta Inc. releases advanced soil moisture sensor.
Future Outlook for Asia-Pacific Agricultural Sensors Industry Market
The Asia-Pacific agricultural sensors market is poised for significant growth, driven by technological advancements, supportive government policies, and the increasing adoption of precision agriculture techniques. Strategic partnerships and the development of integrated data analytics solutions will play a key role in shaping the industry's future. The market holds substantial potential for expansion, particularly in emerging economies with large agricultural sectors.
Asia-Pacific Agricultural Sensors Industry Segmentation
- 1. Production Analysis
- 2. Consumption Analysis
- 3. Import Market Analysis (Value & Volume)
- 4. Export Market Analysis (Value & Volume)
- 5. Price Trend Analysis
Asia-Pacific Agricultural Sensors Industry Segmentation By Geography
-
1. Asia Pacific
- 1.1. China
- 1.2. Japan
- 1.3. South Korea
- 1.4. India
- 1.5. Australia
- 1.6. New Zealand
- 1.7. Indonesia
- 1.8. Malaysia
- 1.9. Singapore
- 1.10. Thailand
- 1.11. Vietnam
- 1.12. Philippines
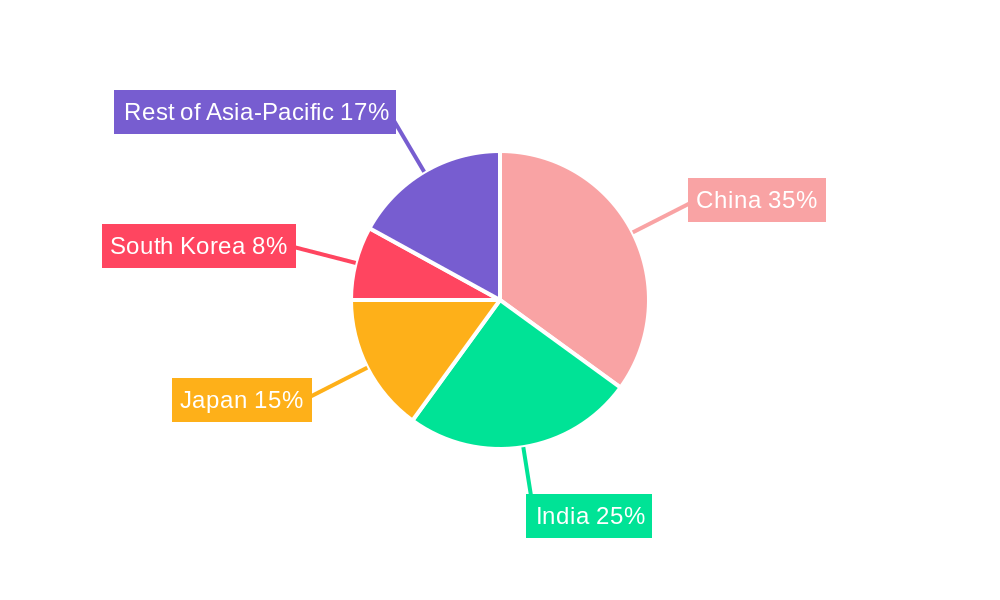
Asia-Pacific Agricultural Sensors Industry Regional Market Share
Geographic Coverage of Asia-Pacific Agricultural Sensors Industry
Asia-Pacific Agricultural Sensors Industry REPORT HIGHLIGHTS
| Aspects | Details |
|---|---|
| Study Period | 2020-2034 |
| Base Year | 2025 |
| Estimated Year | 2026 |
| Forecast Period | 2026-2034 |
| Historical Period | 2020-2025 |
| Growth Rate | CAGR of 15.40% from 2020-2034 |
| Segmentation |
|
Table of Contents
- 1. Introduction
- 1.1. Research Scope
- 1.2. Market Segmentation
- 1.3. Research Methodology
- 1.4. Definitions and Assumptions
- 2. Executive Summary
- 2.1. Introduction
- 3. Market Dynamics
- 3.1. Introduction
- 3.2. Market Drivers
- 3.2.1. Increasing Legalization of Cannabis; Growing Focus on Health Benefits of Cannabis
- 3.3. Market Restrains
- 3.3.1. Lack of Data on Dosages and Results; Lack of Access to Financial Assistance
- 3.4. Market Trends
- 3.4.1. Increasing Farm Mechanization Rates
- 4. Market Factor Analysis
- 4.1. Porters Five Forces
- 4.2. Supply/Value Chain
- 4.3. PESTEL analysis
- 4.4. Market Entropy
- 4.5. Patent/Trademark Analysis
- 5. Asia-Pacific Agricultural Sensors Industry Analysis, Insights and Forecast, 2020-2032
- 5.1. Market Analysis, Insights and Forecast - by Production Analysis
- 5.2. Market Analysis, Insights and Forecast - by Consumption Analysis
- 5.3. Market Analysis, Insights and Forecast - by Import Market Analysis (Value & Volume)
- 5.4. Market Analysis, Insights and Forecast - by Export Market Analysis (Value & Volume)
- 5.5. Market Analysis, Insights and Forecast - by Price Trend Analysis
- 5.6. Market Analysis, Insights and Forecast - by Region
- 5.6.1. Asia Pacific
- 5.1. Market Analysis, Insights and Forecast - by Production Analysis
- 6. Competitive Analysis
- 6.1. Market Share Analysis 2025
- 6.2. Company Profiles
- 6.2.1 Caipos Gmbh
- 6.2.1.1. Overview
- 6.2.1.2. Products
- 6.2.1.3. SWOT Analysis
- 6.2.1.4. Recent Developments
- 6.2.1.5. Financials (Based on Availability)
- 6.2.2 Konica Minolta Inc
- 6.2.2.1. Overview
- 6.2.2.2. Products
- 6.2.2.3. SWOT Analysis
- 6.2.2.4. Recent Developments
- 6.2.2.5. Financials (Based on Availability)
- 6.2.3 Ningbo Fujin garden irrigation equipment Co Ltd
- 6.2.3.1. Overview
- 6.2.3.2. Products
- 6.2.3.3. SWOT Analysis
- 6.2.3.4. Recent Developments
- 6.2.3.5. Financials (Based on Availability)
- 6.2.4 Pycno
- 6.2.4.1. Overview
- 6.2.4.2. Products
- 6.2.4.3. SWOT Analysis
- 6.2.4.4. Recent Developments
- 6.2.4.5. Financials (Based on Availability)
- 6.2.5 Vegetronix Inc
- 6.2.5.1. Overview
- 6.2.5.2. Products
- 6.2.5.3. SWOT Analysis
- 6.2.5.4. Recent Developments
- 6.2.5.5. Financials (Based on Availability)
- 6.2.6 TekBox Digital Solutions Vietnam Co Lt
- 6.2.6.1. Overview
- 6.2.6.2. Products
- 6.2.6.3. SWOT Analysis
- 6.2.6.4. Recent Developments
- 6.2.6.5. Financials (Based on Availability)
- 6.2.7 Libelium Comunicaciones Distribuidas Sl
- 6.2.7.1. Overview
- 6.2.7.2. Products
- 6.2.7.3. SWOT Analysis
- 6.2.7.4. Recent Developments
- 6.2.7.5. Financials (Based on Availability)
- 6.2.8 Trimble Inc
- 6.2.8.1. Overview
- 6.2.8.2. Products
- 6.2.8.3. SWOT Analysis
- 6.2.8.4. Recent Developments
- 6.2.8.5. Financials (Based on Availability)
- 6.2.1 Caipos Gmbh
List of Figures
- Figure 1: Asia-Pacific Agricultural Sensors Industry Revenue Breakdown (Million, %) by Product 2025 & 2033
- Figure 2: Asia-Pacific Agricultural Sensors Industry Share (%) by Company 2025
List of Tables
- Table 1: Asia-Pacific Agricultural Sensors Industry Revenue Million Forecast, by Production Analysis 2020 & 2033
- Table 2: Asia-Pacific Agricultural Sensors Industry Volume Kiloton Forecast, by Production Analysis 2020 & 2033
- Table 3: Asia-Pacific Agricultural Sensors Industry Revenue Million Forecast, by Consumption Analysis 2020 & 2033
- Table 4: Asia-Pacific Agricultural Sensors Industry Volume Kiloton Forecast, by Consumption Analysis 2020 & 2033
- Table 5: Asia-Pacific Agricultural Sensors Industry Revenue Million Forecast, by Import Market Analysis (Value & Volume) 2020 & 2033
- Table 6: Asia-Pacific Agricultural Sensors Industry Volume Kiloton Forecast, by Import Market Analysis (Value & Volume) 2020 & 2033
- Table 7: Asia-Pacific Agricultural Sensors Industry Revenue Million Forecast, by Export Market Analysis (Value & Volume) 2020 & 2033
- Table 8: Asia-Pacific Agricultural Sensors Industry Volume Kiloton Forecast, by Export Market Analysis (Value & Volume) 2020 & 2033
- Table 9: Asia-Pacific Agricultural Sensors Industry Revenue Million Forecast, by Price Trend Analysis 2020 & 2033
- Table 10: Asia-Pacific Agricultural Sensors Industry Volume Kiloton Forecast, by Price Trend Analysis 2020 & 2033
- Table 11: Asia-Pacific Agricultural Sensors Industry Revenue Million Forecast, by Region 2020 & 2033
- Table 12: Asia-Pacific Agricultural Sensors Industry Volume Kiloton Forecast, by Region 2020 & 2033
- Table 13: Asia-Pacific Agricultural Sensors Industry Revenue Million Forecast, by Production Analysis 2020 & 2033
- Table 14: Asia-Pacific Agricultural Sensors Industry Volume Kiloton Forecast, by Production Analysis 2020 & 2033
- Table 15: Asia-Pacific Agricultural Sensors Industry Revenue Million Forecast, by Consumption Analysis 2020 & 2033
- Table 16: Asia-Pacific Agricultural Sensors Industry Volume Kiloton Forecast, by Consumption Analysis 2020 & 2033
- Table 17: Asia-Pacific Agricultural Sensors Industry Revenue Million Forecast, by Import Market Analysis (Value & Volume) 2020 & 2033
- Table 18: Asia-Pacific Agricultural Sensors Industry Volume Kiloton Forecast, by Import Market Analysis (Value & Volume) 2020 & 2033
- Table 19: Asia-Pacific Agricultural Sensors Industry Revenue Million Forecast, by Export Market Analysis (Value & Volume) 2020 & 2033
- Table 20: Asia-Pacific Agricultural Sensors Industry Volume Kiloton Forecast, by Export Market Analysis (Value & Volume) 2020 & 2033
- Table 21: Asia-Pacific Agricultural Sensors Industry Revenue Million Forecast, by Price Trend Analysis 2020 & 2033
- Table 22: Asia-Pacific Agricultural Sensors Industry Volume Kiloton Forecast, by Price Trend Analysis 2020 & 2033
- Table 23: Asia-Pacific Agricultural Sensors Industry Revenue Million Forecast, by Country 2020 & 2033
- Table 24: Asia-Pacific Agricultural Sensors Industry Volume Kiloton Forecast, by Country 2020 & 2033
- Table 25: China Asia-Pacific Agricultural Sensors Industry Revenue (Million) Forecast, by Application 2020 & 2033
- Table 26: China Asia-Pacific Agricultural Sensors Industry Volume (Kiloton) Forecast, by Application 2020 & 2033
- Table 27: Japan Asia-Pacific Agricultural Sensors Industry Revenue (Million) Forecast, by Application 2020 & 2033
- Table 28: Japan Asia-Pacific Agricultural Sensors Industry Volume (Kiloton) Forecast, by Application 2020 & 2033
- Table 29: South Korea Asia-Pacific Agricultural Sensors Industry Revenue (Million) Forecast, by Application 2020 & 2033
- Table 30: South Korea Asia-Pacific Agricultural Sensors Industry Volume (Kiloton) Forecast, by Application 2020 & 2033
- Table 31: India Asia-Pacific Agricultural Sensors Industry Revenue (Million) Forecast, by Application 2020 & 2033
- Table 32: India Asia-Pacific Agricultural Sensors Industry Volume (Kiloton) Forecast, by Application 2020 & 2033
- Table 33: Australia Asia-Pacific Agricultural Sensors Industry Revenue (Million) Forecast, by Application 2020 & 2033
- Table 34: Australia Asia-Pacific Agricultural Sensors Industry Volume (Kiloton) Forecast, by Application 2020 & 2033
- Table 35: New Zealand Asia-Pacific Agricultural Sensors Industry Revenue (Million) Forecast, by Application 2020 & 2033
- Table 36: New Zealand Asia-Pacific Agricultural Sensors Industry Volume (Kiloton) Forecast, by Application 2020 & 2033
- Table 37: Indonesia Asia-Pacific Agricultural Sensors Industry Revenue (Million) Forecast, by Application 2020 & 2033
- Table 38: Indonesia Asia-Pacific Agricultural Sensors Industry Volume (Kiloton) Forecast, by Application 2020 & 2033
- Table 39: Malaysia Asia-Pacific Agricultural Sensors Industry Revenue (Million) Forecast, by Application 2020 & 2033
- Table 40: Malaysia Asia-Pacific Agricultural Sensors Industry Volume (Kiloton) Forecast, by Application 2020 & 2033
- Table 41: Singapore Asia-Pacific Agricultural Sensors Industry Revenue (Million) Forecast, by Application 2020 & 2033
- Table 42: Singapore Asia-Pacific Agricultural Sensors Industry Volume (Kiloton) Forecast, by Application 2020 & 2033
- Table 43: Thailand Asia-Pacific Agricultural Sensors Industry Revenue (Million) Forecast, by Application 2020 & 2033
- Table 44: Thailand Asia-Pacific Agricultural Sensors Industry Volume (Kiloton) Forecast, by Application 2020 & 2033
- Table 45: Vietnam Asia-Pacific Agricultural Sensors Industry Revenue (Million) Forecast, by Application 2020 & 2033
- Table 46: Vietnam Asia-Pacific Agricultural Sensors Industry Volume (Kiloton) Forecast, by Application 2020 & 2033
- Table 47: Philippines Asia-Pacific Agricultural Sensors Industry Revenue (Million) Forecast, by Application 2020 & 2033
- Table 48: Philippines Asia-Pacific Agricultural Sensors Industry Volume (Kiloton) Forecast, by Application 2020 & 2033
Frequently Asked Questions
1. What is the projected Compound Annual Growth Rate (CAGR) of the Asia-Pacific Agricultural Sensors Industry?
The projected CAGR is approximately 15.40%.
2. Which companies are prominent players in the Asia-Pacific Agricultural Sensors Industry?
Key companies in the market include Caipos Gmbh, Konica Minolta Inc, Ningbo Fujin garden irrigation equipment Co Ltd, Pycno, Vegetronix Inc, TekBox Digital Solutions Vietnam Co Lt, Libelium Comunicaciones Distribuidas Sl, Trimble Inc.
3. What are the main segments of the Asia-Pacific Agricultural Sensors Industry?
The market segments include Production Analysis, Consumption Analysis, Import Market Analysis (Value & Volume), Export Market Analysis (Value & Volume), Price Trend Analysis.
4. Can you provide details about the market size?
The market size is estimated to be USD 0.78 Million as of 2022.
5. What are some drivers contributing to market growth?
Increasing Legalization of Cannabis; Growing Focus on Health Benefits of Cannabis.
6. What are the notable trends driving market growth?
Increasing Farm Mechanization Rates.
7. Are there any restraints impacting market growth?
Lack of Data on Dosages and Results; Lack of Access to Financial Assistance.
8. Can you provide examples of recent developments in the market?
N/A
9. What pricing options are available for accessing the report?
Pricing options include single-user, multi-user, and enterprise licenses priced at USD 4750, USD 5250, and USD 8750 respectively.
10. Is the market size provided in terms of value or volume?
The market size is provided in terms of value, measured in Million and volume, measured in Kiloton.
11. Are there any specific market keywords associated with the report?
Yes, the market keyword associated with the report is "Asia-Pacific Agricultural Sensors Industry," which aids in identifying and referencing the specific market segment covered.
12. How do I determine which pricing option suits my needs best?
The pricing options vary based on user requirements and access needs. Individual users may opt for single-user licenses, while businesses requiring broader access may choose multi-user or enterprise licenses for cost-effective access to the report.
13. Are there any additional resources or data provided in the Asia-Pacific Agricultural Sensors Industry report?
While the report offers comprehensive insights, it's advisable to review the specific contents or supplementary materials provided to ascertain if additional resources or data are available.
14. How can I stay updated on further developments or reports in the Asia-Pacific Agricultural Sensors Industry?
To stay informed about further developments, trends, and reports in the Asia-Pacific Agricultural Sensors Industry, consider subscribing to industry newsletters, following relevant companies and organizations, or regularly checking reputable industry news sources and publications.
Methodology
Step 1 - Identification of Relevant Samples Size from Population Database


Step 2 - Approaches for Defining Global Market Size (Value, Volume* & Price*)

Note*: In applicable scenarios
Step 3 - Data Sources
Primary Research
- Web Analytics
- Survey Reports
- Research Institute
- Latest Research Reports
- Opinion Leaders
Secondary Research
- Annual Reports
- White Paper
- Latest Press Release
- Industry Association
- Paid Database
- Investor Presentations

Step 4 - Data Triangulation
Involves using different sources of information in order to increase the validity of a study
These sources are likely to be stakeholders in a program - participants, other researchers, program staff, other community members, and so on.
Then we put all data in single framework & apply various statistical tools to find out the dynamic on the market.
During the analysis stage, feedback from the stakeholder groups would be compared to determine areas of agreement as well as areas of divergence