

Key Insights
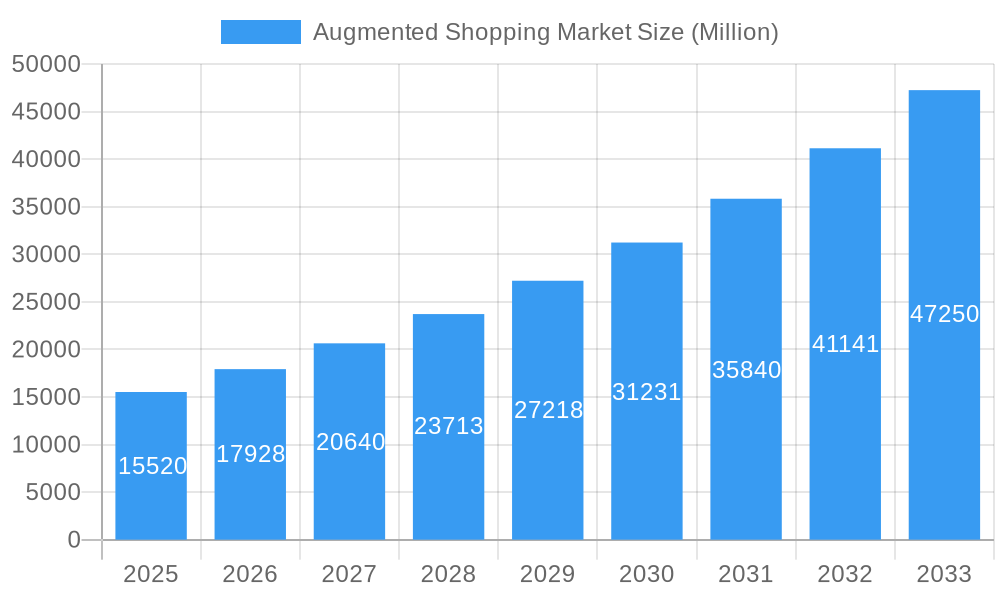
The augmented reality (AR) shopping market is experiencing significant growth, projected to reach $15.52 billion in 2025 and maintain a Compound Annual Growth Rate (CAGR) of 15.78% from 2025 to 2033. This expansion is driven by several key factors. Firstly, the increasing adoption of smartphones and other smart devices equipped with advanced AR capabilities provides a readily available platform for immersive shopping experiences. Secondly, retailers are increasingly leveraging AR to enhance customer engagement, improve product visualization, and reduce return rates. Interactive virtual try-ons for apparel, cosmetics, and furniture are becoming commonplace, offering consumers a more convenient and personalized shopping journey. This trend is further amplified by the growing popularity of e-commerce, as AR bridges the gap between online and offline shopping experiences. Finally, advancements in AR technology, including improved tracking accuracy and more realistic rendering, continue to drive market expansion. Key players like Magic Leap, Blippar, and Apple are at the forefront of these innovations, continuously enhancing AR shopping applications and hardware.
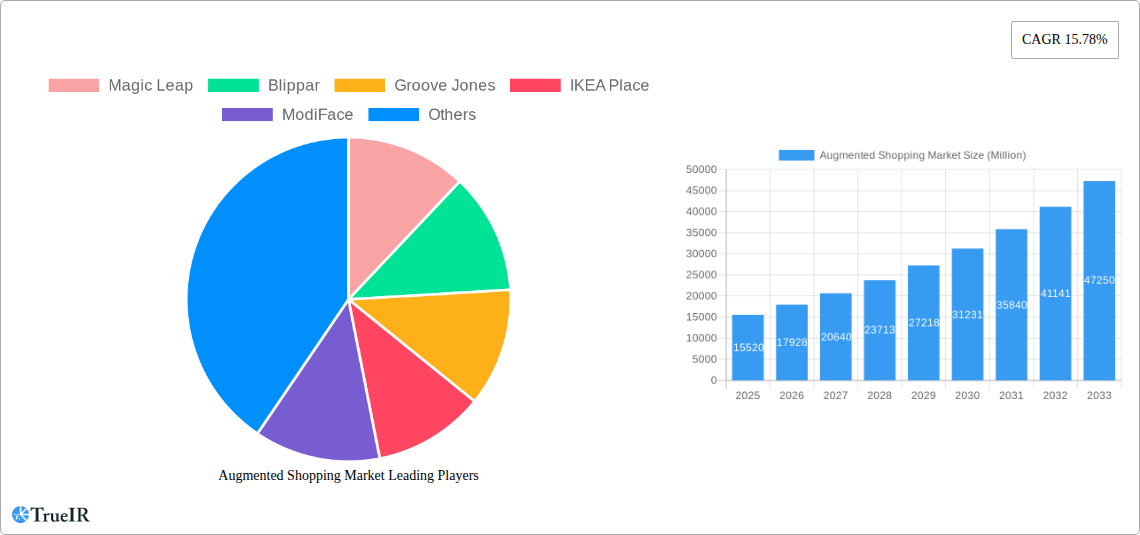
Augmented Shopping Market Market Size (In Billion)
The market's growth, however, is not without its challenges. Consumer privacy concerns surrounding data collection during AR shopping experiences require careful attention from retailers and developers. Moreover, the initial cost of developing and implementing AR shopping solutions can act as a barrier for smaller businesses. Despite these restraints, the overall market outlook remains highly positive. The continuous innovation in AR technology, coupled with the expanding adoption of e-commerce and the increasing demand for personalized shopping experiences, is poised to propel the augmented shopping market to even greater heights in the coming years. The integration of AR with other technologies like artificial intelligence (AI) will further enhance the personalization and effectiveness of AR shopping, fostering even more rapid market expansion.
Augmented Shopping Market Company Market Share
Augmented Shopping Market: A Comprehensive Report (2019-2033)
This dynamic report provides a deep dive into the burgeoning Augmented Shopping Market, offering invaluable insights for investors, businesses, and industry professionals. Leveraging extensive market research from 2019 to 2024 (historical period), with a base year of 2025 and forecast extending to 2033, this report delivers a comprehensive understanding of market size, trends, and future potential. The market is projected to reach xx Million by 2033, exhibiting a CAGR of xx% during the forecast period (2025-2033).
Augmented Shopping Market Structure & Competitive Landscape
The Augmented Shopping market is characterized by a moderately concentrated landscape, with key players like Apple Inc, PTC Vuforia, and Magic Leap vying for market share. However, the market is also witnessing significant innovation from smaller, specialized companies like Obsess and ModiFace. The competitive intensity is fueled by rapid technological advancements, particularly in AR/VR technologies, and the ongoing push for enhanced customer experiences.
Several factors influence market structure:
- Innovation Drivers: Continuous advancements in AR/VR hardware and software, improved image recognition, and the integration of AI and machine learning are crucial drivers of market expansion.
- Regulatory Impacts: Government regulations regarding data privacy and consumer protection are increasingly impacting market growth, forcing companies to adopt stricter compliance measures.
- Product Substitutes: While AR shopping currently enjoys a unique position, the emergence of advanced virtual reality (VR) experiences and other immersive technologies presents a potential substitute threat.
- End-User Segmentation: The market is segmented based on demographics (age, income), shopping preferences (online vs. in-store), and technological familiarity. Currently, younger demographics show a higher adoption rate.
- M&A Trends: The market has witnessed a moderate level of mergers and acquisitions (M&A) activity, primarily focusing on strategic alliances to gain access to new technologies and expand market reach. The volume of M&A deals in the period 2019-2024 totaled approximately xx. This trend is likely to accelerate in the coming years.
The Herfindahl-Hirschman Index (HHI) for the Augmented Shopping Market in 2024 was estimated at xx, indicating a moderately concentrated market.
Augmented Shopping Market Market Trends & Opportunities
The Augmented Shopping market is experiencing robust growth, driven by several key trends:
- Market Size Growth: The market size witnessed substantial growth from 2019 to 2024, reaching an estimated xx Million in 2025. This growth is expected to continue, fueled by the increasing adoption of smartphones and rising consumer interest in immersive shopping experiences.
- Technological Shifts: The market is being reshaped by the continuous evolution of AR/VR technologies. The improved accuracy and realism of AR overlays, coupled with faster processing speeds, are driving consumer engagement. The rise of 5G networks is also a major facilitator.
- Consumer Preferences: Consumers are increasingly demanding more personalized and interactive shopping experiences. AR offers retailers the opportunity to provide virtual try-ons, 3D product visualization, and interactive store layouts, boosting customer engagement and sales conversion.
- Competitive Dynamics: The market exhibits intense competition, with established tech giants and innovative startups vying for a share of the expanding market. This competition spurs innovation and creates greater consumer choice.
- Market Penetration: The market penetration rate of AR shopping applications is increasing steadily, driven by the growing popularity of mobile AR applications and the development of AR-enabled retail spaces. We estimate penetration to be xx% in 2025, projected to rise to xx% by 2033.
Dominant Markets & Segments in Augmented Shopping Market
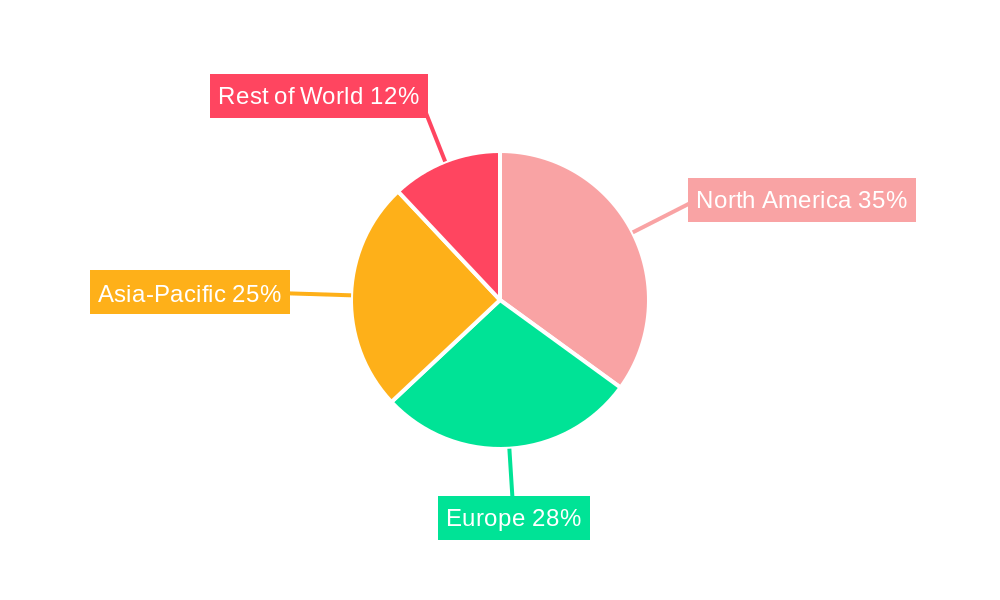
The global Augmented Shopping market is experiencing dynamic growth, with North America currently leading the charge due to its robust technological infrastructure, high smartphone penetration, and a strong consumer appetite for convenient, innovative shopping experiences. Europe and Asia-Pacific are rapidly emerging as key growth regions, fueled by increasing AR adoption, substantial R&D investments, and supportive government initiatives for digital transformation.
-
North America: Leading the Pack
- Technological Prowess: Advanced technological infrastructure and widespread smartphone adoption provide a solid foundation.
- Early Adopters: A proven track record of embracing new retail technologies and digital solutions.
- Consumer Spending Power: High disposable income coupled with a strong preference for efficient and engaging shopping journeys.
-
Europe: A Rising Force
- Broad AR Integration: The increasing application of AR across diverse sectors signals wider acceptance.
- Innovation Focus: Significant investments in research and development are driving technological advancements.
- Digital Forward Policies: Proactive government support for digitalization empowers market growth.
-
Asia-Pacific: Emerging Potential
- Rapid Digitalization: A fast-growing e-commerce landscape and increasing smartphone usage.
- Young, Tech-Savvy Population: High receptiveness to new technologies and digital shopping methods.
- Government Support: Initiatives promoting smart cities and digital infrastructure are creating fertile ground.
-
Market Dominance Rationale: North America's current leadership is anchored by its pioneering embrace of AR, the presence of major tech innovators, and a consumer base eager for enhanced digital retail interactions that offer both convenience and engaging product discovery.
Augmented Shopping Market Product Analysis
The Augmented Shopping market is characterized by a dynamic and expanding product ecosystem, ranging from intuitive AR applications for virtual try-ons and product visualization to comprehensive AR-powered in-store experiences. The evolution of these products is marked by the continuous integration of advanced features like photorealistic 3D modeling, interactive product demonstrations, and hyper-personalized recommendations. The most successful products in this space are those that achieve seamless integration with existing e-commerce platforms and deliver an exceptionally smooth, user-friendly experience. This focus on intuitive design and frictionless engagement is paramount for maximizing consumer interaction, boosting conversion rates, and establishing a distinct competitive advantage.
Key Drivers, Barriers & Challenges in Augmented Shopping Market
Key Growth Drivers:
- Technological Sophistication: Ongoing advancements in AR/VR hardware and software, coupled with the integration of AI and improved user interface design, are making augmented shopping more accessible and compelling.
- Evolving Consumer Expectations: A significant rise in consumer demand for immersive, interactive, and highly personalized shopping experiences is a primary catalyst.
- E-commerce Expansion: The relentless growth of online retail provides an ideal and expanding digital landscape for the seamless integration and adoption of AR shopping solutions.
- Enhanced Product Visualization: AR allows consumers to visualize products in their own environment, leading to increased confidence and reduced return rates.
Challenges and Restraints:
- Significant Implementation Costs: The initial investment required for implementing robust AR technology, particularly for brick-and-mortar retailers seeking to create immersive in-store experiences, can be substantial.
- Data Privacy and Security: The collection and utilization of consumer data for personalized experiences raise critical privacy concerns, necessitating stringent data protection measures and transparent policies.
- Interoperability and Standardization: A notable lack of universally adopted industry standards can impede seamless integration and interoperability across various AR platforms and devices.
- Technical Maturity and Performance: Current AR technology still faces limitations concerning accuracy, the realism of virtual objects, and stability in diverse real-world environments. Factors such as variable lighting conditions, complex backgrounds, and device processing power can impact performance and the overall user experience.
- Consumer Adoption Curve: While growing, widespread consumer understanding and adoption of AR shopping functionalities may still require time and educational efforts.
Growth Drivers in the Augmented Shopping Market Market
The Augmented Shopping market's growth is fueled by advancements in mobile AR technologies, making AR experiences more accessible. Expanding e-commerce adoption, combined with increasing consumer demand for interactive shopping experiences, are driving further growth. Furthermore, favorable government regulations and supportive investment initiatives in various regions are fostering market expansion.
Challenges Impacting Augmented Shopping Market Growth
Significant challenges include the high initial investment costs associated with implementing AR technologies, particularly for smaller retailers. Data privacy concerns and the lack of standardization across different platforms also pose obstacles. Competition among existing players and the potential emergence of disruptive technologies add further complexity to the landscape. These challenges could lead to a slowdown in market growth if not effectively addressed.
Key Players Shaping the Augmented Shopping Market Market
- Magic Leap
- Blippar
- Groove Jones
- IKEA Place
- ModiFace
- Obsess
- HoloLens
- Zugara Inc
- PTC Vuforia
- Apple Inc
Significant Augmented Shopping Market Industry Milestones
- August 2023: Blackjack Promotions launched its inaugural immersive AR campaign tailored for families, highlighting the expanding integration of augmented reality within the travel retail sector and demonstrating its potential for engaging diverse audiences.
- May 2024: The strategic partnership between Google and Magic Leap marks a pivotal advancement in AR technology and optical solutions. This collaboration is poised to drive significant improvements in the quality and accessibility of AR shopping experiences for consumers worldwide.
- Q4 2023: Major fashion retailers are increasingly integrating AR virtual try-on features into their mobile apps, reporting higher engagement rates and a reduction in product return percentages.
- Early 2024: The development of more sophisticated AI-powered AR assistants that can offer real-time styling advice and product recommendations based on user preferences and environmental context has gained traction.
Future Outlook for Augmented Shopping Market Market
The Augmented Shopping market is poised for significant growth in the coming years. Technological innovations, rising consumer adoption, and expanding e-commerce will continue to fuel market expansion. Strategic partnerships and investments in AR technology will drive further development and refinement, leading to more immersive and engaging shopping experiences. This will potentially reshape retail strategies and consumer expectations, driving substantial market growth.
Augmented Shopping Market Segmentation
-
1. Component
- 1.1. Solutions
- 1.2. Services
-
2. Application
- 2.1. Furniture and Lighting
- 2.2. Beauty and Cosmetics
- 2.3. Apparel Fitting
- 2.4. Grocery Shopping
- 2.5. Footwear
- 2.6. Other Applications
Augmented Shopping Market Segmentation By Geography
-
1. North America
- 1.1. United States
- 1.2. Canada
- 1.3. Rest of North America
-
2. Europe
- 2.1. Germany
- 2.2. United Kingdom
- 2.3. France
- 2.4. Russia
- 2.5. Spain
- 2.6. Rest of Europe
-
3. Asia Pacific
- 3.1. India
- 3.2. China
- 3.3. Japan
- 3.4. Rest of Asia Pacific
-
4. South America
- 4.1. Brazil
- 4.2. Argentina
- 4.3. Rest of South America
-
5. Middle East
- 5.1. United Arab Emirates
- 5.2. Saudi Arabia
- 5.3. Rest of Middle East
Augmented Shopping Market Regional Market Share
Geographic Coverage of Augmented Shopping Market
Augmented Shopping Market REPORT HIGHLIGHTS
| Aspects | Details |
|---|---|
| Study Period | 2020-2034 |
| Base Year | 2025 |
| Estimated Year | 2026 |
| Forecast Period | 2026-2034 |
| Historical Period | 2020-2025 |
| Growth Rate | CAGR of 15.78% from 2020-2034 |
| Segmentation |
|
Table of Contents
- 1. Introduction
- 1.1. Research Scope
- 1.2. Market Segmentation
- 1.3. Research Objective
- 1.4. Definitions and Assumptions
- 2. Executive Summary
- 2.1. Market Snapshot
- 3. Market Dynamics
- 3.1. Market Drivers
- 3.2. Market Restrains
- 3.3. Market Trends
- 3.4. Market Opportunities
- 4. Market Factor Analysis
- 4.1. Porters Five Forces
- 4.1.1. Bargaining Power of Suppliers
- 4.1.2. Bargaining Power of Buyers
- 4.1.3. Threat of New Entrants
- 4.1.4. Threat of Substitutes
- 4.1.5. Competitive Rivalry
- 4.2. PESTEL analysis
- 4.3. BCG Analysis
- 4.3.1. Stars (High Growth, High Market Share)
- 4.3.2. Cash Cows (Low Growth, High Market Share)
- 4.3.3. Question Mark (High Growth, Low Market Share)
- 4.3.4. Dogs (Low Growth, Low Market Share)
- 4.4. Ansoff Matrix Analysis
- 4.5. Supply Chain Analysis
- 4.6. Regulatory Landscape
- 4.7. Current Market Potential and Opportunity Assessment (TAM–SAM–SOM Framework)
- 4.8. TIR Analyst Note
- 4.1. Porters Five Forces
- 5. Market Analysis, Insights and Forecast 2021-2033
- 5.1. Market Analysis, Insights and Forecast - by Component
- 5.1.1. Solutions
- 5.1.2. Services
- 5.2. Market Analysis, Insights and Forecast - by Application
- 5.2.1. Furniture and Lighting
- 5.2.2. Beauty and Cosmetics
- 5.2.3. Apparel Fitting
- 5.2.4. Grocery Shopping
- 5.2.5. Footwear
- 5.2.6. Other Applications
- 5.3. Market Analysis, Insights and Forecast - by Region
- 5.3.1. North America
- 5.3.2. Europe
- 5.3.3. Asia Pacific
- 5.3.4. South America
- 5.3.5. Middle East
- 5.1. Market Analysis, Insights and Forecast - by Component
- 6. Global Augmented Shopping Market Analysis, Insights and Forecast, 2021-2033
- 6.1. Market Analysis, Insights and Forecast - by Component
- 6.1.1. Solutions
- 6.1.2. Services
- 6.2. Market Analysis, Insights and Forecast - by Application
- 6.2.1. Furniture and Lighting
- 6.2.2. Beauty and Cosmetics
- 6.2.3. Apparel Fitting
- 6.2.4. Grocery Shopping
- 6.2.5. Footwear
- 6.2.6. Other Applications
- 6.1. Market Analysis, Insights and Forecast - by Component
- 7. North America Augmented Shopping Market Analysis, Insights and Forecast, 2020-2032
- 7.1. Market Analysis, Insights and Forecast - by Component
- 7.1.1. Solutions
- 7.1.2. Services
- 7.2. Market Analysis, Insights and Forecast - by Application
- 7.2.1. Furniture and Lighting
- 7.2.2. Beauty and Cosmetics
- 7.2.3. Apparel Fitting
- 7.2.4. Grocery Shopping
- 7.2.5. Footwear
- 7.2.6. Other Applications
- 7.1. Market Analysis, Insights and Forecast - by Component
- 8. Europe Augmented Shopping Market Analysis, Insights and Forecast, 2020-2032
- 8.1. Market Analysis, Insights and Forecast - by Component
- 8.1.1. Solutions
- 8.1.2. Services
- 8.2. Market Analysis, Insights and Forecast - by Application
- 8.2.1. Furniture and Lighting
- 8.2.2. Beauty and Cosmetics
- 8.2.3. Apparel Fitting
- 8.2.4. Grocery Shopping
- 8.2.5. Footwear
- 8.2.6. Other Applications
- 8.1. Market Analysis, Insights and Forecast - by Component
- 9. Asia Pacific Augmented Shopping Market Analysis, Insights and Forecast, 2020-2032
- 9.1. Market Analysis, Insights and Forecast - by Component
- 9.1.1. Solutions
- 9.1.2. Services
- 9.2. Market Analysis, Insights and Forecast - by Application
- 9.2.1. Furniture and Lighting
- 9.2.2. Beauty and Cosmetics
- 9.2.3. Apparel Fitting
- 9.2.4. Grocery Shopping
- 9.2.5. Footwear
- 9.2.6. Other Applications
- 9.1. Market Analysis, Insights and Forecast - by Component
- 10. South America Augmented Shopping Market Analysis, Insights and Forecast, 2020-2032
- 10.1. Market Analysis, Insights and Forecast - by Component
- 10.1.1. Solutions
- 10.1.2. Services
- 10.2. Market Analysis, Insights and Forecast - by Application
- 10.2.1. Furniture and Lighting
- 10.2.2. Beauty and Cosmetics
- 10.2.3. Apparel Fitting
- 10.2.4. Grocery Shopping
- 10.2.5. Footwear
- 10.2.6. Other Applications
- 10.1. Market Analysis, Insights and Forecast - by Component
- 11. Middle East Augmented Shopping Market Analysis, Insights and Forecast, 2020-2032
- 11.1. Market Analysis, Insights and Forecast - by Component
- 11.1.1. Solutions
- 11.1.2. Services
- 11.2. Market Analysis, Insights and Forecast - by Application
- 11.2.1. Furniture and Lighting
- 11.2.2. Beauty and Cosmetics
- 11.2.3. Apparel Fitting
- 11.2.4. Grocery Shopping
- 11.2.5. Footwear
- 11.2.6. Other Applications
- 11.1. Market Analysis, Insights and Forecast - by Component
- 12. Competitive Analysis
- 12.1. Company Profiles
- 12.1.1 Magic Leap
- 12.1.1.1. Company Overview
- 12.1.1.2. Products
- 12.1.1.3. Company Financials
- 12.1.1.4. SWOT Analysis
- 12.1.2 Blippar
- 12.1.2.1. Company Overview
- 12.1.2.2. Products
- 12.1.2.3. Company Financials
- 12.1.2.4. SWOT Analysis
- 12.1.3 Groove Jones
- 12.1.3.1. Company Overview
- 12.1.3.2. Products
- 12.1.3.3. Company Financials
- 12.1.3.4. SWOT Analysis
- 12.1.4 IKEA Place
- 12.1.4.1. Company Overview
- 12.1.4.2. Products
- 12.1.4.3. Company Financials
- 12.1.4.4. SWOT Analysis
- 12.1.5 ModiFace
- 12.1.5.1. Company Overview
- 12.1.5.2. Products
- 12.1.5.3. Company Financials
- 12.1.5.4. SWOT Analysis
- 12.1.6 Obsess
- 12.1.6.1. Company Overview
- 12.1.6.2. Products
- 12.1.6.3. Company Financials
- 12.1.6.4. SWOT Analysis
- 12.1.7 HoloLens
- 12.1.7.1. Company Overview
- 12.1.7.2. Products
- 12.1.7.3. Company Financials
- 12.1.7.4. SWOT Analysis
- 12.1.8 Zugara Inc
- 12.1.8.1. Company Overview
- 12.1.8.2. Products
- 12.1.8.3. Company Financials
- 12.1.8.4. SWOT Analysis
- 12.1.9 PTC Vuforia
- 12.1.9.1. Company Overview
- 12.1.9.2. Products
- 12.1.9.3. Company Financials
- 12.1.9.4. SWOT Analysis
- 12.1.10 Apple Inc **List Not Exhaustive
- 12.1.10.1. Company Overview
- 12.1.10.2. Products
- 12.1.10.3. Company Financials
- 12.1.10.4. SWOT Analysis
- 12.1.1 Magic Leap
- 12.2. Market Entropy
- 12.2.1 Company's Key Areas Served
- 12.2.2 Recent Developments
- 12.3. Company Market Share Analysis 2025
- 12.3.1 Top 5 Companies Market Share Analysis
- 12.3.2 Top 3 Companies Market Share Analysis
- 12.4. List of Potential Customers
- 13. Research Methodology
List of Figures
- Figure 1: Global Augmented Shopping Market Revenue Breakdown (Million, %) by Region 2025 & 2033
- Figure 2: Global Augmented Shopping Market Volume Breakdown (Billion, %) by Region 2025 & 2033
- Figure 3: North America Augmented Shopping Market Revenue (Million), by Component 2025 & 2033
- Figure 4: North America Augmented Shopping Market Volume (Billion), by Component 2025 & 2033
- Figure 5: North America Augmented Shopping Market Revenue Share (%), by Component 2025 & 2033
- Figure 6: North America Augmented Shopping Market Volume Share (%), by Component 2025 & 2033
- Figure 7: North America Augmented Shopping Market Revenue (Million), by Application 2025 & 2033
- Figure 8: North America Augmented Shopping Market Volume (Billion), by Application 2025 & 2033
- Figure 9: North America Augmented Shopping Market Revenue Share (%), by Application 2025 & 2033
- Figure 10: North America Augmented Shopping Market Volume Share (%), by Application 2025 & 2033
- Figure 11: North America Augmented Shopping Market Revenue (Million), by Country 2025 & 2033
- Figure 12: North America Augmented Shopping Market Volume (Billion), by Country 2025 & 2033
- Figure 13: North America Augmented Shopping Market Revenue Share (%), by Country 2025 & 2033
- Figure 14: North America Augmented Shopping Market Volume Share (%), by Country 2025 & 2033
- Figure 15: Europe Augmented Shopping Market Revenue (Million), by Component 2025 & 2033
- Figure 16: Europe Augmented Shopping Market Volume (Billion), by Component 2025 & 2033
- Figure 17: Europe Augmented Shopping Market Revenue Share (%), by Component 2025 & 2033
- Figure 18: Europe Augmented Shopping Market Volume Share (%), by Component 2025 & 2033
- Figure 19: Europe Augmented Shopping Market Revenue (Million), by Application 2025 & 2033
- Figure 20: Europe Augmented Shopping Market Volume (Billion), by Application 2025 & 2033
- Figure 21: Europe Augmented Shopping Market Revenue Share (%), by Application 2025 & 2033
- Figure 22: Europe Augmented Shopping Market Volume Share (%), by Application 2025 & 2033
- Figure 23: Europe Augmented Shopping Market Revenue (Million), by Country 2025 & 2033
- Figure 24: Europe Augmented Shopping Market Volume (Billion), by Country 2025 & 2033
- Figure 25: Europe Augmented Shopping Market Revenue Share (%), by Country 2025 & 2033
- Figure 26: Europe Augmented Shopping Market Volume Share (%), by Country 2025 & 2033
- Figure 27: Asia Pacific Augmented Shopping Market Revenue (Million), by Component 2025 & 2033
- Figure 28: Asia Pacific Augmented Shopping Market Volume (Billion), by Component 2025 & 2033
- Figure 29: Asia Pacific Augmented Shopping Market Revenue Share (%), by Component 2025 & 2033
- Figure 30: Asia Pacific Augmented Shopping Market Volume Share (%), by Component 2025 & 2033
- Figure 31: Asia Pacific Augmented Shopping Market Revenue (Million), by Application 2025 & 2033
- Figure 32: Asia Pacific Augmented Shopping Market Volume (Billion), by Application 2025 & 2033
- Figure 33: Asia Pacific Augmented Shopping Market Revenue Share (%), by Application 2025 & 2033
- Figure 34: Asia Pacific Augmented Shopping Market Volume Share (%), by Application 2025 & 2033
- Figure 35: Asia Pacific Augmented Shopping Market Revenue (Million), by Country 2025 & 2033
- Figure 36: Asia Pacific Augmented Shopping Market Volume (Billion), by Country 2025 & 2033
- Figure 37: Asia Pacific Augmented Shopping Market Revenue Share (%), by Country 2025 & 2033
- Figure 38: Asia Pacific Augmented Shopping Market Volume Share (%), by Country 2025 & 2033
- Figure 39: South America Augmented Shopping Market Revenue (Million), by Component 2025 & 2033
- Figure 40: South America Augmented Shopping Market Volume (Billion), by Component 2025 & 2033
- Figure 41: South America Augmented Shopping Market Revenue Share (%), by Component 2025 & 2033
- Figure 42: South America Augmented Shopping Market Volume Share (%), by Component 2025 & 2033
- Figure 43: South America Augmented Shopping Market Revenue (Million), by Application 2025 & 2033
- Figure 44: South America Augmented Shopping Market Volume (Billion), by Application 2025 & 2033
- Figure 45: South America Augmented Shopping Market Revenue Share (%), by Application 2025 & 2033
- Figure 46: South America Augmented Shopping Market Volume Share (%), by Application 2025 & 2033
- Figure 47: South America Augmented Shopping Market Revenue (Million), by Country 2025 & 2033
- Figure 48: South America Augmented Shopping Market Volume (Billion), by Country 2025 & 2033
- Figure 49: South America Augmented Shopping Market Revenue Share (%), by Country 2025 & 2033
- Figure 50: South America Augmented Shopping Market Volume Share (%), by Country 2025 & 2033
- Figure 51: Middle East Augmented Shopping Market Revenue (Million), by Component 2025 & 2033
- Figure 52: Middle East Augmented Shopping Market Volume (Billion), by Component 2025 & 2033
- Figure 53: Middle East Augmented Shopping Market Revenue Share (%), by Component 2025 & 2033
- Figure 54: Middle East Augmented Shopping Market Volume Share (%), by Component 2025 & 2033
- Figure 55: Middle East Augmented Shopping Market Revenue (Million), by Application 2025 & 2033
- Figure 56: Middle East Augmented Shopping Market Volume (Billion), by Application 2025 & 2033
- Figure 57: Middle East Augmented Shopping Market Revenue Share (%), by Application 2025 & 2033
- Figure 58: Middle East Augmented Shopping Market Volume Share (%), by Application 2025 & 2033
- Figure 59: Middle East Augmented Shopping Market Revenue (Million), by Country 2025 & 2033
- Figure 60: Middle East Augmented Shopping Market Volume (Billion), by Country 2025 & 2033
- Figure 61: Middle East Augmented Shopping Market Revenue Share (%), by Country 2025 & 2033
- Figure 62: Middle East Augmented Shopping Market Volume Share (%), by Country 2025 & 2033
List of Tables
- Table 1: Global Augmented Shopping Market Revenue Million Forecast, by Component 2020 & 2033
- Table 2: Global Augmented Shopping Market Volume Billion Forecast, by Component 2020 & 2033
- Table 3: Global Augmented Shopping Market Revenue Million Forecast, by Application 2020 & 2033
- Table 4: Global Augmented Shopping Market Volume Billion Forecast, by Application 2020 & 2033
- Table 5: Global Augmented Shopping Market Revenue Million Forecast, by Region 2020 & 2033
- Table 6: Global Augmented Shopping Market Volume Billion Forecast, by Region 2020 & 2033
- Table 7: Global Augmented Shopping Market Revenue Million Forecast, by Component 2020 & 2033
- Table 8: Global Augmented Shopping Market Volume Billion Forecast, by Component 2020 & 2033
- Table 9: Global Augmented Shopping Market Revenue Million Forecast, by Application 2020 & 2033
- Table 10: Global Augmented Shopping Market Volume Billion Forecast, by Application 2020 & 2033
- Table 11: Global Augmented Shopping Market Revenue Million Forecast, by Country 2020 & 2033
- Table 12: Global Augmented Shopping Market Volume Billion Forecast, by Country 2020 & 2033
- Table 13: United States Augmented Shopping Market Revenue (Million) Forecast, by Application 2020 & 2033
- Table 14: United States Augmented Shopping Market Volume (Billion) Forecast, by Application 2020 & 2033
- Table 15: Canada Augmented Shopping Market Revenue (Million) Forecast, by Application 2020 & 2033
- Table 16: Canada Augmented Shopping Market Volume (Billion) Forecast, by Application 2020 & 2033
- Table 17: Rest of North America Augmented Shopping Market Revenue (Million) Forecast, by Application 2020 & 2033
- Table 18: Rest of North America Augmented Shopping Market Volume (Billion) Forecast, by Application 2020 & 2033
- Table 19: Global Augmented Shopping Market Revenue Million Forecast, by Component 2020 & 2033
- Table 20: Global Augmented Shopping Market Volume Billion Forecast, by Component 2020 & 2033
- Table 21: Global Augmented Shopping Market Revenue Million Forecast, by Application 2020 & 2033
- Table 22: Global Augmented Shopping Market Volume Billion Forecast, by Application 2020 & 2033
- Table 23: Global Augmented Shopping Market Revenue Million Forecast, by Country 2020 & 2033
- Table 24: Global Augmented Shopping Market Volume Billion Forecast, by Country 2020 & 2033
- Table 25: Germany Augmented Shopping Market Revenue (Million) Forecast, by Application 2020 & 2033
- Table 26: Germany Augmented Shopping Market Volume (Billion) Forecast, by Application 2020 & 2033
- Table 27: United Kingdom Augmented Shopping Market Revenue (Million) Forecast, by Application 2020 & 2033
- Table 28: United Kingdom Augmented Shopping Market Volume (Billion) Forecast, by Application 2020 & 2033
- Table 29: France Augmented Shopping Market Revenue (Million) Forecast, by Application 2020 & 2033
- Table 30: France Augmented Shopping Market Volume (Billion) Forecast, by Application 2020 & 2033
- Table 31: Russia Augmented Shopping Market Revenue (Million) Forecast, by Application 2020 & 2033
- Table 32: Russia Augmented Shopping Market Volume (Billion) Forecast, by Application 2020 & 2033
- Table 33: Spain Augmented Shopping Market Revenue (Million) Forecast, by Application 2020 & 2033
- Table 34: Spain Augmented Shopping Market Volume (Billion) Forecast, by Application 2020 & 2033
- Table 35: Rest of Europe Augmented Shopping Market Revenue (Million) Forecast, by Application 2020 & 2033
- Table 36: Rest of Europe Augmented Shopping Market Volume (Billion) Forecast, by Application 2020 & 2033
- Table 37: Global Augmented Shopping Market Revenue Million Forecast, by Component 2020 & 2033
- Table 38: Global Augmented Shopping Market Volume Billion Forecast, by Component 2020 & 2033
- Table 39: Global Augmented Shopping Market Revenue Million Forecast, by Application 2020 & 2033
- Table 40: Global Augmented Shopping Market Volume Billion Forecast, by Application 2020 & 2033
- Table 41: Global Augmented Shopping Market Revenue Million Forecast, by Country 2020 & 2033
- Table 42: Global Augmented Shopping Market Volume Billion Forecast, by Country 2020 & 2033
- Table 43: India Augmented Shopping Market Revenue (Million) Forecast, by Application 2020 & 2033
- Table 44: India Augmented Shopping Market Volume (Billion) Forecast, by Application 2020 & 2033
- Table 45: China Augmented Shopping Market Revenue (Million) Forecast, by Application 2020 & 2033
- Table 46: China Augmented Shopping Market Volume (Billion) Forecast, by Application 2020 & 2033
- Table 47: Japan Augmented Shopping Market Revenue (Million) Forecast, by Application 2020 & 2033
- Table 48: Japan Augmented Shopping Market Volume (Billion) Forecast, by Application 2020 & 2033
- Table 49: Rest of Asia Pacific Augmented Shopping Market Revenue (Million) Forecast, by Application 2020 & 2033
- Table 50: Rest of Asia Pacific Augmented Shopping Market Volume (Billion) Forecast, by Application 2020 & 2033
- Table 51: Global Augmented Shopping Market Revenue Million Forecast, by Component 2020 & 2033
- Table 52: Global Augmented Shopping Market Volume Billion Forecast, by Component 2020 & 2033
- Table 53: Global Augmented Shopping Market Revenue Million Forecast, by Application 2020 & 2033
- Table 54: Global Augmented Shopping Market Volume Billion Forecast, by Application 2020 & 2033
- Table 55: Global Augmented Shopping Market Revenue Million Forecast, by Country 2020 & 2033
- Table 56: Global Augmented Shopping Market Volume Billion Forecast, by Country 2020 & 2033
- Table 57: Brazil Augmented Shopping Market Revenue (Million) Forecast, by Application 2020 & 2033
- Table 58: Brazil Augmented Shopping Market Volume (Billion) Forecast, by Application 2020 & 2033
- Table 59: Argentina Augmented Shopping Market Revenue (Million) Forecast, by Application 2020 & 2033
- Table 60: Argentina Augmented Shopping Market Volume (Billion) Forecast, by Application 2020 & 2033
- Table 61: Rest of South America Augmented Shopping Market Revenue (Million) Forecast, by Application 2020 & 2033
- Table 62: Rest of South America Augmented Shopping Market Volume (Billion) Forecast, by Application 2020 & 2033
- Table 63: Global Augmented Shopping Market Revenue Million Forecast, by Component 2020 & 2033
- Table 64: Global Augmented Shopping Market Volume Billion Forecast, by Component 2020 & 2033
- Table 65: Global Augmented Shopping Market Revenue Million Forecast, by Application 2020 & 2033
- Table 66: Global Augmented Shopping Market Volume Billion Forecast, by Application 2020 & 2033
- Table 67: Global Augmented Shopping Market Revenue Million Forecast, by Country 2020 & 2033
- Table 68: Global Augmented Shopping Market Volume Billion Forecast, by Country 2020 & 2033
- Table 69: United Arab Emirates Augmented Shopping Market Revenue (Million) Forecast, by Application 2020 & 2033
- Table 70: United Arab Emirates Augmented Shopping Market Volume (Billion) Forecast, by Application 2020 & 2033
- Table 71: Saudi Arabia Augmented Shopping Market Revenue (Million) Forecast, by Application 2020 & 2033
- Table 72: Saudi Arabia Augmented Shopping Market Volume (Billion) Forecast, by Application 2020 & 2033
- Table 73: Rest of Middle East Augmented Shopping Market Revenue (Million) Forecast, by Application 2020 & 2033
- Table 74: Rest of Middle East Augmented Shopping Market Volume (Billion) Forecast, by Application 2020 & 2033
Frequently Asked Questions
1. What is the projected Compound Annual Growth Rate (CAGR) of the Augmented Shopping Market?
The projected CAGR is approximately 15.78%.
2. Which companies are prominent players in the Augmented Shopping Market?
Key companies in the market include Magic Leap, Blippar, Groove Jones, IKEA Place, ModiFace, Obsess, HoloLens, Zugara Inc, PTC Vuforia, Apple Inc **List Not Exhaustive.
3. What are the main segments of the Augmented Shopping Market?
The market segments include Component , Application.
4. Can you provide details about the market size?
The market size is estimated to be USD 15.52 Million as of 2022.
5. What are some drivers contributing to market growth?
The Growing Number of Smartphone and Tablets is Driving the Market; Technological Advancements is Driving the Market.
6. What are the notable trends driving market growth?
Growing Demand for Furniture and Lighting in Asia-Pacific.
7. Are there any restraints impacting market growth?
The Growing Number of Smartphone and Tablets is Driving the Market; Technological Advancements is Driving the Market.
8. Can you provide examples of recent developments in the market?
May 2024: Alphabet Inc.'s Google and the augmented reality startup Magic Leap Inc. revealed a strategic partnership. The collaboration aims to focus on developing augmented reality (AR) and optical solutions.August 2023: In collaboration with Dufry, Blackjack Promotions, a UK travel retail and brand experience provider, introduced its first immersive augmented reality campaign targeted at families.
9. What pricing options are available for accessing the report?
Pricing options include single-user, multi-user, and enterprise licenses priced at USD 4750, USD 5250, and USD 8750 respectively.
10. Is the market size provided in terms of value or volume?
The market size is provided in terms of value, measured in Million and volume, measured in Billion.
11. Are there any specific market keywords associated with the report?
Yes, the market keyword associated with the report is "Augmented Shopping Market," which aids in identifying and referencing the specific market segment covered.
12. How do I determine which pricing option suits my needs best?
The pricing options vary based on user requirements and access needs. Individual users may opt for single-user licenses, while businesses requiring broader access may choose multi-user or enterprise licenses for cost-effective access to the report.
13. Are there any additional resources or data provided in the Augmented Shopping Market report?
While the report offers comprehensive insights, it's advisable to review the specific contents or supplementary materials provided to ascertain if additional resources or data are available.
14. How can I stay updated on further developments or reports in the Augmented Shopping Market?
To stay informed about further developments, trends, and reports in the Augmented Shopping Market, consider subscribing to industry newsletters, following relevant companies and organizations, or regularly checking reputable industry news sources and publications.
Methodology
Step 1 - Identification of Relevant Samples Size from Population Database


Step 2 - Approaches for Defining Global Market Size (Value, Volume* & Price*)

Note*: In applicable scenarios
Step 3 - Data Sources
Primary Research
- Web Analytics
- Survey Reports
- Research Institute
- Latest Research Reports
- Opinion Leaders
Secondary Research
- Annual Reports
- White Paper
- Latest Press Release
- Industry Association
- Paid Database
- Investor Presentations

Step 4 - Data Triangulation
Involves using different sources of information in order to increase the validity of a study
These sources are likely to be stakeholders in a program - participants, other researchers, program staff, other community members, and so on.
Then we put all data in single framework & apply various statistical tools to find out the dynamic on the market.
During the analysis stage, feedback from the stakeholder groups would be compared to determine areas of agreement as well as areas of divergence